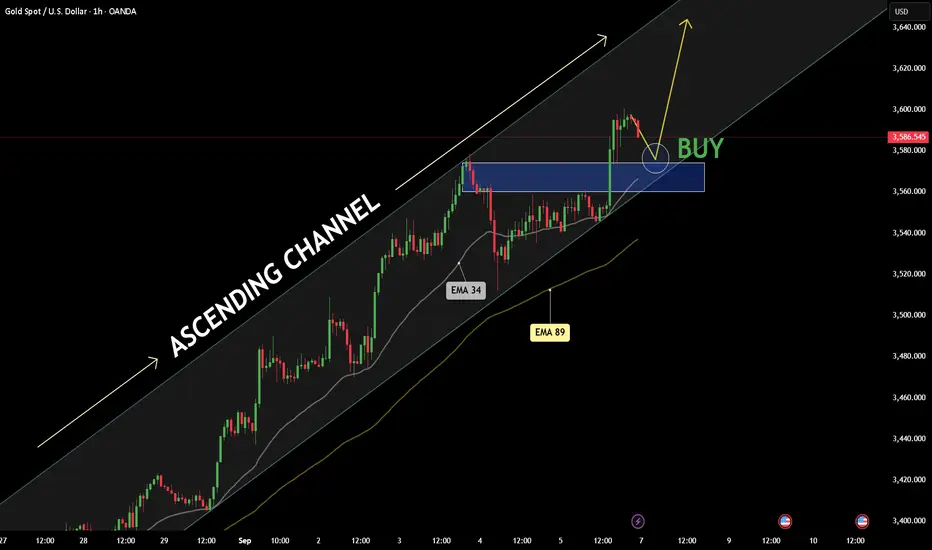
Gold battles for new highs.Hi everyone, Dorian here!
Gold continues to surprise as it hits the $3,600 mark for the first time in history, with an impressive 500-pip increase in just a few hours. This surge is driven by the weakening of the U.S. dollar and expectations that the Federal Reserve will cut interest rates this month.
On the chart, XAU/USD remains stable, currently hovering around $3,586. A new support level has formed, and after testing, gold may continue its upward trend. If this support level holds, I believe nothing will be able to stop gold from gaining momentum in the coming days, reaching new highs in 2025.
So, what are your thoughts on gold’s direction in the near future? Share your thoughts in the comments below!
GOLD-BUY
Gold at the Crossroads: Decisive Battle at $3,600 After BreakoutAsset: XAUUSD ( Gold Spot / US Dollar )
Analysis Date: September 5, 2025
Current Closing Price: $3,586.54 (as of 12:59 AM UTC+4)
Timeframes Analyzed: 1H, 4H, D, W
Market Context: Record High Territory - Bullish Momentum Sustained
Executive Summary & Market Outlook
Gold (XAUUSD) has executed a critical technical breakout, pushing above the $3,580 resistance and challenging the monumental $3,600 psychological and technical barrier. The asset is in a firm bullish trend but is now testing a zone where profit-taking and fresh selling pressure historically emerge. The price action in the coming sessions will be decisive. A sustained break above $3,600 could trigger a momentum-fueled rally towards $3,650, while a rejection here may form a short-term top, leading to a retracement towards $3,550 support. This analysis integrates multi-timeframe signals for intraday and swing traders.
Multi-Timeframe Technical Analysis
1. Trend Analysis (Daily & 4-Hour Chart):
Primary Trend: Bullish. The sequence of Higher Highs (HH) and Higher Lows (HL) is unequivocal on the daily chart.
Momentum: The breakout above the previous resistance near $3,580 is a significant bullish victory. However, the rapid ascent has left the price extended, increasing the probability of a consolidation or pullback.
2. Key Chart Patterns & Theories:
Breakout & Re-test Pattern: The move above $3,580 has broken the structure of the previous consolidation. The ideal bullish scenario now involves a successful re-test of the $3,580 level as new support. This would confirm the breakout's validity and offer a high-probability long entry.
Elliott Wave Theory: The rally from the last significant low is impulsive in nature. We are likely in a later stage of a Wave 3 or a Wave 5 extension. This suggests that while the trend is up, the cycle is maturing. Wave 4 corrections typically retrace to the 38.2% Fibonacci level of Wave 3, which would be near $3,520.
Gann Theory: The $3,600 level represents a key psychological and mathematical resistance. A decisive break and close above it could open the path to the next Gann angle/resistance level, projected near $3,620-$3,630.
Ichimoku Cloud (H4/D1): Price is trading well above the Senkou Span (Cloud) on both timeframes, confirming the strong bullish trend. The Cloud itself is thick and rising, providing strong dynamic support far below current levels.
3. Critical Support & Resistance Levels:
Resistance (R1): $3,600 - $3,610 (Key Psychological & Technical Barrier)
Resistance (R2): $3,630 (Next Projected Target)
Resistance (R3): $3,650 (Measured Move Target)
Current Closing Price: ~$3,586.54
Support (S1): $3,580 (Previous Resistance - New Potential Support)
Support (S2): $3,550 - $3,555 (Bullish Trend Line & 21-period EMA confluence)
Support (S3): $3,520 (Major Swing Low & 38.2% Fib Retracement)
4. Indicator Consensus:
RSI (14-period on 4H): Reading is in the 68-72 range, touching on overbought territory. This does not signal an immediate reversal but warns that buying momentum may be overextended in the short term. Watch for bearish divergence on the 1H chart for early signs of a pullback.
Bollinger Bands (4H): Price is peeking outside the upper band, a classic sign of a strong trending move. A move back inside the bands will signal a pause in the trend.
Moving Averages: The bullish alignment (EMA8 > EMA21 > EMA50) is perfect on all timeframes. The EMA 21 on the 4H chart (~$3,555) has acted as dynamic support and is a key level for the bullish thesis.
Volume & VWAP: Volume spiked on the initial breakout. The Anchored VWAP (from the recent swing low) shows price is extended above the mean. A pullback to the VWAP would be a healthy development.
Trading Strategy & Forecast
A. Intraday Trading Strategy (5M - 1H Charts):
Bullish Scenario (Breakout Hold): A pullback to the $3,580 - $3,582 area that finds support (e.g., bullish pin bar, engulfing pattern) presents a low-risk long opportunity. Entry: On bullish confirmation at support. Stop Loss: Below $3,575. Target: $3,600 (TP1), $3,610 (TP2).
Bearish Scenario (Rejection at Highs): If price fails to break $3,600 and shows rejection (long upper wicks, RSI divergence), a short trade for a pullback to $3,570 - $3,575 is viable. Entry: On rejection signals. Stop Loss: Tight, above $3,605. Target: $3,565 (S1).
Momentum Breakout: A strong 1H close above $3,605 could be faded with a small long position, targeting $3,620.
B. Swing Trading Strategy (4H - D Charts):
Bullish Bias: The strategy remains "buy the dip." The most attractive zones for adding long positions are a successful re-test of $3,580 or a deeper pullback to the stronger support confluence at $3,550 - $3,555.
Bearish Risk: A daily close back below $3,560 would be a warning sign that the breakout may have failed (a potential bull trap), opening the door for a deeper correction to $3,520. This would invalidate the immediate upside breakout scenario.
Risk Management & Conclusion
Key Risk Events: Monitor for any surprise geopolitical developments or unexpectedly hawkish comments from Fed officials, which could trigger a "flight-to-safety" rally or a dollar-strength selloff in gold, respectively.
Position Sizing: The increased volatility at key levels demands conservative position sizing. Risk no more than 1% of capital per trade.
Conclusion: XAUUSD is at a critical technical and psychological juncture. The breakout is bullish, but the battle for $3,600 is the key to the next directional move. Swing traders should be patient for a better risk/reward entry on a pullback. Intraday traders can play the range between $3,580 and $3,600 until a decisive break occurs. The overall structure favors the bulls, but a period of consolidation is the most likely immediate outcome.
Overall Bias: 🟢 Bullish above $3,555 | 🟡 Neutral/Bearish below $3,560
For individuals seeking to enhance their trading abilities based on the analyses provided, I recommend exploring the mentoring program offered by Shunya Trade. (Website: shunya dot trade)
I would appreciate your feedback on this analysis, as it will serve as a valuable resource for future endeavors.
Sincerely,
Shunya.Trade
Website: shunya dot trade
Disclaimer: This post is intended solely for educational purposes and does not constitute investment advice, financial advice, or trading recommendations. The views expressed herein are derived from technical analysis and are shared for informational purposes only. The stock market inherently carries risks, including the potential for capital loss. Therefore, readers are strongly advised to exercise prudent judgment before making any investment decisions. We assume no liability for any actions taken based on this content. For personalized guidance, it is recommended to consult a certified financial advisor.
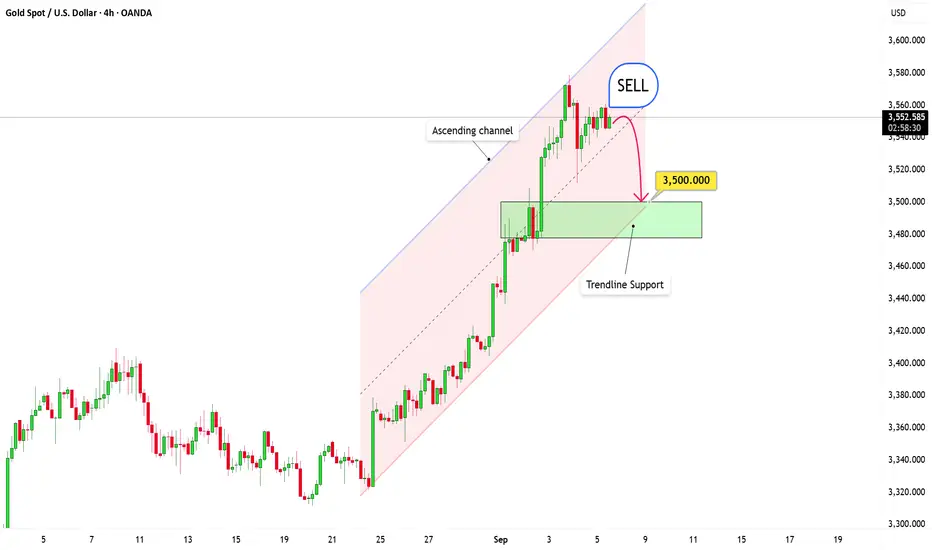
Gold Technical Analysis – The Pullback DeepensHi everyone, let’s take a closer look at XAUUSD today!
Gold is still trading inside a broad upward channel, but momentum has slowed and the market is now in a corrective phase. After a strong rally, the pullback looks natural — with eyes on the 3,500 zone, where multiple supports converge: horizontal, trendline, and the 0.618 Fibonacci level.
This area is the real battleground. Hold the line, and buyers may step back in with force. Lose it, and the bullish structure breaks, paving the way for a deeper decline.
Stay sharp, validate your setups, and keep risk under control.
Good luck out there!
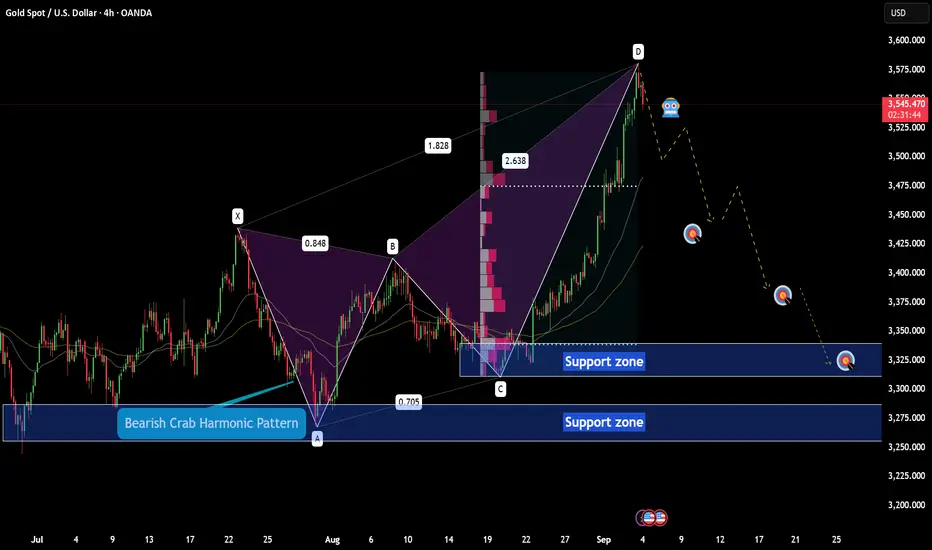
XAUUSD – Bearish Crab Signals a Potential PullbackXAUUSD – Bearish Crab Signals a Potential Pullback
Today’s macro backdrop is weighing on gold as the USD recovers and bond yields edge higher, reducing expectations of an imminent Fed rate cut. This has cooled safe-haven demand and opened the door for profit-taking after the strong rally.
On the H4 chart, price has completed a Bearish Crab pattern at key extension levels, with reversal signals emerging near the 3,550 peak. This suggests the market may be entering a short-term corrective phase.
Key levels to watch:
Near-term resistance : 3,540–3,555
Target support 1 : 3,475–3,450
Target support 2 : 3,350–3,330
Deeper support : 3,290–3,270
The short-term bias has shifted toward the downside. Any technical pullback is likely to offer opportunities for sellers to rejoin.
Where do you think gold will find its next support in this correction?
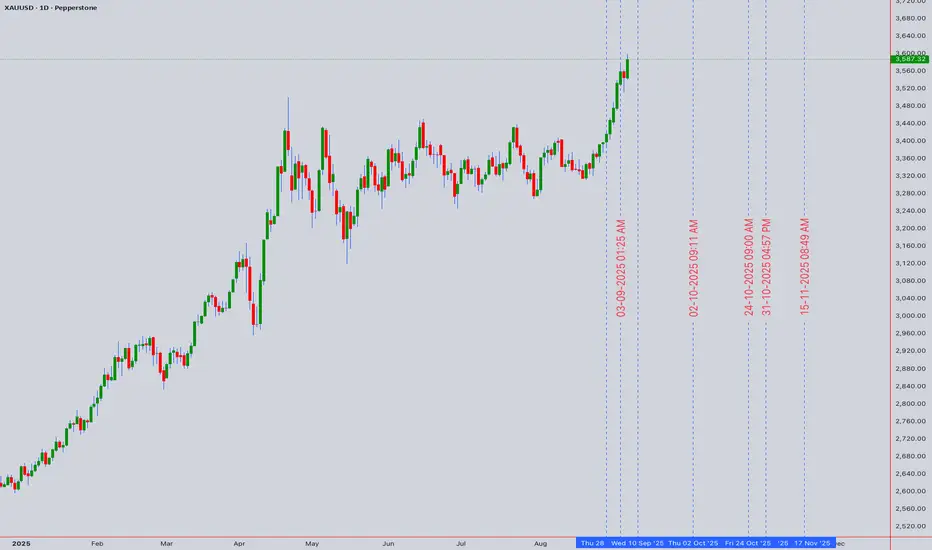
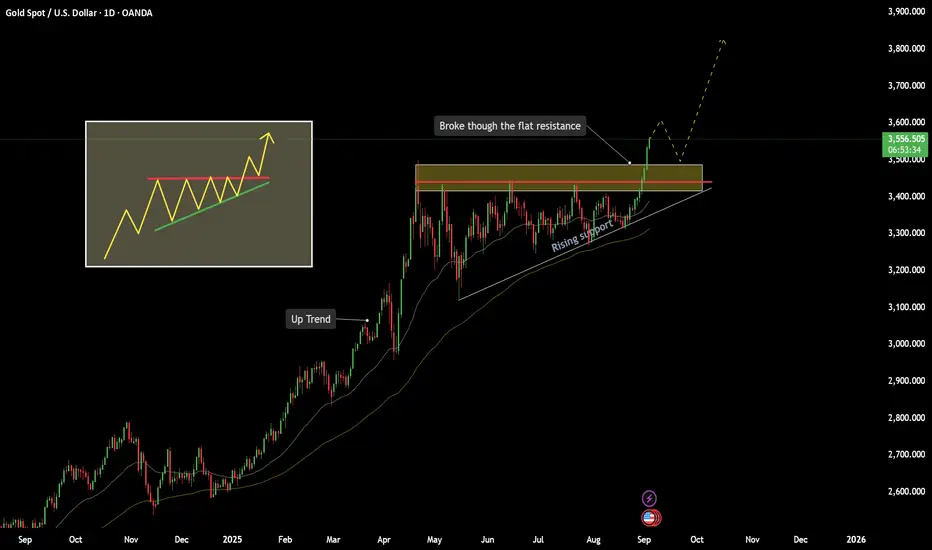
XAUUSD – A New Bullish Wave Has BegunXAUUSD – A New Bullish Wave Has Begun
The Daily chart shows that gold has decisively broken above the flat resistance around 3,500 , marking a strong breakout after months of consolidation. This move completes the Ascending Triangle formation, confirming that buying pressure is in control.
In the short term, after the recent surge, the market may retrace slightly toward the 3,500–3,520 zone to retest this new support. If this level holds, the bullish trend is likely to continue, paving the way for further upside.
Key levels to watch:
Major Support: 3,500–3,520
Immediate Resistance: 3,575–3,600
Next Target: 3,700–3,750-3,800 if momentum remains strong
Technical signals remain aligned with the bulls. Any pullback should be seen as an opportunity to join the prevailing uptrend.
Do you think gold will push toward the 3,700 mark in this bullish wave?
Gold Trading Strategy XAUUSD 20/8/2025Gold Trading Strategy XAUUSD 20/8/2025: Gold falls to lowest level since early this month, continues to be under pressure from potential talks, watching the FED minutes.
Fundamental news: Spot gold prices fell sharply, hitting their lowest intraday level since August 1. Gold prices fell as US President Donald Trump, Ukrainian President Zelensky and European leaders discussed potential talks with Russia. Safe-haven demand eased as security speculation in Kiev sparked optimism that the war could end.
Technical analysis: Gold prices broke out of a bullish pattern and formed a bearish channel on the H1 timeframe. Currently, the MA lines combined with the liquidity zone are the resistance zones of gold prices. However, gold prices can recover strongly when approaching the support area of 3300, the fluctuation range of gold prices today will be 3300 - 3350.
Important price zones today: 3335 - 3340, 3350 - 3355 and 3300 - 3305.
Today's trading trend: SELL.
Recommended orders:
Plan 1: SELL XAUUSD zone 3338 - 3340
SL 3343
TP 3335 - 3325 - 3315 - 3300.
Plan 2: SELL XAUUSD zone 3350 - 3352
SL 3355
TP 3347 - 3337 - 3327 - 3300.
Plan 3: BUY XAUUSD zone 3300 - 3302
SL 3297
TP 3305 - 3315 - 3335 - 3350.
Wish you a safe, successful and profitable trading day.🥰🥰🥰🥰🥰

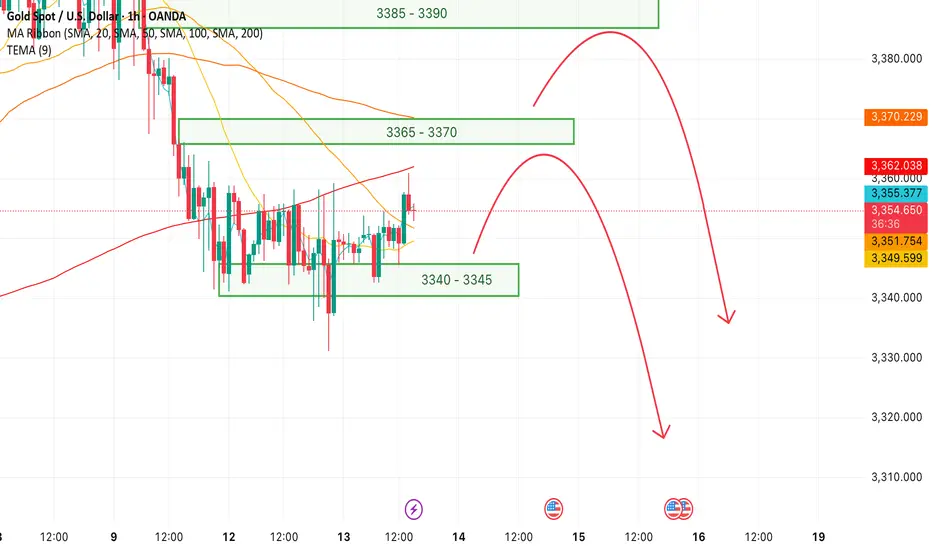
Gold Trading Strategy XAUUSD August 13, 2025Gold Trading Strategy XAUUSD August 13, 2025:
Gold prices recovered slightly, currently trading around $3,351/oz, positive US inflation data for July has reinforced market expectations that the US Federal Reserve (FED) will cut interest rates in September, while a weaker US dollar has boosted gold's appeal.
Fundamental news: Data from the US Bureau of Labor Statistics showed that the Consumer Price Index (CPI) increased 2.7% year-on-year in July, lower than the expected 2.8% and unchanged from June. Core CPI increased 3.1% year-on-year and 0.3% month-on-month, the largest increase in six months.
Technical analysis: The sideways range of 3,340 - 3,360 has not been broken yet. The MAs are showing signs of moving sideways, showing the tug-of-war between buyers and sellers. RSI H1 has started to move towards the buy zone, RSI H4 is heading towards the average line. There is a high possibility that gold price will have a correction according to RSI of H4 and increase strongly again.
Important price zones today: 3340 - 3345, 3365 - 3370 and 3385 - 3390.
Today's trading trend: SELL.
Recommended orders:
Plan 1: SELL XAUUSD zone 3367 - 3369
SL 3372
TP 3364 - 3355 - 3345.
Plan 2: SELL XAUUSD zone 3387 - 3389
SL 3392
TP 3384 - 3374 - 3364 - 3345.
Plan 3: BUY XAUUSD zone 3340 - 3342
SL 3337
TP 3345 - 3355 - 3365 - 3385 - OPEN.
Wish you a safe, successful and profitable trading day.💗💗💗💗💗
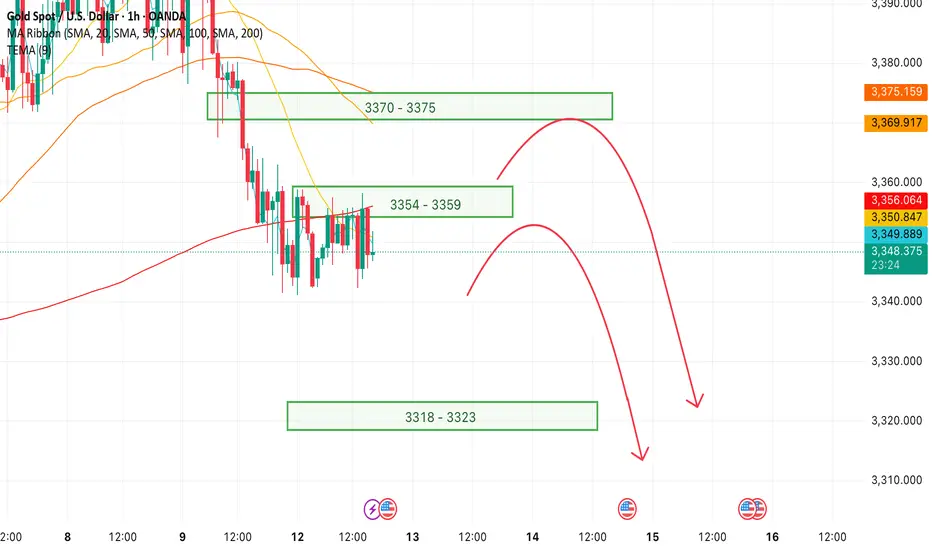
XAUUSD Gold Trading Strategy August 12, 2025XAUUSD Gold Trading Strategy August 12, 2025:
Gold prices were under pressure on Monday (August 11) and recovered in the morning trading session today (August 12). US President Trump clearly stated that he would not impose import tariffs on gold, dispelling previous market concerns about disruptions to the global gold supply chain.
Fundamental news: Investors are paying attention to the Federal Reserve's interest rate outlook. Gold is entering a correction phase after tariff concerns are resolved, and price movements may be more influenced by Dollar and inflation data.
Technical analysis: Gold prices continue to correct downwards following the trend from last week, with MA lines still acting as resistance. Currently, the RSI H1 frame is approaching the oversold zone, and there is a high possibility that gold will recover this weekend. Resistance and high liquidity areas such as 3354 - 3359 and 3370 - 3375 will be very good trading areas.
Important price zones today: 3354 - 3359, 3370 - 3375 and 3318 - 3323.
Today's trading trend: SELL.
Recommended orders:
Plan 1: SELL XAUUSD zone 3357 - 3359
SL 3362
TP 3354 - 3344 - 3334 - 3324.
Plan 2: SELL XAUUSD zone 3373 - 3375
SL 3378
TP 3370 - 3360 - 3340 - 3320.
Plan 3: BUY XAUUSD zone 3318 - 3320
SL 3315
TP 3323 - 3333 - 3343 - 3363 (small vol).
Wish you a safe, successful and profitable trading day.🌟🌟🌟🌟🌟
XAUUSD Gold Trading Strategy August 8, 2025XAUUSD Gold Trading Strategy August 8, 2025:
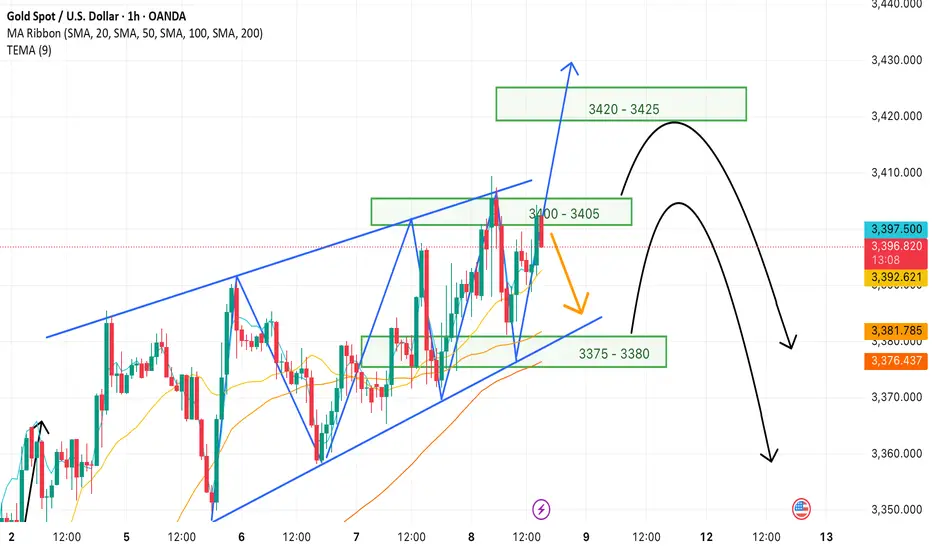
Gold prices have approached the 340x area and have fallen sharply to the 338x support area at the beginning of today's trading session.
Basic news: President Trump announced to double tariffs on Indian goods to 50% in response to continued oil imports from Russia. Reports show that Trump may meet with Russian President Vladimir Putin as early as next week.
Technical analysis: Gold prices are currently in an uptrend channel, but the trading range is showing signs of narrowing. The possibility that the price will correct at this 340x area is very high; if the gold price creates a double peak pattern in the H1 frame, the price range of 3375 - 3380 will confirm the pattern and create a strong downward force for the gold price. If gold forms a double top pattern here, this correction could take gold to the 3350 or even 3330 area.
Important price zones today: 3375 - 3380, 3405 - 3410 and 3420 - 3425.
Today's trading trend: SELL.
Recommended orders:
Plan 1: SELL XAUUSD zone 3407 - 3409
SL 3412
TP 3404 - 3394 - 3374 - 3354.
Plan 2: SELL XAUUSD zone 3423 - 3425
SL 3428
TP 3420 - 3410 - 3390 - 3370.
Plan 3: BUY XAUUSD zone 3375 - 3377
SL 3372
TP 3380 - 3390 - 3400.
Wish you a safe, successful and profitable trading weekend.🌟🌟🌟🌟🌟
Gold Trading Strategy XAUUSD August 6, 2025Gold Trading Strategy XAUUSD August 6, 2025:
Spot gold edged lower in Asian trading yesterday (August 5), currently trading around $3,380/ounce. On Tuesday, the US ISM Services PMI came in at 50.1, below the forecast of 1.4 and below the previous month's reading of 0.7; the news sent gold prices soaring in the US session.
Fundamentals: Gold prices surged after weak jobs data increased the likelihood of a rate cut by the Federal Reserve. Data released last Friday showed that the number of new jobs in the US non-farm sector was much lower than expected, indicating a sharp deterioration in the labor market. The probability of the Fed cutting interest rates in September increased to 87%, up from 63% last week.
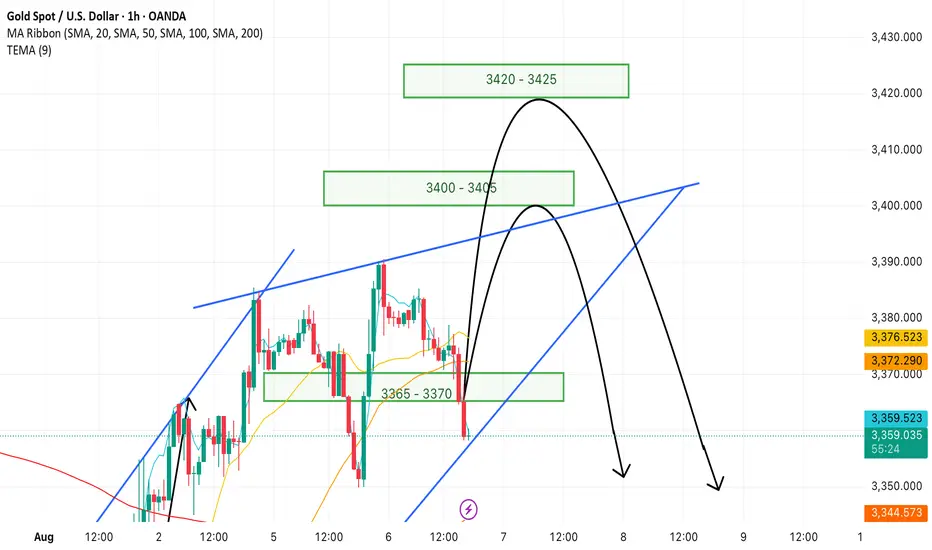
Technical analysis: Gold price is still in the uptrend channel in the H1 frame, the 3365 - 3370 area is supporting the gold price to continue following the price channel. If the gold price continues to fluctuate according to the price channel, the next prospective area could be 3400 - 3405 or even 3420 - 3425. However, the RSI and MA lines have shown signs that the buyers are weakening, so the gold price is very likely to have a strong correction from today until the end of the week.
Important price zones today: 3365 - 3370, 3400 - 3405 and 3420 - 3425.
Today's trading trend: SELL.
Recommended order:
Plan 1: SELL XAUUSD zone 3403 - 3405
SL 3408
TP 3400 - 3390 - 3380 - 3350 - OPEN.
Plan 2: SELL XAUUSD zone 3423 - 3425
SL 3428
TP 3420 - 3420 - 3400 - 3380 - OPEN.
Plan 3: BUY XAUUSD zone 3365 - 3367
SL 3362
TP 3370 - 3380 - 3390 - 3400.
Wish you a safe, successful and profitable trading day.🥰🥰🥰🥰🥰
XAUUSD Gold Trading Strategy August 5, 2025
Yesterday's trading session, gold prices continued to increase sharply due to previous influences. However, the possibility of a short-term correction in gold prices at the end of the week will be very high.
Basic news: According to CME FEDWatch, the probability of the Fed cutting interest rates at its September meeting has now increased to about 84%, reflecting increasing concerns about economic weakness. The market is currently pricing in at least two 25 basis point cuts between now and the end of the year, showing a clear shift in investor sentiment after disappointing employment data.
Technical analysis: Gold's bullish momentum is currently showing signs of weakening. The peak area of 3383 - 3385 may create a double peak pattern on H1, but the possibility of gold prices correcting today is very low. Currently, gold prices are filling liquidity at support areas. The correction of gold prices may take place at the end of the week when buyers take profits.
Important price zones today: 3350 - 3355 and 3330 - 3335.
Today's trading trend: BUY.
Recommended orders:
Plan 1: BUY XAUUSD zone 3350 - 3352
SL 3347
TP 3355 - 3365 - 3375 - 3400.
Plan 2: BUY XAUUSD zone 3330 - 3332
SL 3327
TP 3335 - 3345 - 3365 - 3400.
Plan 3: SELL XAUUSD zone 3420 - 3422
SL 3425
TP 3417 - 3407 - 3387 - 3357 - OPEN (small volume).
Wish you a safe, successful and profitable trading day.🌟🌟🌟🌟🌟
Gold Trading Strategy XAUUSD August 4, 2025
Gold prices rose more than 2% last Friday, hitting a one-week high, as weaker-than-expected US non-farm payrolls data boosted hopes for a Federal Reserve rate cut and the announcement of new tariffs fueled safe-haven demand for gold.
Fundamental news: The non-farm payrolls report showed only 73,000 jobs added in July, well below market expectations of 110,000. The unemployment rate rose to 4.2%, indicating a cooling labor market.
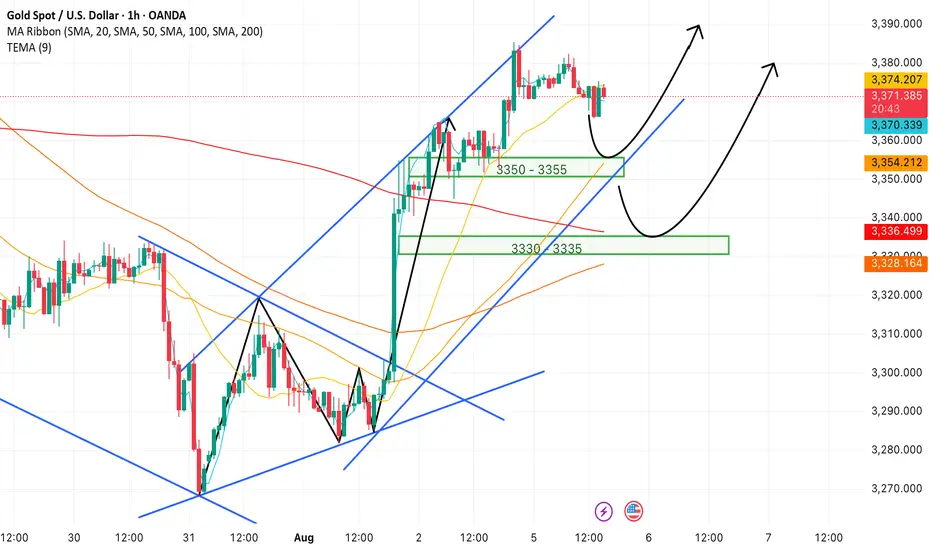
Technical Analysis: Gold prices are rising strongly after a strong candle in the 3285 - 3300 area as previously predicted. The bullish pattern on the H1 frame has shown that the buyers are returning very strongly. Currently, the price is showing signs of sideway at the 336x area, our strategy today will be to wait for trading at the support zones of the gold price. Important price zones today: 3315 - 3320 and 3330 - 3335.
Today's trading trend: BUY.
Recommended orders:
Plan 1: BUY XAUUSD zone 3330 - 3332
SL 3327
TP 3335 - 3345 - 3355 - 3370.
Plan 2: BUY XAUUSD zone 3318 - 3320
SL 3315
TP 3323 - 3333 - 3343 - 3363.
Plan 3: SELL XAUUSD zone 3370 - 3372
SL 3375
TP 3367 - 3357 - 3347 - 3337 (small volume).
Wishing you a safe, smooth and profitable trading week.💗💗💗💗💗
XAUUSD Gold Trading Strategy August 1, 2025
Yesterday's trading session, gold prices recovered to the 3315 area and then continued to decrease to the 3281 area. Currently, gold prices are fluctuating quite unpredictably due to the impact of tariff news and investor confidence.
Basic news: The Federal Reserve FED continues to maintain the federal funds benchmark interest rate in the range of 4.25% - 4.50%, in line with policy since 2025. Chairman Powell did not give any signal about the next interest rate cut on September 16 - 17.
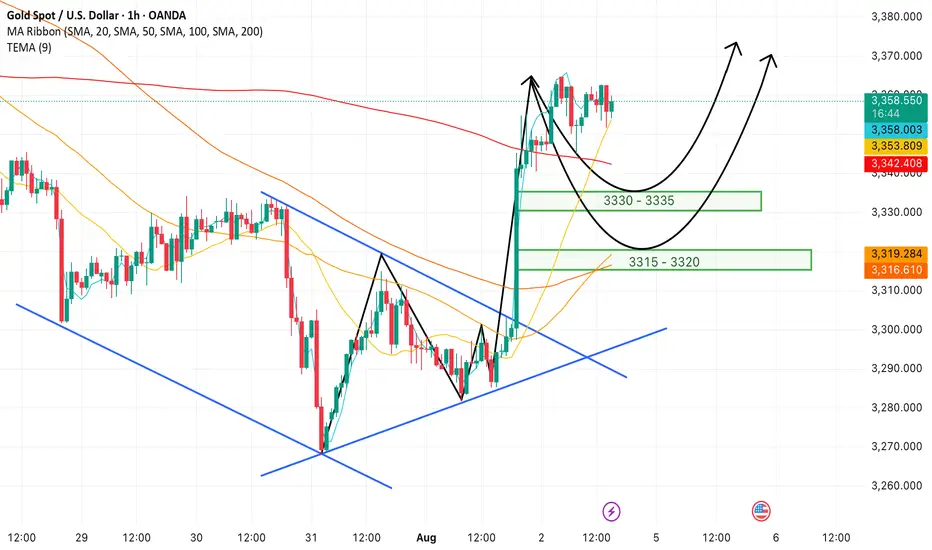
Technical analysis: After falling sharply to the 3269 area, gold prices are showing signs of recovery. In the current downtrend channel, there has been a higher bottom than the bottom at H1. We can see that if the bullish pattern at H1 is confirmed, combined with the reversal candlestick appearing at H4, the possibility of gold bouncing back to reach the resistance area of 3330, even 3350 is completely possible. In the weekend trading session, we will wait at the support zones to trade.
Important price zones today: 3280 - 3285 and 3269 - 3274.
Today's trading trend: BUY.
Recommended orders:
Plan 1: BUY XAUUSD zone 3283 - 3285
SL 3280
TP 3288 - 3300 - 3310 - 3330.
Plan 2: BUY XAUSD zone 3269 - 3271
SL 3266
TP 3274 - 3284 - 3300 - 3320.
Wish you a safe, favorable and profitable trading day.🥰🥰🥰🥰🥰

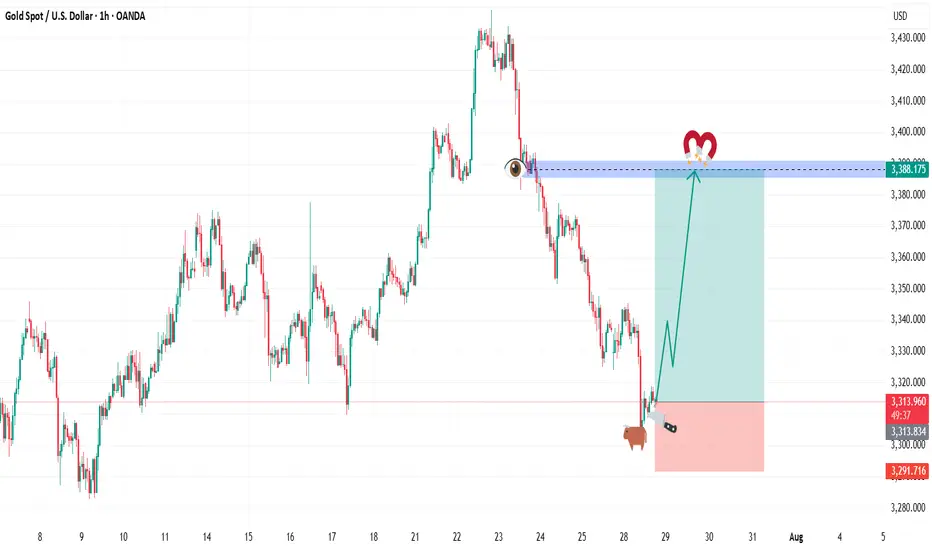
BUY GOLDIn todays session we are monitoring GOLD for buy opportunities. We have out entry at 3313.600 and stops below 3291 our target is at 3388.175 and higher. Use proper risk management. Cheers to you all.
XAUUSD 24-Hour Technical Analysis Forecast - UTC+4 Current Price: $3,350.095 (Close: Friday, July 18th, 2025) UTC+4
Analysis Period : Next 24 Hours (July 21-22, 2025) UTC+4
Market Status: Weekend - Preparing for Monday Open 02:00AM 21st July 2025
EXECUTIVE SUMMARY - 24H OUTLOOK
Primary Bias: Neutral to Bearish (Short-term)
Key Resistance: $3,375 - $3,390
Critical Support: $3,285 - $3,300
Expected Range: $3,300 - $3,380
Volatility Level: Moderate to High
CANDLESTICK PATTERN ANALYSIS
Friday's Close Formation
Pattern: Doji-like formation at resistance zone
Significance: Indecision after testing $3,350+ levels
Volume: Moderate - no strong conviction breakout
Context: Failed to close decisively above $3,375 resistance
Expected 24H Patterns
Monday Gap: Potential gap down to $3,320-3,330 area
Reversal Patterns: Watch for hammer/doji at support levels
Continuation Signals: Break below $3,300 could trigger bearish continuation
HARMONIC PATTERN ANALYSIS
Current Harmonic Setup
Primary Pattern: Potential Bearish Bat completing
X: $3,285 (previous low)
A: $3,390 (recent high)
B: $3,320 (61.8% retracement)
C: $3,375 (78.6% projection - current area)
D (Target): $3,300-3,285 (88.6% completion zone)
Fibonacci Levels (24H Focus)
Golden Ratio Resistance: $3,375 (current test area)
61.8% Support: $3,320
78.6% Support: $3,300
88.6% Critical Support: $3,285
Pattern Completion Probabilities
Bearish Bat Completion: 70% probability targeting $3,285-3,300
Bullish Cypher Setup: 30% if break above $3,390
ELLIOTT WAVE THEORY - 24H COUNT
Primary Wave Count
Macro Structure: Wave 5 of larger impulse possibly topping
Current Sub-wave: Wave (c) of corrective structure
Mini Count: 5-wave decline from $3,390 high in progress
24-Hour Wave Projection
Wave 1: $3,390 → $3,320 (Completed)
Wave 2: $3,320 → $3,360 (Completed - 50% retrace)
Wave 3: $3,360 → $3,285 (In Progress - Target Area)
Wave 4: $3,285 → $3,310 (Projected)
Wave 5: $3,310 → $3,260 (Extended target)
Critical Levels
Wave 3 = 1.618 × Wave 1: $3,285 (Primary target)
Invalidation: Above $3,390 (Wave 2 high)
WYCKOFF THEORY - 24H PHASE
Current Market Phase
Phase Assessment: Distribution Phase C (Testing Supply)
Composite Operator Action: Testing demand at $3,350 area
Volume Analysis: Declining volume on recent rallies (bearish)
Expected 24H Wyckoff Action
Phase Transition: Moving toward Phase D (Markdown begins)
Supply Test: Failed test at $3,375 confirms distribution
Target: Initial markdown to $3,285-3,300 area
Key Wyckoff Signals (24H)
No Demand: Expected at current levels
Selling Climax: Possible if break below $3,285 with high volume
Automatic Rally: Dead cat bounce to $3,320-3,330
W.D. GANN THEORY - 24H ANALYSIS
Square of Nine Analysis
Current Position: 3350° on Gann wheel
Next Cardinal Point: 3375° (90° angle - strong resistance)
Support Angles: 3300° (natural support), 3285° (critical angle)
Geometric Progression: $3,285 = perfect square root relationship
Time Theory - 24H Cycle
Natural Time Window: 24-hour cycle from Friday's high
Critical Time: 14:00-16:00 UTC Monday (historical turning point)
Lunar Influence: New moon phase approaching (bearish for commodities)
Angle Theory
45° Line: Currently at $3,320 (rising support)
63.75° Line: $3,285 (steep support angle)
26.25° Line: $3,375 (resistance angle)
Price Forecasting (Gann Methods)
Primary Target: $3,285 (Square root of 81²)
Secondary Target: $3,240 (Square root of 80²)
Resistance: $3,375 (Square root of 82.5²)
Time Forecasting
Turn Time 1: 06:00 UTC Monday (18 hours from Friday close)
Turn Time 2: 14:00 UTC Monday (26 hours from Friday close)
Major Turn: 22:00 UTC Monday (34 hours - Fibonacci time)
MULTI-TIMEFRAME INTRADAY ANALYSIS
5-Minute Chart Analysis
Trend: Bearish momentum building
Pattern: Lower highs, lower lows since Friday high
Key Levels:
Resistance: $3,360-3,365
Support: $3,330-3,335
RSI: Approaching oversold (35-40 range)
Volume: Increasing on down moves
15-Minute Chart Analysis
Structure: Bearish flag formation
Breakdown Level: Below $3,340
Target: $3,300-3,310 (flag pole projection)
Moving Averages: Price below EMA 20 ($3,358)
MACD: Bearish crossover confirmed
30-Minute Chart Analysis
Primary Trend: Corrective phase active
Chart Pattern: Descending triangle
Apex: Around $3,335-3,340
Breakout Direction: 65% probability downward
Volume Profile: Heavy selling at $3,350-3,375
1-Hour Chart Analysis
Major Structure: ABC correction in progress
Current Position: C-wave development
Fibonacci Target: $3,285 (127.2% extension)
Bollinger Bands: Price touching lower band
Stochastic: Oversold but no divergence yet
4-Hour Chart Analysis
Macro Trend: Still bullish above $3,200
Correction Depth: 23.6% retracement maximum expected
Support Zone: $3,280-3,300 (confluences)
Resistance Zone: $3,375-3,390 (proven strong)
Ichimoku: Price approaching cloud support
TECHNICAL INDICATORS MATRIX
Momentum Indicators
RSI (4H): 42 (Neutral-Bearish)
RSI (1H): 35 (Oversold approaching)
Stochastic: %K: 28, %D: 35 (Oversold)
Williams %R: -75 (Strong oversold)
Trend Indicators
MACD (4H): Bearish crossover pending
ADX: 28 (Moderate trend strength)
Parabolic SAR: $3,365 (Sell signal if broken)
Volume Indicators
OBV: Declining (distribution pattern)
Volume Rate of Change: Negative
Accumulation/Distribution: Slight distribution
KEY SUPPORT & RESISTANCE LEVELS (24H)
Immediate Resistance Levels
R1: $3,365 (Previous support turned resistance)
R2: $3,375 (Major psychological & Gann resistance)
R3: $3,390 (Recent swing high)
R4: $3,410 (Extended resistance)
Critical Support Levels
S1: $3,330 (Immediate support)
S2: $3,300 (Psychological & Fibonacci)
S3: $3,285 (Major harmonic & Gann target)
S4: $3,260 (Extended support)
24-HOUR TRADING SCENARIOS
Scenario 1: Bearish Breakdown (60% Probability)
Trigger: Break below $3,330 with volume
Target 1: $3,300-3,310
Target 2: $3,285-3,290
Extended Target: $3,260-3,270
Stop Loss (Shorts): Above $3,370
Scenario 2: Range-Bound Consolidation (25% Probability)
Range: $3,320-3,375
Strategy: Fade extremes
Buy Zone: $3,320-3,330
Sell Zone: $3,365-3,375
Breakout Confirmation: Volume spike
Scenario 3: Bullish Reversal (15% Probability)
Trigger: Break above $3,375 with volume
Target 1: $3,390-3,400
Target 2: $3,410-3,420
Invalidation: Below $3,285
RISK FACTORS & CATALYSTS (24H)
Bearish Catalysts
US Dollar strength continuation
Risk-off sentiment from geopolitical tensions
Profit-taking ahead of weekend
Technical breakdown confirmation
Bullish Catalysts
Safe-haven demand surge
US Dollar weakness
Central bank buying speculation
Technical oversold bounce
High-Impact Events (Next 24H)
Asian market opening sentiment
US Dollar Index movement
Cryptocurrency correlation effects
Weekend gap analysis
TRADING RECOMMENDATIONS (24H)
For Scalpers (5M-15M)
Strategy: Fade bounces to resistance
Entry: $3,355-3,365 area
Target: $3,335-3,340
Stop: $3,375
Risk/Reward: 1:2
For Swing Traders (1H-4H)
Primary Setup: Short on retracement
Entry Zone: $3,350-3,360
Target 1: $3,300
Target 2: $3,285
Stop Loss: $3,385
Conservative Approach
Wait for: Clear breakdown below $3,330
Entry: $3,325 (confirmation)
Target: $3,285-3,290
Stop: $3,345
CONFLUENCE FACTORS
Bearish Confluence at $3,285
Harmonic Bat pattern completion (88.6% level)
Gann Square of Nine critical angle
Elliott Wave 3 = 1.618 × Wave 1 target
Fibonacci 78.6% retracement level
Previous significant support area
Wyckoff markdown initial target
Resistance Confluence at $3,375
Gann 90-degree angle resistance
Harmonic pattern resistance
Elliott Wave corrective high
Previous breakout level
Psychological round number
FINAL 24H FORECAST SUMMARY
Expected Price Action: Controlled decline toward $3,285-3,300 support zone with potential for brief consolidation before further weakness.
Primary Targets (Downside):
First: $3,300-3,310
Second: $3,285-3,290
Extended: $3,260-3,270
Key Invalidation: Sustained break above $3,375 would shift bias bullish toward $3,390-3,410.
Risk Management: Position sizing should be conservative due to high volatility expectations and weekend gap risks.
Probability Assessment:
60% - Bearish scenario
25% - Sideways consolidation
15% - Bullish reversal
Disclaimer: This analysis is for educational purposes only. Gold trading involves substantial risk. Always use proper risk management and never risk more than you can afford to lose.
Volume profile resistance

XAUUSD 1440M forecast Based on the latest available information for July 15, 2025, the overall sentiment for XAUUSD (Gold) in the next 24 hours leans towards a bullish outlook, though with potential for short-term fluctuations and pullbacks.
Key Drivers for Bullish Outlook:
Escalating Trade Tensions: US President Donald Trump's ongoing tariff and trade policies are a significant factor. New tariffs and threats against various countries (EU, Mexico, Japan, South Korea, Brazil, Canada) are creating global economic uncertainty, which typically boosts gold's appeal as a safe-haven asset.
Geopolitical Uncertainty: Broader geopolitical risks, including those related to Russia and Ukraine, also contribute to safe-haven demand for gold.
Inflation Concerns: Tariffs are linked to inflation concerns. Gold performs strongly in a high-inflation environment, and market expectations are shifting towards a more gradual easing of interest rates by the Fed, allowing for inflation to be a potential driver.
Central Bank Demand: Central banks globally, particularly the US and China, continue to be strong buyers of gold, indicating a sustained structural trend of higher gold purchases.
Technical Support: Several analyses point to gold finding support at key levels (e.g., around $3340-3345, 200 EMA), suggesting potential for bounces and continuation of an upward trend.
"Buy on Dip" Strategy: Many analysts are recommending a "buy on dip" strategy, indicating an underlying bullish bias and viewing any short-term declines as buying opportunities.
Factors to Watch (Potential for Pullbacks/Volatility):
Short-Term Weakness/Consolidation: Some technical indicators suggest short-term weakness or consolidation, with gold testing resistance levels (e.g., $3375-3380, $3400).
US Dollar Strength: While trade tensions can weaken the dollar, there are mixed signals. A stronger US dollar can put downward pressure on gold prices as it makes gold more expensive for holders of other currencies.
Inflation Data and Fed Signals: Investors are closely watching US inflation data (CPI) and signals from Federal Reserve officials regarding interest rate cuts. While some expect cuts later in the year, any hawkish surprises could temper gold's rise.
Trade Deal Hopes: Any signs of de-escalation in trade tensions or progress towards agreements could temporarily reduce safe-haven demand for gold.
Specific Price Levels Mentioned:
Resistance: $3375-3380, $3400, $3432, $3450-3470, $3500 (all-time high).
Support: $3340-3345, $3325-3330, $3289-3303, $3240-3246.
In summary, the prevailing sentiment for XAUUSD over the next 24 hours appears to be bullish, driven by ongoing global trade tensions and safe-haven demand. However, be prepared for potential short-term pullbacks or consolidation as the market digests new information and tests key resistance levels.
For those interested in further developing their trading skills based on these types of analyses, consider exploring the mentoring program offered by Shunya Trade.
I welcome your feedback on this analysis, as it will inform and enhance my future work.
Regards,
Shunya Trade
⚠️ Disclaimer: This post is educational content and does not constitute investment advice, financial advice, or trading recommendations. The views expressed here are based on technical analysis and are shared solely for informational purposes. The stock market is subject to risks, including capital loss, and readers should exercise due diligence before investing. We do not take responsibility for decisions made based on this content. Consult a certified financial advisor for personalized guidance.
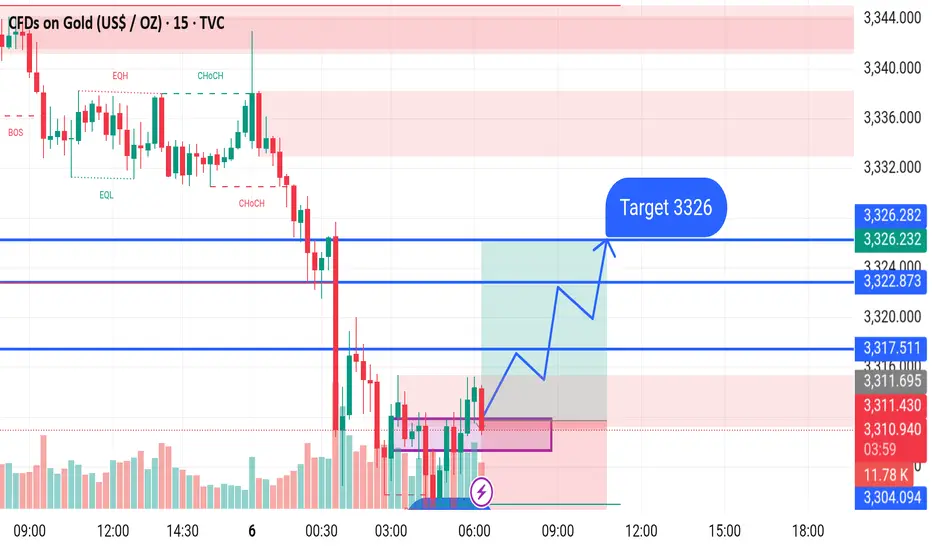
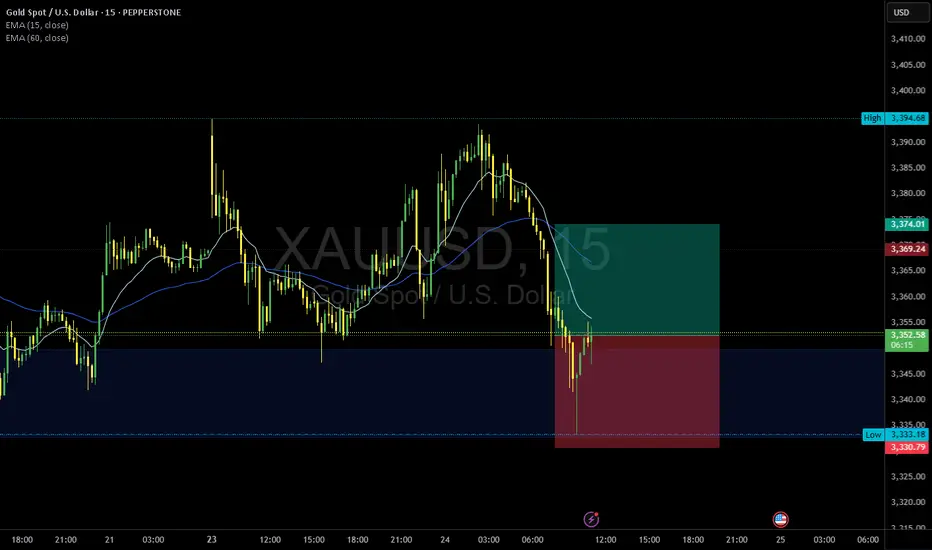
GOLD BUY M15 Gold (XAU/USD) 15-Minute Chart Analysis – July 7, 2025
Trade Setup: The chart shows a bullish trade setup based on a potential reversal from a "Weak Low" support area around 3304. After forming a BOS (Break of Structure) and a small consolidation (highlighted box), price is expected to move higher.
Entry:
Long position initiated slightly above the consolidation zone.
Stop Loss (SL):
Set at 3304, just below the recent weak low support.
Target (TP):
Final target at 3326, where a key resistance level lies.
Key Levels:
Support Zone: 3304 (Weak Low)
Resistance Levels:
3317.5
3222.9
3326.2 (Final Target)
Market Structure Notes:
CHoCH (Change of Character) indicates potential shift to bullish momentum.
Price is expected to form higher highs and higher lows on its way to the target.
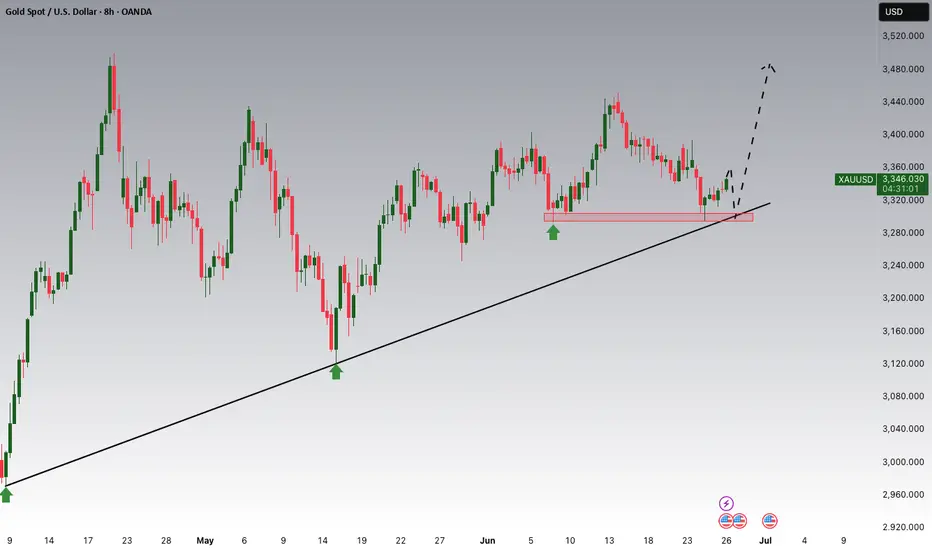
Gold Potential UpsidesHey Traders, in today's trading session we are monitoring XAUUSD for a buying opportunity around 3,300 zone, Gold is trading in an uptrend and currently is in a correction phase in which it is approaching the trend at 3,300 support and resistance area.
Trade safe, Joe.
GOLD OPENS BULLISHJust as analysed, there was a strong bullish setup at the close of last week so this move was just taking out top liquidity, continuing its course of bullish rally. We can also spot a bullish trend build up from the 3400's which projected to the 3450's before making its retracement last week.
we expect Gold to go for more higher liquidity as we are close to the ATH, in other words; ROAD TO 3500'S as a visible path has been analysed
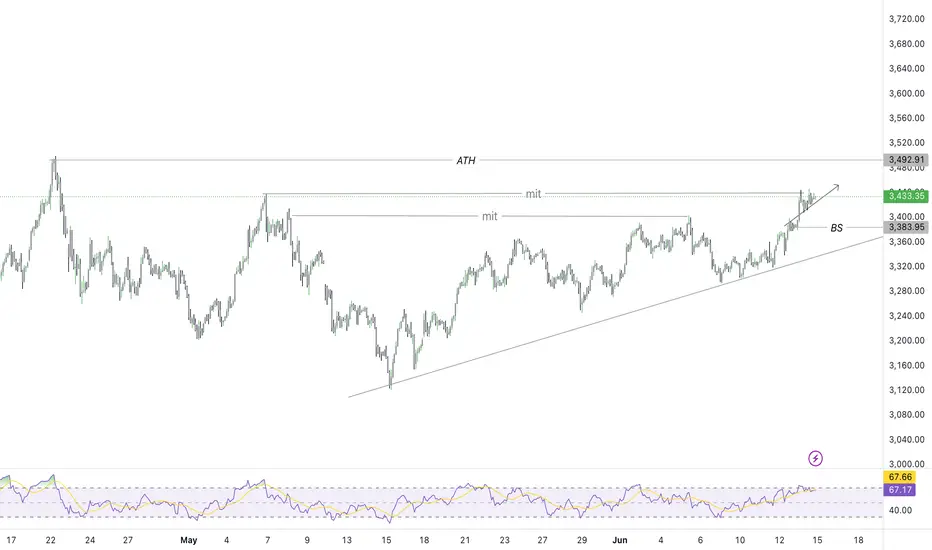
GOLD PATH TO 3500We see a visible path to 3500 on the xauusd market.
After the breakout at 3400 which extended to 3440's clearing a solid supply zone, gold then had a retracement and rallied back to 3420's which has a solid outlook on the 4hour time frame.
Do not forget that today is friday so dont push the moves .
.......Further breakdown on the lower timeframe

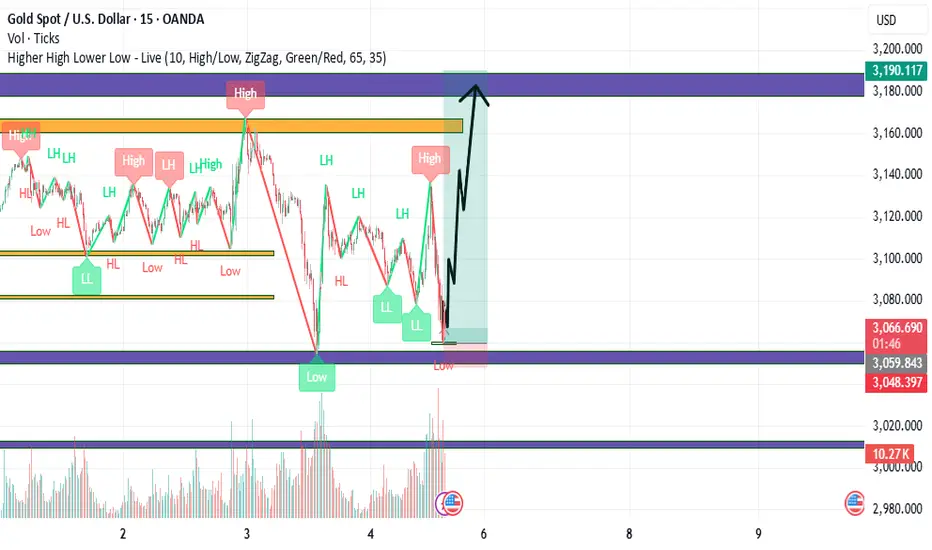
gold after the inertviez of jerome todayAs of April 4, 2025, gold prices have experienced significant volatility amid escalating trade tensions and market uncertainties. Following President Trump's announcement of new tariffs and China's subsequent retaliation with 34% tariffs on U.S. goods, investors have increasingly turned to gold as a safe-haven asset. This surge in demand propelled gold prices to record highs, surpassing $3,130 per troy ounce
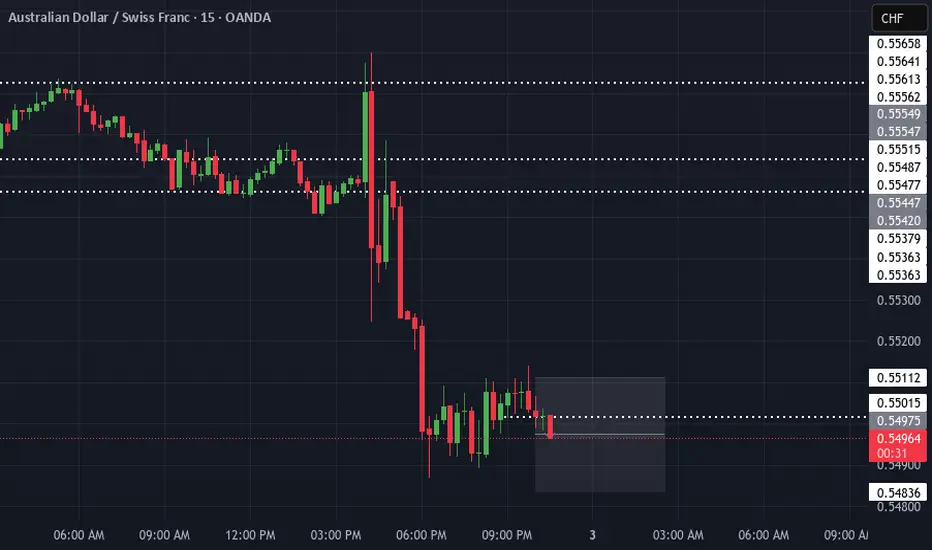
Audchf SellPrice has been in a obvious downtrend. once price closes below 55015 on the 15min tf im looking for a nice scalp opportunity.