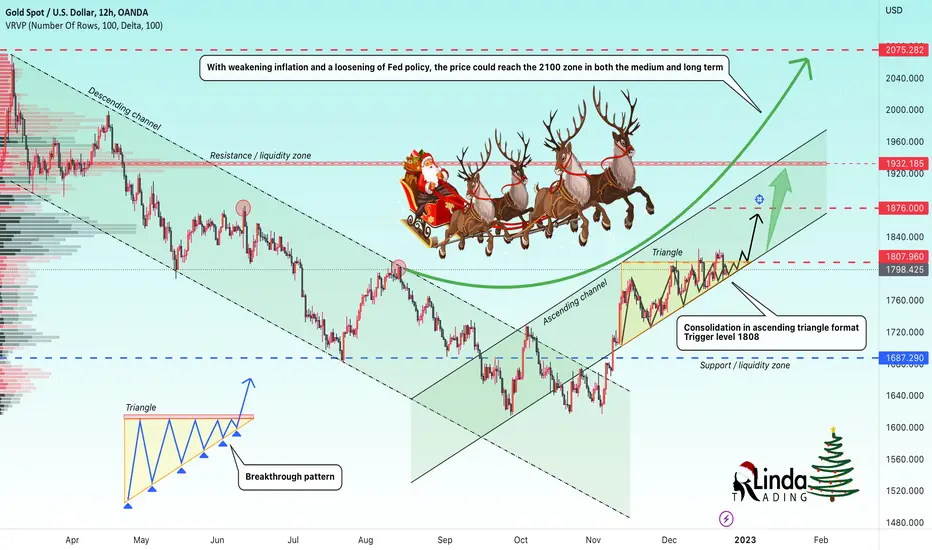
RLinda ! GOLD-> Bulls Celebrate CHRISTMAS and Pressure SellersGold shows quite positive dynamics at the end of the calendar year 2022. Since November, the price showed a very intensive stage of recovery and made a rally of 12.6%.
On the chart, the trend change is clearly visible. It is worth paying attention to the ascending triangle. The price is in a consolidation phase. This pattern is interpreted as: the pressure of dynamic buyers on the limit resistance zone, which the sellers are trying to hold. Numerous breakout attempts, which turn out to be a false-break, only accelerate the energy buildup for the breakout.
In the medium term I expect a continuation of the onslaught on the given 1807-1810 zone, and if the situation does not change, the zone will be broken through. Our targets in the medium term will be the resistance zone 1845-1855. In the long-term prospect - 1920-1935.
Merry Christmas!
Regards R.Linda!
Gold-futures
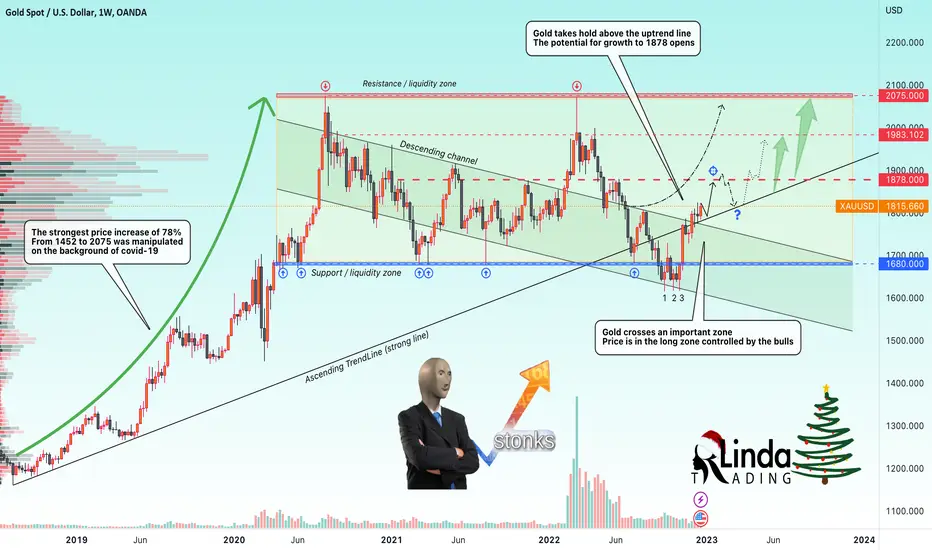
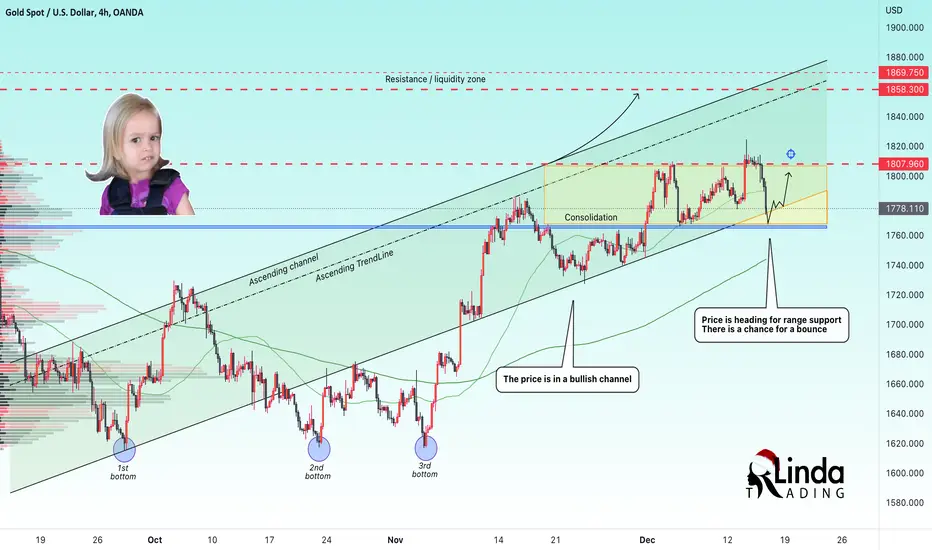
RLinda ! GOLD-> Gold opens for growth to 1878Gold has risen about $200 since falling to a more than two-year low in late September as expectations of a slower Fed rate hike eased the dollar's allure.
In my last global review, I said we should expect a pullback after the breakout. The price forms a technical pullback to the $1775 zone and the bulls finally consolidate their position. As we can see, gold continues its rise, the price is currently at $1815.
After the price fixes above the trend line, which started its formation in mid-2019, the price opens for itself the potential to $1878 and it is worth assuming that by the end of the year the price can shoot up to this mark
Gold is holding range as trading is rather sluggish and investors are in a wait-and-see mode. PCE data will be important. If inflation continues to decline, the dollar will weaken further and gold will take on a more resilient tone.
Third-quarter U.S. gross domestic product data and weekly jobless claims data will be released at 13:30 GMT.
Traders will also analyze Personal Consumption Expenditures (PCE) data due out Friday, looking for information on inflation.
The U.S. Federal Reserve gradually lowered the pace of rate hikes to 50 basis points in December after four consecutive 75-basis-point rate hikes. However, Fed Chairman Jerome Powell has signaled that the U.S. central bank will raise rates next year.
At this point, gold looks good, and some caution should be exercised with it. All it takes is one or two negative factors for gold to plummet down again
If the blockages start again and we see a paralysis in the Chinese economy, demand will fall and that will be a bearish factor for all commodities, including gold.
The medium and long term outlook:
1) Gold is currently open to a move to $1878
2) The level of $1878 is difficult to break through and we should expect a pullback or consolidation at this level.
3) $1878 will be the key level to determine the further move.
4) If the bulls seize this area and hold the price above the level, the price will open a potential for the level of $1983
Regards R. Linda!
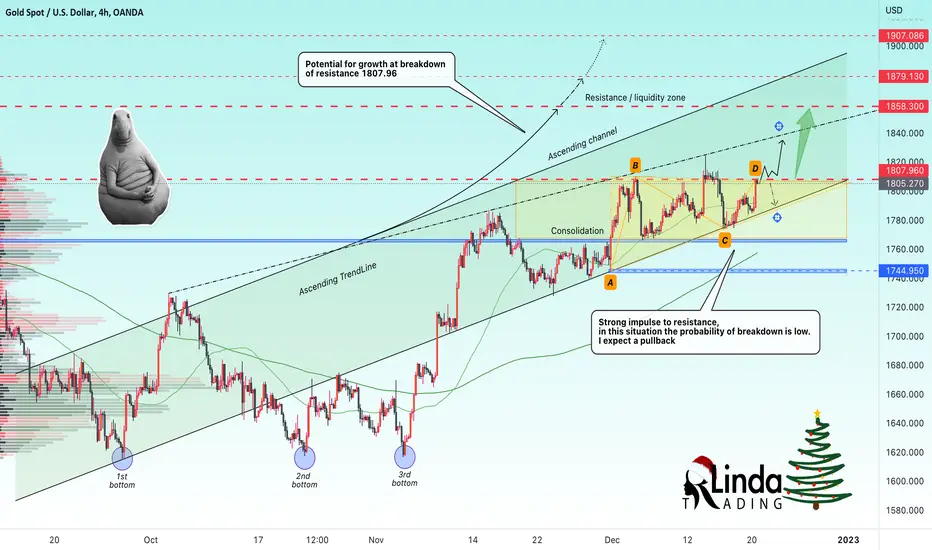
RLinda ! GOLD-> Triangle pattern and consolidation. Breakout?Gold continues to consolidate energy within the range boundaries between resistance 1807 and support of the price channel. In this case, an upward triangle is formed. Pressure is emerging on resistance 1807
The "Rising Triangle" pattern implies an active gathering of energy by buyers to break the resistance ahead, which in this case is the level of 1807.96. A breakthrough of this boundary will open the potential for the price to grow to the rising resistance (dotted line) and up to the level of 1907
I assume that today the price may form a pullback to the support of the price channel and continue to consolidate in this range. In the medium term I expect a break through 1807.96 and growth to 1840
Regards R. Linda!
RLinda ! GOLD-> Consolidation on the support line. What's next? Gold is in consolidation. After a rather active growth, it is testing the support of the price channel. The price is in the risk zone, what should we expect next?
A consolidation without a bounce after a big drop might mean that the price can continue falling, in which case it can quickly reach the support of 1765, but the gold is still trading above the channel support.
I assume that at the moment the buyers are trying to hold the support area of the channel and try not to let the price go down, as that would provoke selling.
There are two possible scenarios.
1) If the bulls manage to keep the support of the channel, the price may reach resistance 1807 in the nearest future
2) If the support is broken through, we should expect the retest and the price consolidation under the level, and the price will go to 1765, and then to 1744.
Regards, R. Linda!
RLinda ! GOLD-> Price is testing support. What's next? Gold is falling toward channel support after the release of the Federal Reserve data. The price is momentarily falling by 2%.
The strong distributive movement is towards range support and the support zone of the price channel. I think there is a high probability of a bounce from strong support with this drop. The price may make a false break of the channel support and test the level of 1765, but the global trend is still bullish
I expect a test of the support zone and consolidation above the level with the subsequent strengthening of gold towards 1807. The nearest short-term target is 1790.
Regards to R. Linda!
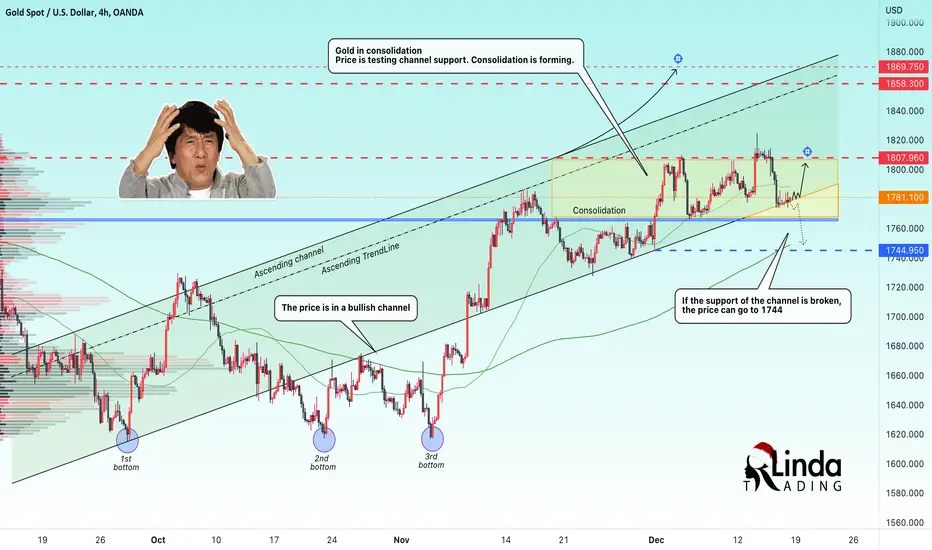
RLinda ! GOLD-> Price in consolidation Gold is entering a consolidation phase after a fairly strong and active recovery. The level of 1807 is a strong obstacle, so it needs to accumulate energy to overcome this area.
In the previous idea, I pointed out the possibility of forming a pullback from 1807, which is what we got. Price is testing 1784 and giving us a reaction. Trading inside the range is difficult, so I recommend targeting the upper or lower boundary.
I think price may stay in this 1807-1765 range for a while longer, but in the medium term I expect a breakout of resistance.
To buy, consider consolidation support at 1765, or a break of 1807 resistance.
Regards, R.Linda!

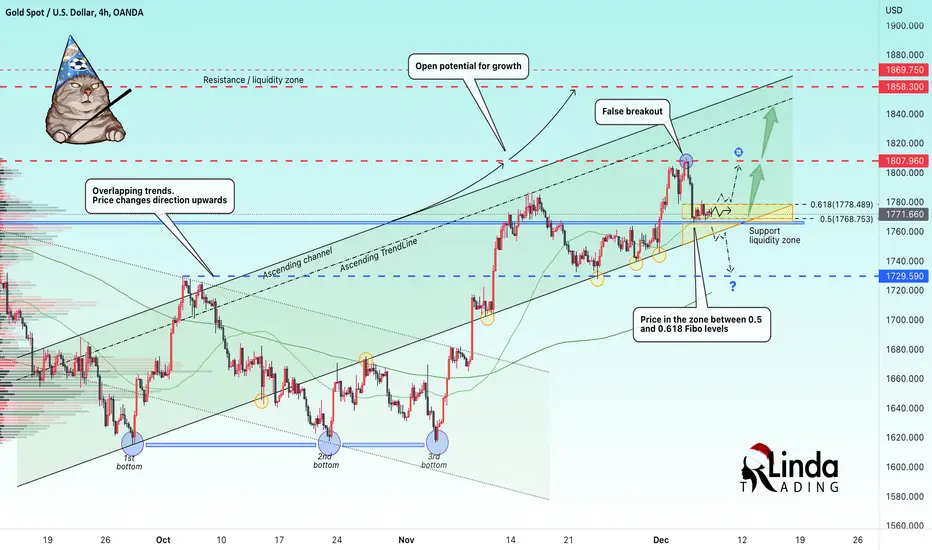
RLinda ! GOLD-> consolidation after the fall. What's next? Gold updated to a high of 1810 and then the price went into a retracement phase, which fell to the key level of 1765 and reached the 0.5 Fibonacci level, what to expect from that?
We have an upward price channel and a strong uptrend on the back of loosening tight fundamentals. The price stops its correction at the 0.5 Fibonacci level and moves into consolidation between the 1768 and 1778 level. This can be interpreted multifacetedly, as a set of energy to buy and a consolidation to continue falling. An important nuance will be a price exit from the consolidation.
A break-up of the resistance 1778 and its fixation above this level will send the price up to 1807.
However, a breakdown of 1768, 1765 and a breakdown of the price channel support will open a potential for the price fall to 1729.5.
Regards to R. Linda!
GOLD 15 MIN NICE TREND ✅✅✅Please respect the analysis. Today is a beautiful day, a golden opportunity. Just a little patience and diligence, we will be the best Happy holiday Any questions about the transaction are welcome ✅💹❤️
gold daily : fibo50 : 1840 is in mind of pro traders we have 2 important fibo in left , personaly i belive gold will reach fibo61 1900
break last candel,friday high is powerful buy signal ,so if you dont have buy ,you can put low size buystop on last high 1761
AC indicator give buy signal,if last low not break we will see +up trend in coming days
big banks net open buy increase in last 2 week
so 90% looking for buy and when gold go up ,dont pick reverse sell it can go upper without pullback and dont allow you exit from sell , never forget gold love buy and go up wild
good luck

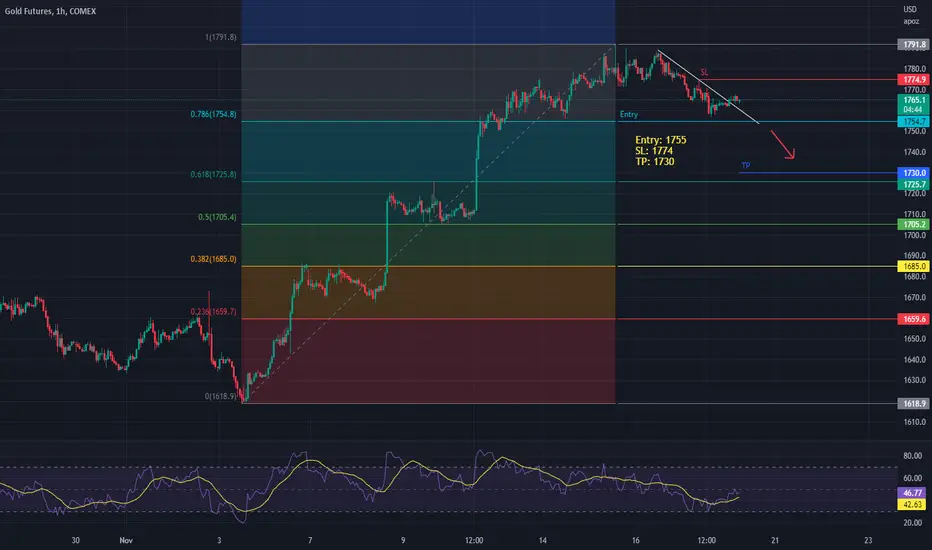
GC1! - ShortGoing Short on Gold Futures. A clear bearish trend can be seen. If the price breaks the first resistance, that will confirm the trend and will be a great entry point.
XAUUSDXAUUSD
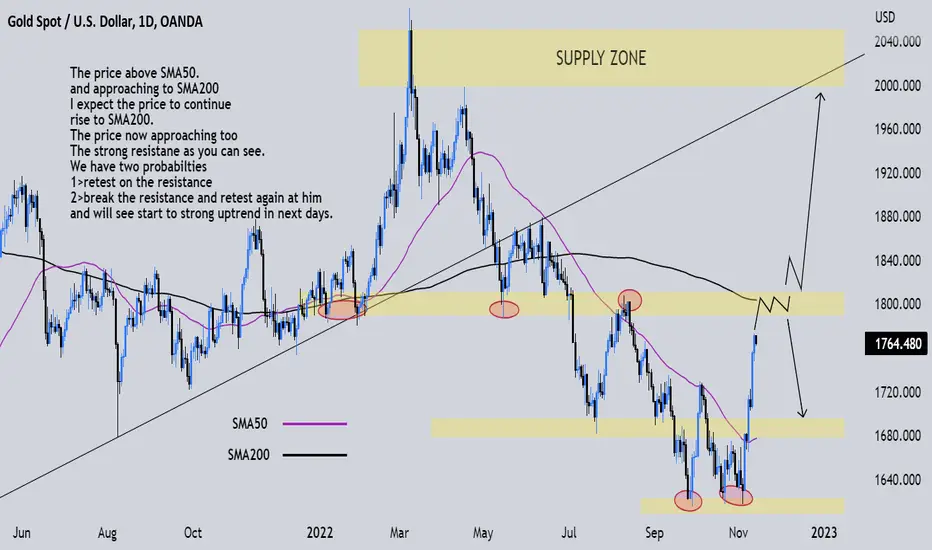
The price above SMA50.
and approaching to SMA200
I expect the price to continue rise to SMA200.
The price now approaching too on the strong resistane as you can see.
We have two probabilties
one>retest on the resistance and will see some moves down again
two>break the resistance and retest again at him and will see start to strong uptrend in next days.
For more details contact me.
don´t forget like and support.I will be gratful👨💻.
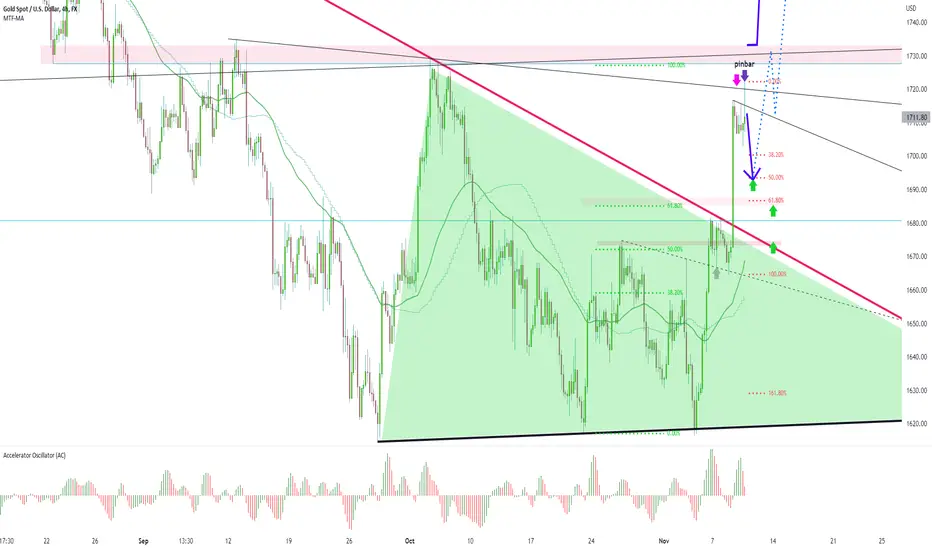
gold 4 hour : sell pinbar come now gold can go down to fibo 50%gold touch trend line and pinbar appear now we can pick sell with sl on pinbar high and wait to fibo 50% 1692
then pick buy above green arrow too
alert : AC indicator daily is full green now and can turn red
good luck
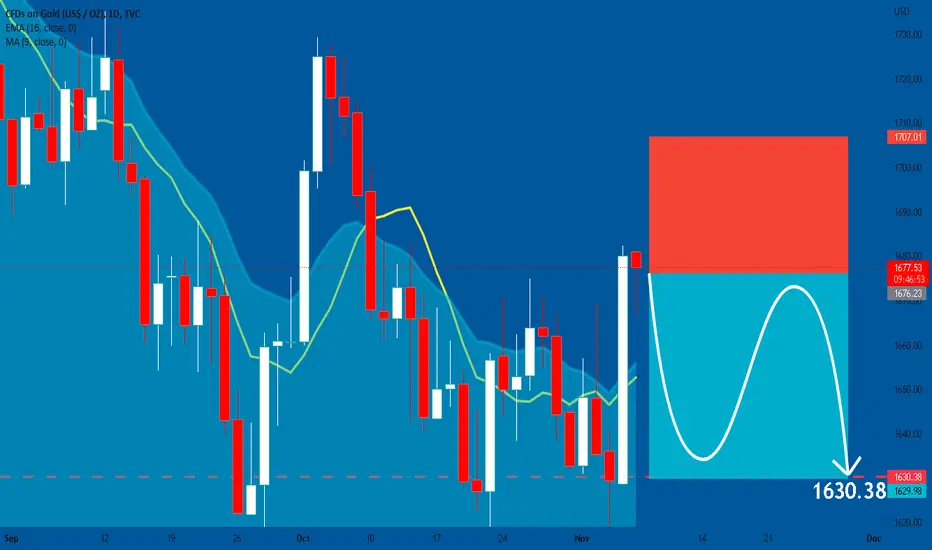
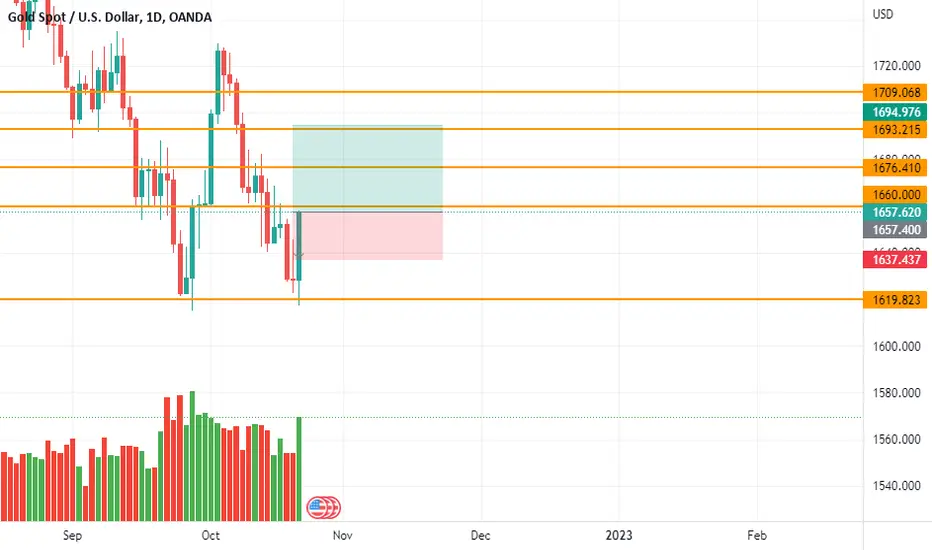
GOLD: Short Trading Opportunity
GOLD
- Classic bearish pattern
- Our team expects fall
SUGGESTED TRADE:
Swing Trade
Short GOLD
Entry - 1676.23
Stop - 1707.01
Take - 1629.98
Our Risk - 1%
❤️ Please, support our work with like & comment! ❤️
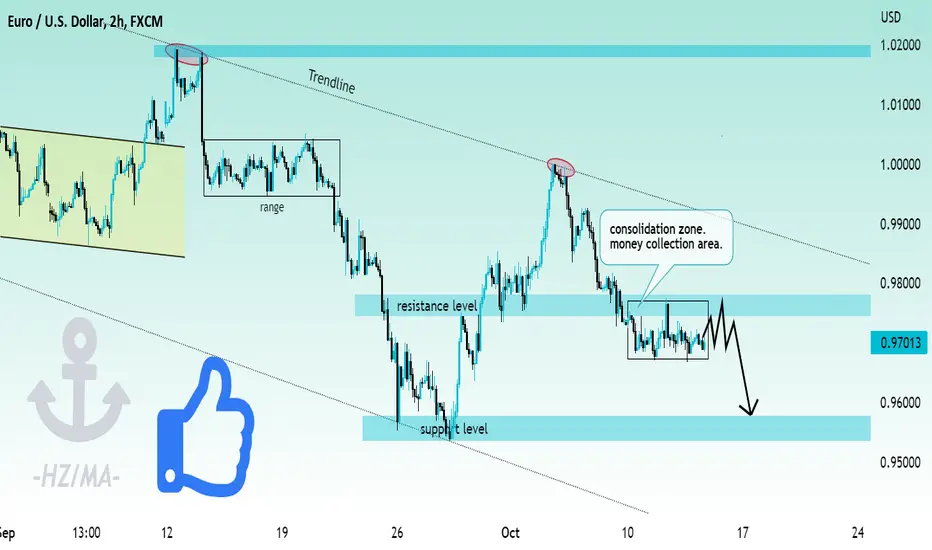
EURUSDAnalyse #EURUSD
As I told you before
The price break resistance .will see some correction under it.
I expect return to retest on resistance to falll to the support level .
don´t forget like and support.I will be gratful👨💻
Thank you🙏
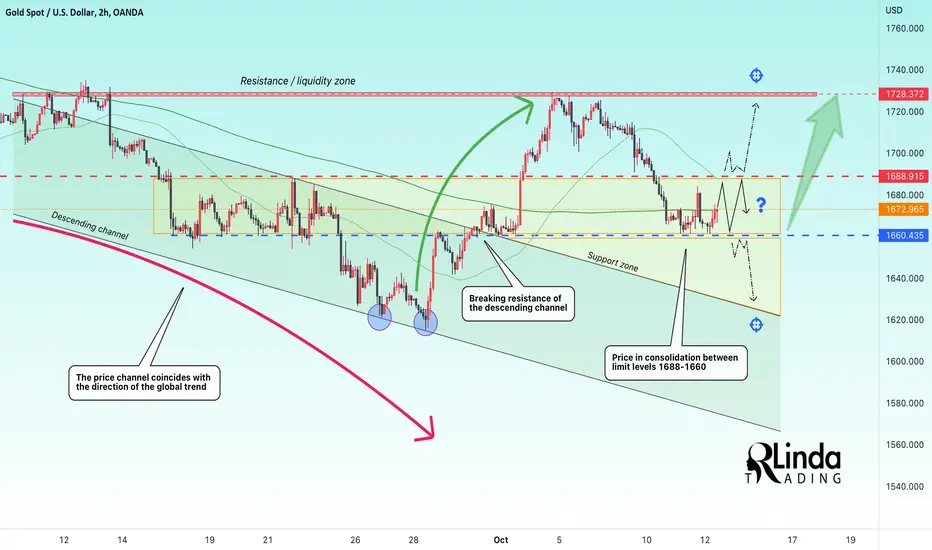
RLinda ! GOLD-> Overview of the local situationGOLD in a technical pullback format after breaking the descending channel and reaching resistance 1728.5 falls to the support of the local range 1660.
Gold trades in a range between 1688.9 and 1660.4 and I suspect that the price may move in a consolidation for some time.
What do you want to see next?
1) Long scenario: The gold is in the risk zone, because the price channel was broken earlier, but there was no confirmation of the trend change, but there might be a potential to break the resistance at 1688. In that case our target will be the liquidity zone of 1728.3
2) Short scenario: we have a strong bearish trend on the global chart, the price updates the global lows and the movement after testing resistance 1728 coincides with the direction of the pullback. The price can go down from consolidation under sellers' pressure. In that case, the support area of 1628 will be the target.
Regards R.Linda!
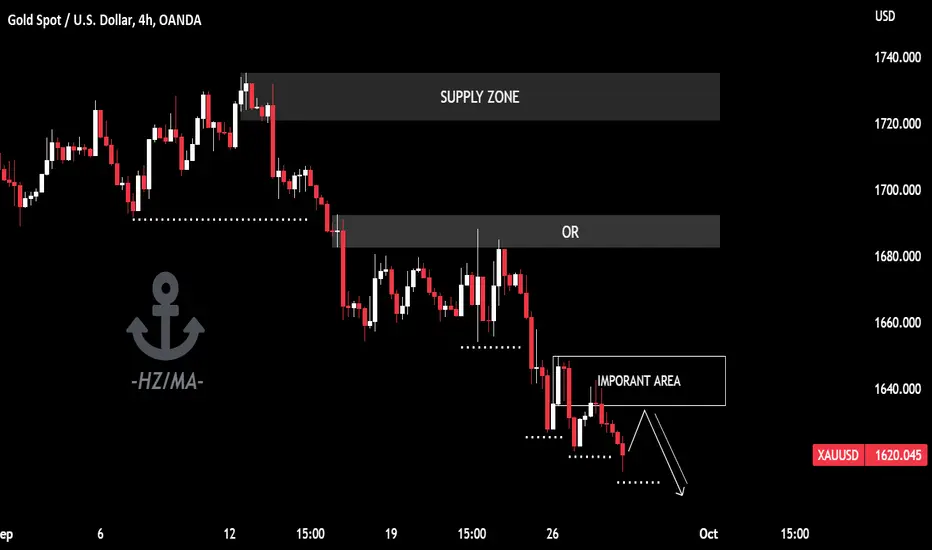
XAUUSDThe price is in important area.will see some correction from this area.
I expect the retest from it again .
Targets will be 1605-1607.
don´t forget like and support
Any questions contact me.
Best regard!!
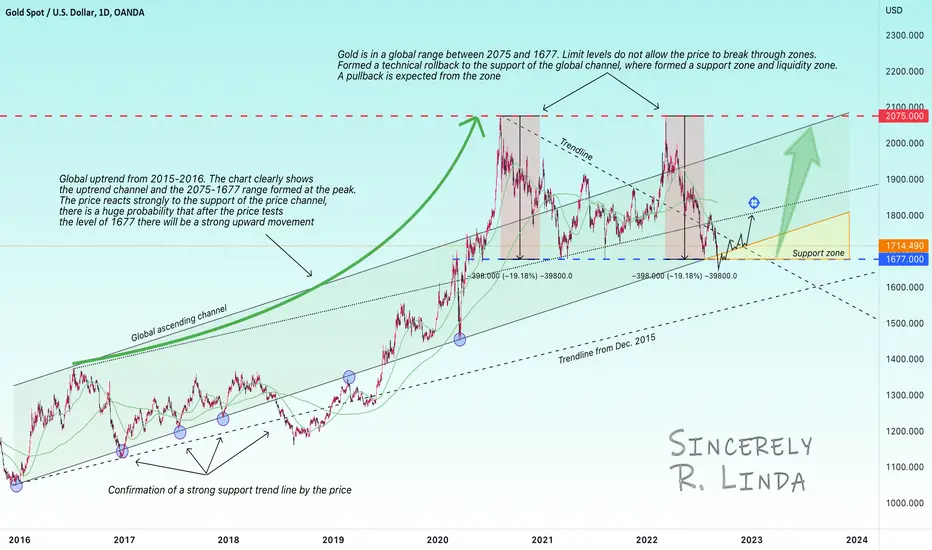
RLinda ! GOLD-> Overview of the global situation!GOLD - Overview of the global situation. On the chart I saw the global uptrend and the price movement in the channel, which began fresh formation since 2015. Pay attention to the price reaction to the support of the channel - it is very strong and forms strong movements in one direction or another.
Also, I marked the range 2075-1677, two identical impulses from resistance marked the global range, the price continues to trade in this direction. A pullback to support is forming. And this zone is quite strong, if you consider how the price previously registered on the upward support line (channel support)
The important level on the chart is 1677, which is a huge liquidity zone, and I think that in the mid-term we will see the price reach that area. And after the retest, perhaps, it will start its recovery.
Sincerely R.Linda!
Should You Buy Gold? Yes! But Not Yet! Check It OutHello there! I want to be detailed on Gold in this analysis. I just decide to post an idea about it because I discovered something in the H4 timeframe that looks different from the other timeframes like the H1, 1D, 1W, and even the 1M, which can make some traders make the wrong decision going against the next market move. But first, I want to show you something in the monthly timeframe chart, then I will post the H4 chart to see what could happen when the Gold market opens. Look at the monthly analysis well so that you can understand what is going on now and what could happen next in the Gold market currently.
Monthly Timeframe
In the monthly chart, you can see that the Gold market has rejected the strong support level by forming a small bullish pin bar at the key support area. Warning: you must be careful here if you are deciding to sell Gold. The pin bar is not a classic kind though, it can have a bullish effect on the Gold price movement in the coming week. As a result, be very careful. Why? It's because ofe the context where the pin bar candlestick has appeared matters!
Daily Timeframe
In the daily timeframe, an engulfing candle, but not so strong, has formed at the key support level area, signaling the reversal to the upside. So, the Monday candle could close with a "wick below".
H4 Timeframe
In the H4 timeframe, there is a tendency for the price to experience a short-term bearishness, to reverse to the support level, creating a "W" or "double bottom" pattern before completely taking a rally to the upside. This means we can make sell trade decisions here and exit close to the support, not exactly at the support level though. Why the bearishness? The inside bars have formed at the key resistance level, showing a loss of momentum in the bulls of
Finally, the timeframe to pay much attention to is H4 for now because a bearish pin bar has formed in it. Take note of this and the stochastic seems to be going bearish, moving away from the overbought zone

Should You Buy Gold? Yes, But Not Yet! Check It OutHello there! I want to be detailed on Gold in this analysis. I just decide to post an idea about it because I discovered something in the H4 timeframe that looks different from the other timeframes like the H1, 1D, 1W, and even the 1M, which can make some traders make the wrong decision going against the next market move. But first, I want to show you something in the monthly timeframe chart, then I will post the H4 chart to see what could happen when the Gold market opens. Look at the monthly analysis well so that you can understand what is going on now and what could happen next in the Gold market currently.
Monthly Timeframe
In the monthly chart above, you can see that the Gold market has rejected the strong support level by forming a small bullish pin bar at the key support area. Warning: you must be careful here if you are deciding to sell Gold. The pin bar is not a classic kind though, it can have a bullish effect on the Gold price movement in the coming week. As a result, be very careful. Why? It's because ofe the context where the pin bar candlestick has appeared matters!
Daily Timeframe
In the daily timeframe, an engulfing candle, but not so strong, has formed at the key support level area, signaling the reversal to the upside. So, the Monday candle could close with a "wick below".
H4 Timeframe
In the H4 timeframe, there is a tendency for the price to experience a short-term bearishness, to reverse to the support level, creating a "W" or double top pattern before completely taking a rally to the upside. This means we can make sell trade decisions here and exit close to the support, not exactly at the support level though. Why the bearishness? The inside bars have formed at the key resistance level, showing a loss of momentum in the bulls of
Finally, the timeframe to pay much attention to is H4 for now because a bearish pin bar has formed in it. Take note of this and the stochastic seems to be going bearish, moving away from the overbought zone

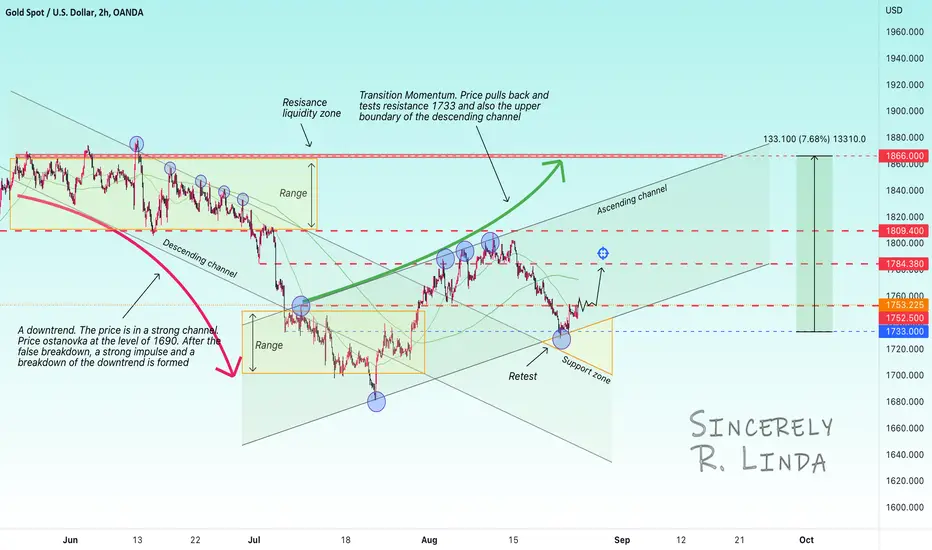
RLinda ! GOLD ! Potential bull trendGold. Earlier, as I said, in the correction format, we saw price confirmation of the support zone of the upward price channel. We have a wide price channel at the moment, which opens new boundaries for us.
On the chart we can see that the price forms a strong momentum from the support zone 1733 and after the retest breaks through the resistance 1752.5. With the possible fixation of the price above the resistance level of 1752.5, there are all chances of growth to the level of 1784.38.
I assume that this resistance breakout can be true and form a good upside potential for us. Short-term target is the resistance level of 1784.38.
Regards to R.Linda!
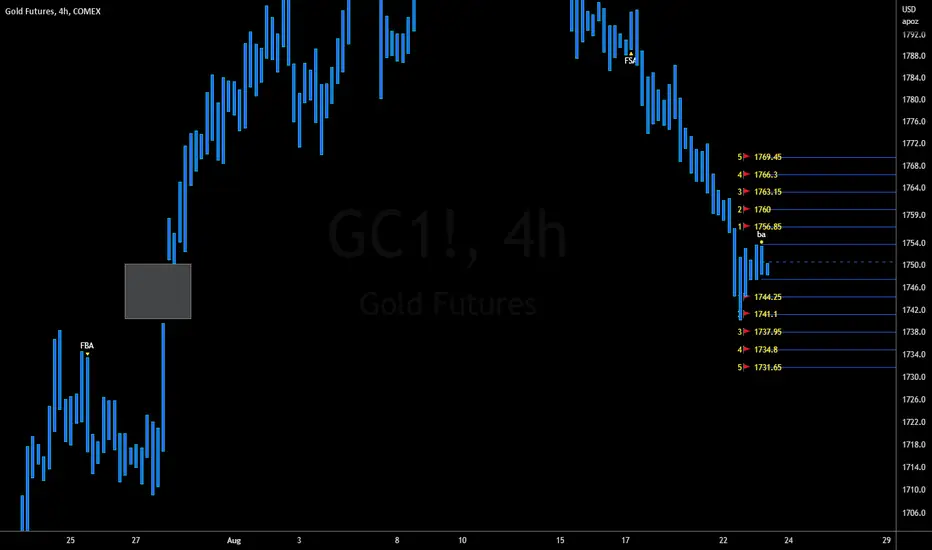
Gold Futures - potential setupsCOMEX:GC1!
Hello everyone!
🛎 Let check the trading idea for Gold Futures
🤗 Not making anything difficult everything is pretty straightforward.
👉 1. Price goes ABOVE the selected range on the picture. Long positions to activate. 🟢
👉 2. Price goes BELOW the selected range. below. Short positions to activate. 🔴
----------------------------------------------------------------------------------------------------------------------------
⚠️ Important Notes:
1. Always follow your trading plan regarding entry, risk management, and trade management. ❗️❗️❗️
2. Timeframes: up to H4
----------------------------------------------------------------------------------------------------------------------------
😉 If you like the idea there was a like 🚀 and sign up so you can continue receiving great ideas like this one and also for us to make pattern the idea! 🤝
💪 Profitable lock for everyone! 🙏
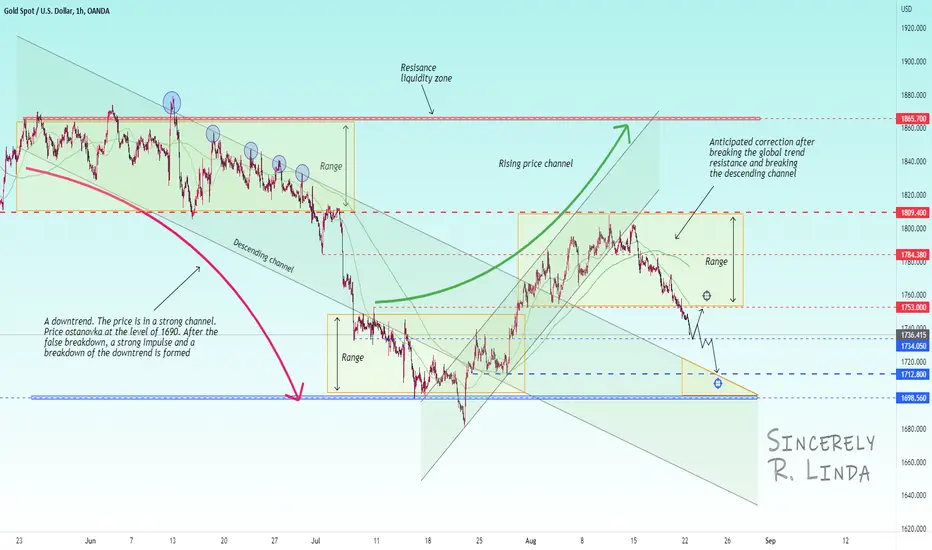
GOLD ! Lingering correction. Where could the price reverse?💤Gold continues to pull back down to the strong support zone. I assume that this maneuver can be considered as a correction after the breakdown of the global downward price channel for the time being.
On the chart you can see that the price is going down to the resistance of the descending channel and the important point will be the contact of the price with this trend line.
I assume that the price can still fall, but to the old trend line and it is worth paying attention to the price reaction to this very chart element. I think that after the test the price may form an upward impulse, but at the moment the local fall will still continue.
Regards R. Linda!