KGC, The Barometer For Easing Tensions?Based on historical movement, the peak could occur anywhere in the larger red box. The final targets are in the green boxes. The pending bottom should occur within the larger green box as has been the historical case. Half of all movement has ended in the smaller green box. In this instance, the signal indicated SELL on February 10, 2022 with a closing price of 5.45.
If this instance is successful, that means the stock should decline to at least 5.39 which is the top of the larger green box. Three-quarters of all successful signals have the stock decline 8.029% from the signal closing price. This percentage is the top of the smaller green box. Half of all successful signals have the stock decline 12.591% which is the end point of the black dotted arrow. One-quarter of all successful signals have the stock decline 21.953% from the signal closing price which is the bottom of the smaller green box. The maximum decline on record would see a move to the bottom of the larger green box. These are the same concepts for the levels in the red boxes as well.
The ends/vertical sides of the boxes are determined in a similar fashion. The trough of the decline can occur as soon as the next trading bar after signal close, while the max decline occurs within the limit of study at 35 trading bars after the signal. A 1% decline must occur over the next 35 trading bars in order to be considered a success. Three-quarters of successful movement occur after at least 10 trading bars; half occur within 20 trading bars, and one-quarter require at least 31 trading bars.
The black dotted arrow represents median historical movement. Medians are a good metric, but they are just one of many I use when forecasting future movement.
As always, the stock could decline the very next bar after the signal without looking back (therefore the red boxes would not come into play) or the stock may never decline (and the green boxes may never come into play).
Gold-sell

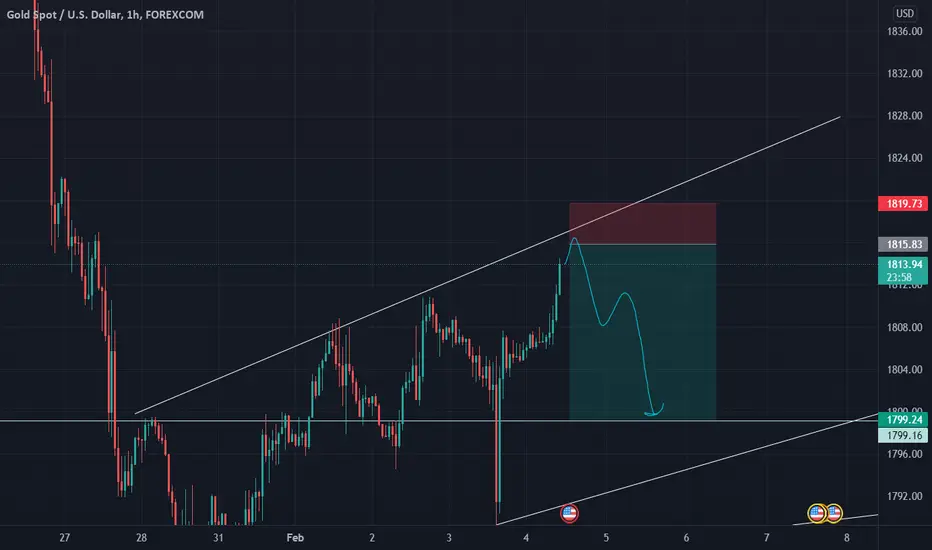
Gold Short Term Sell IdeaD1 - Price is currently holding in a key resistance zone.
Potential bearish divergence.
H1 - Bearish divergence.
Until the invalidation level holds my short term view remains bearish here.
If we get a valid breakout below 1850 level we may then consider it as a validation for this short term bearish view.

XAUUSD new lowsAfter big spike upside, gold came to the trand line on daily tf, so I expect price to retest the zone around 1830 before new big movement

XAUUSD shortXAUUSD sell limit idea, entry around 1816
After strong downside impulse, we can see very nice correction, at the top of correction we can open position for sell gold
XAUUSD - SELL NOW!XAUUSD is clearly falling after a break and retest on this zone! What do you guys think?

GOLD READY TO DROP$$Guys as we can see here on our gold chart on the weekly we hit our weekly bearish OB also have a daily confluence OB at the same level as well as a trendline rejection. We will be looking to take sells from here after PA confirmation.

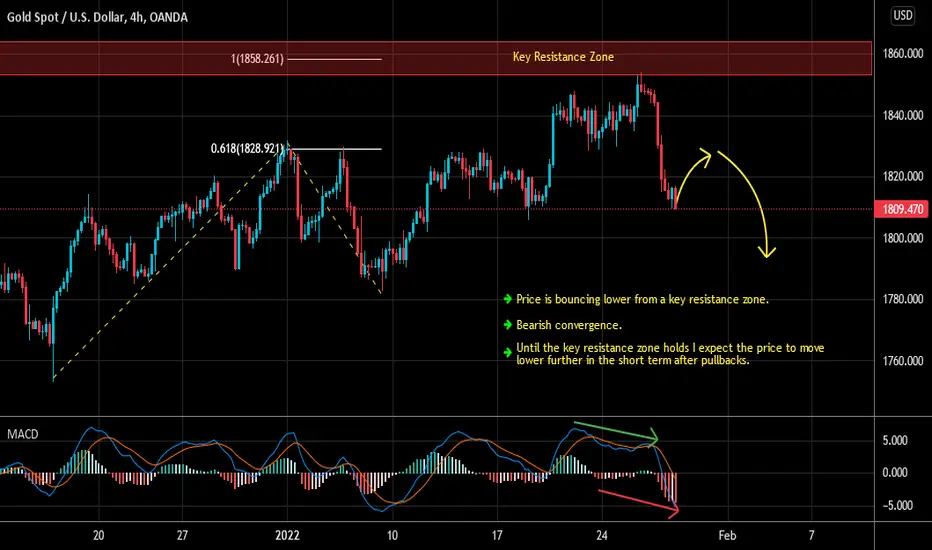
Gold Short Term Sell IdeaH4 - Price is bouncing lower from a key resistance zone.
Bearish convergence.
Until the key resistance zone holds I expect the price to move lower further in the short term after pullbacks.
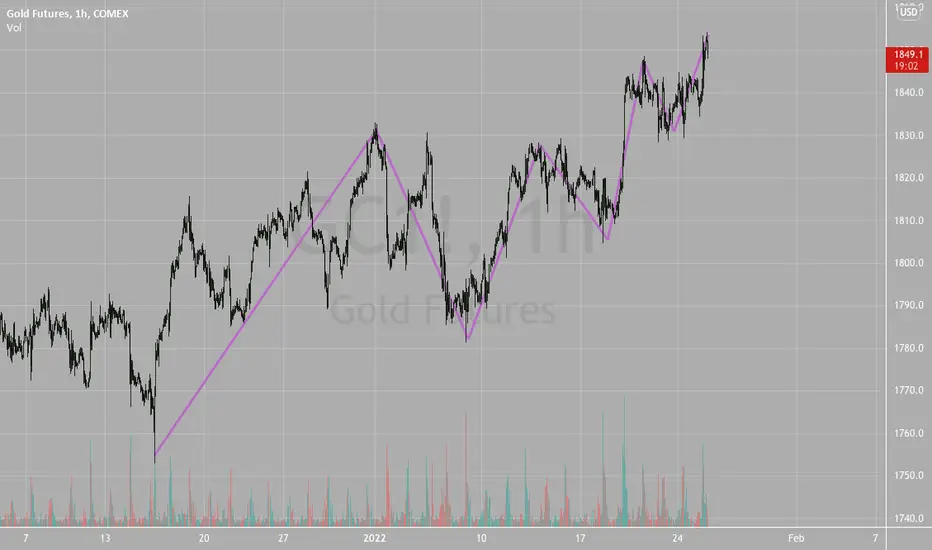
Corrective Price Action In GoldGold similar to oil conitnues to drag its feet and move in an ascending (bearish) pattern by
making higher highs and then correct strongly downward. This zigzagging price action OFTEN
indicates WEAKNESS. Gold is ALWAYS mistaken to be a safe haven when times are tough for the
general markets. Well this is NOT the case and has not been for most of its modern history.
I believe this misrepresentation of gold comes from the price action of the 1929 crash where gold
I believe did move contrary to stocks at times. BUT it does not concern us what happend 90 years ago!
Gold prices I believe were fixed back then and so its outcome had to have been different. What does
concern us is what happened in 2008 where gold fell just like any other asset. And this continues to
inspire confidence that this will NOT BE THE DEFENSIVE ASSET EVERYONE ELSE THINKS GOLD IS!
It is an asset just like oil or stocks. And in hard times it too will fall. The price action here reminds
us that this will likely be the case and sooner than later. For now we remain neutral and wait for further
confirmation before well sell gold.
sell signal for gold our team decide to buy
amazing setup with great potential to huge movement to the upside
sell #gold 1h TF @1833.539
tp1 1819.913
SL 1844.813
reason:-
broken head and shoulders pattern
⚠️ ⚠️ ⚠️ don't forget risk management ⚠️ ⚠️ ⚠️
<<<<< like and follow for more >>>>>

XAU/USD SellsGold sells into the FVG. Entry is a on a wick rejection from the 78.6% retracement after the BOS to the downside. Another confluence was that our entry was inline with the current OB in the market for the last downside push and we just broke the daily low which has invalidated the current range and presents a bearish outlook to me.

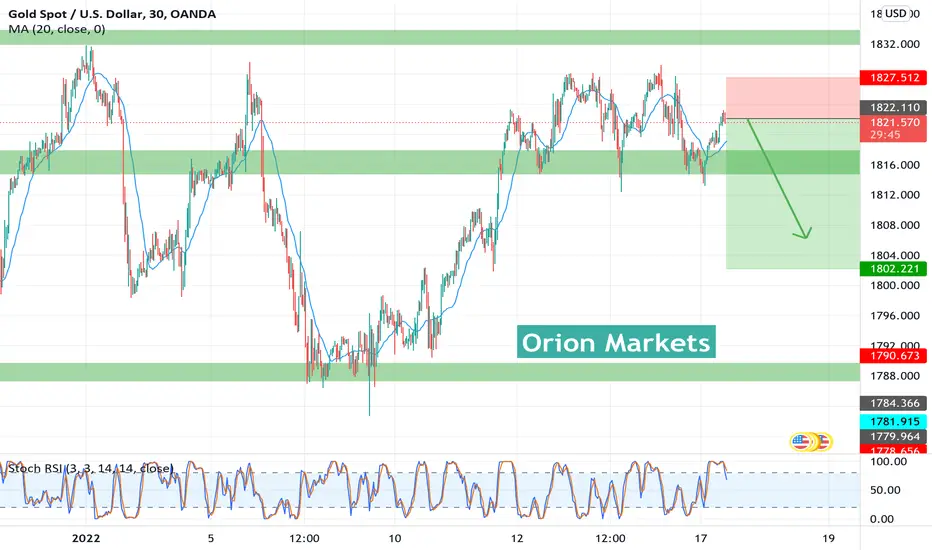
Gold (XAU) Sell idea Last week most USD pairs and indices fell in price drastically which resulted in Gold rising past the key 1820 level. However, it appears that the momentum has slowed down for Gold as there has been a failure to reclaim the 1830 level. Because of this and the fact many USD pairs and Indicies have seen some buying activity at their low levels, it might mean that Gold will fall in price as the USD starts to strengthen again. The target of this trade is at the recent resistance level of 1814, proceeding this, 1804 and 1796 are final targets. The stop loss area for this trade is located in the 1827 region.

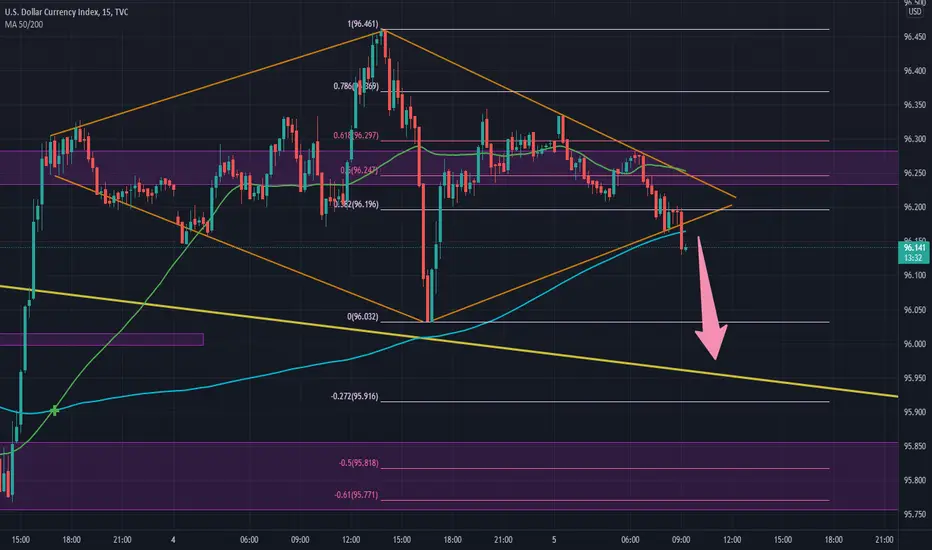
dxy sellDiamond pattern in DXY is broken, if we get second confirm signal we can sell.
TP1 96.00
TP2 95.900
TP3 95.800
What do u think ?
gold sellingGOLD selling idea based on us jobless claims and further technical analysis . further trade directions on the chart. Message me about getting more info via my persona website!

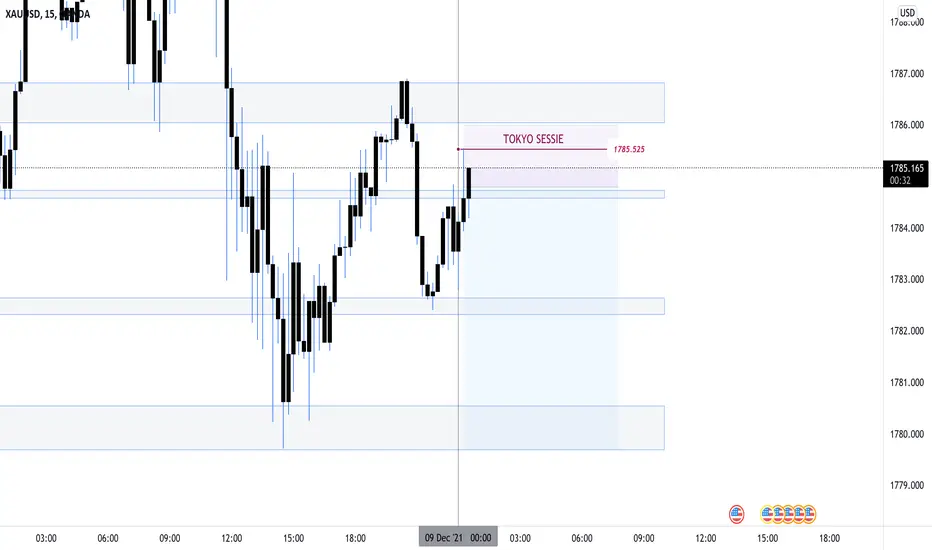
XAUUSD SELL/ MASTER KEY 👁SESSIE SCALP SAP
TOKYO
50 PIP TP
10 Pips SL
Mision Deep Divers
🧙🏽♂️New York, London, Hamburg, Moscow, Istanbul, Monaco - SAPHIRA INTERNATIONAL
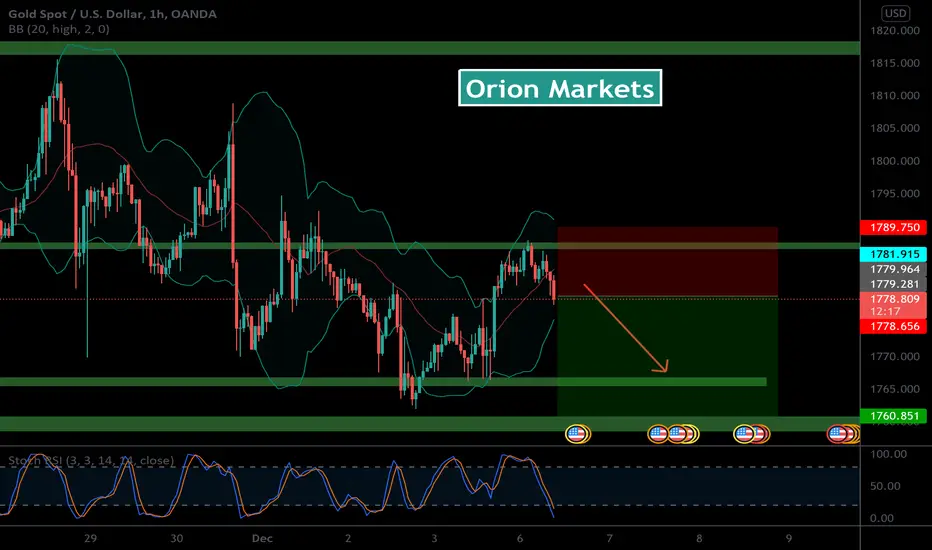
Gold Short Idea Gold has been no stranger to volatility in the last few weeks. There was a sell-off towards the levels of $1762, but now the price has rebounded towards the $1787 resistance zone. Gold's rally failed to surpass the $1800, in the short term I believe the trend is bearish. The RSI levels on the 4hr chart are overbought at 94.82. The target is the previous support level of $1770-67. The stop-loss area for this trade is located just above the recent high at $1788.
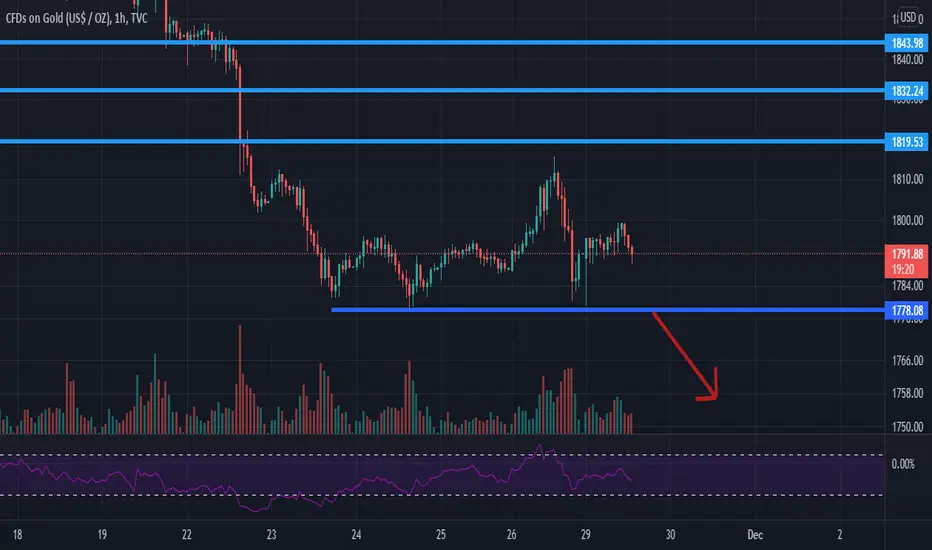
Gold is for sell due to movements of bears more strong We can sell gold after breaking the support of 1778 so we can get a big probability to be right to sell
Gold sell ~360pipsI am looking to sell Gold based on a H4 setup for about 360pips.
*This is not a signal.

Good Morning Traders - Is it time yet?Morning Traders,
Its been a crazy week with Gold for the past week. But is it time to see Gold finally melt? Let me know what you think in the comment section.

Gold SellGold reached major previous support level making it a new resistance level, will the downside continue?

Gold is Ready for Next SellXagusd Gold prices are aggressively moved to the sell side . look for any flag possibilities
I will more likely to sell gold rather than buy it there is no trade for me on gold .

DWHL_FX ANALYSISGOLD Making LL and LHs
Since structure shows that the bears are in control... we are looking to continue selling to create the new lower low into HTF Demand

DWHL_FXGOLD still has the sellers in control... so we are strongly bearish with
1m OB falling in line with 618 fib retracment for a good continuation trade
