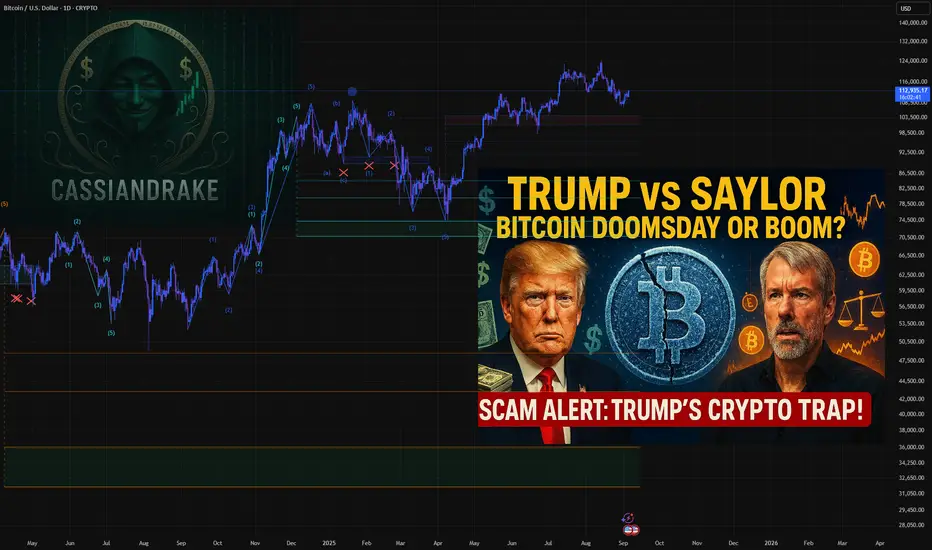
Trump’s Bond Strategy vs. Saylor’s High-Stakes Bitcoin BetBitcoin ( BITSTAMP:BTCUSD ) Macro Analysis: Trump’s Bond Strategy vs. Saylor’s High-Stakes Bitcoin Bet
1. Trump’s Bond Play and Crypto Ventures: A Dual Macro Hedge
Since returning to office in January 2025, Donald Trump has purchased over $100 million in corporate and municipal bonds, including debt from Meta, Citigroup, and local governments. These purchases are notable for two reasons:
Yield Lock: Trump’s bond buys were made at yields near 5%, a level not seen since the pre-2022 low-rate era. If the Federal Reserve cuts rates as expected in late 2025, the value of these bonds will rise, and their fixed 5% coupons will become increasingly attractive compared to new, lower-yielding issues.
Policy Alignment: Trump has publicly pressured the Fed to lower rates, which would further inflate the value of his bond portfolio. His administration’s fiscal and trade policies (e.g., tariffs, deregulation) could also indirectly support bond markets by stimulating demand for safe-haven assets.
Trump’s Crypto Ventures: Profiting from the Public
Unlike traditional crypto investors, the Trump family’s involvement in the sector is not built on holding Bitcoin or other digital assets. Instead, their companies focus on selling crypto-related products, cashing in on trading fees, and enriching themselves at the expense of an uninformed public. These ventures have been widely criticized as predatory, leveraging Trump’s political influence and public persona to attract unsuspecting investors into high-fee, low-value schemes—effectively an open scam that prioritizes short-term profits over genuine market participation.
Implications for Bitcoin:
If rates fall, bond yields become less competitive with risk assets like Bitcoin, potentially driving capital back into crypto.
However, Trump’s bond strategy and his family’s exploitative crypto ventures signal a preference for traditional financial instruments and extractive business models over supportive crypto policies. This could temper any positive impact on Bitcoin from his administration’s economic agenda.
2. Michael Saylor’s MicroStrategy: A Leveraged Bitcoin Bet
MicroStrategy, under Michael Saylor, has become the world’s largest corporate holder of Bitcoin, with over 446,000 BTC (worth ~$50 billion as of September 2025). The company’s strategy relies heavily on convertible debt issuance:
Debt Structure: MicroStrategy has issued billions in zero- or ultra-low-interest convertible notes (as low as 0.625%), using the proceeds to buy Bitcoin. This allows the company to avoid high interest payments and benefit from Bitcoin’s price appreciation.
Risks:
Leverage: If Bitcoin’s price falls sharply, MicroStrategy may face margin calls or be forced to sell BTC to meet debt obligations, exacerbating downward pressure on $BTCUSD.
Equity Dilution: The company’s aggressive stock issuance (planned dilution from 330M to 10B shares) could depress shareholder value if Bitcoin underperforms.
Recent Performance:
MicroStrategy’s stock NASDAQ:MSTR has outperformed Bitcoin in 2024–2025, but its valuation is now highly correlated with BTC’s price and market sentiment toward leverage.
3. Federal Reserve Policy: The Wild Card
Current Rates: The Fed has held rates at 4.25–4.50% since late 2024, but markets anticipate cuts in late 2025 (potentially 0.50–0.75% by year-end).
Impact on Bitcoin:
Rate Cuts: Historically, lower rates boost risk assets. Bitcoin could benefit from increased liquidity and weaker dollar, as seen in late 2024 when BTC rallied following Fed easing.
Inflation & Macro Risks: If cuts are delayed or inflation resurges, Bitcoin may face headwinds as investors favor bonds or cash.
4. The Crypto Winter Thesis: Is Doomsday Coming?
Bull Case: If the Fed cuts aggressively and liquidity floods markets, Bitcoin could resume its upward trajectory, especially if institutional demand (e.g., ETF inflows) remains strong.
Bear Case:
MicroStrategy’s Leverage: A sharp BTC drop could force NASDAQ:MSTR to liquidate holdings, triggering a cascade effect.
Regulatory Risks: Trump’s bond focus, his family’s extractive crypto ventures, and potential regulatory crackdowns could dampen sentiment.
Macro Uncertainty: Geopolitical tensions, recession fears, or a stronger-than-expected dollar could further pressure risk assets.
Technical Outlook:
BITSTAMP:BTCUSD is currently trading at $109,430 (as of September 4, 2025), up 1.63% over the past week but still range-bound between $107K–$112K.
Support/Resistance: Watch $105K (psychological support) and $115K (next resistance). A breakout or breakdown here could signal the next major move.
Conclusion: A Tale of Two Strategies
Trump’s bond purchases and push for rate cuts could indirectly benefit Bitcoin by reducing the appeal of fixed income, but his administration’s stance on crypto, and his family’s history of exploiting the public through crypto ventures, remains a significant red flag. Meanwhile, MicroStrategy’s leveraged Bitcoin bet is a high-risk, high-reward play that could either propel BITSTAMP:BTCUSD to new highs or accelerate a downturn if forced liquidations occur.
Traders should monitor:
Fed meetings (next: September 16–17, 2025) for rate cut signals.
MicroStrategy’s debt maturity schedule and Bitcoin holdings.
Trump’s policy shifts on crypto regulation and fiscal stimulus, as well as any new developments in his family’s crypto-related businesses.
Final Thought: The stage is set for a volatile Q4 2025. While the macro backdrop favors risk assets if the Fed eases, the specter of leverage unwinding, regulatory risks, and the Trump family’s extractive crypto practices looms large. Caution and active risk management are advised.
NASDAQ:MSTR NASDAQ:COIN TVC:GOLD TVC:SILVER NASDAQ:MARA BITSTAMP:ETHUSD CRYPTOCAP:USDC NASDAQ:TSLA NASDAQ:NVDA
GOLD-SILVER
Is it Time to Buy Silver and Sell Gold???Analysis of the "Gold to Silver Ratio" will Reveal Curical Facts
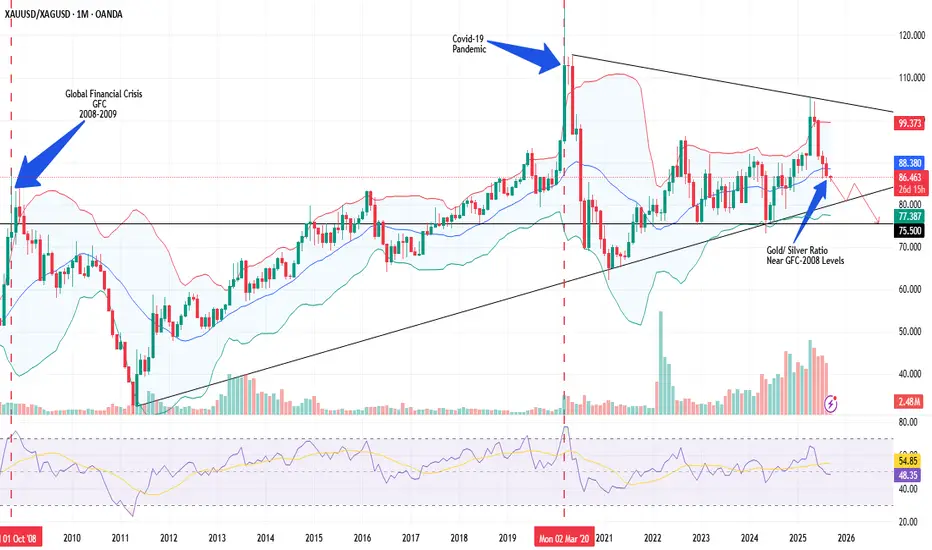
Analysis on Weekly Timeframe:
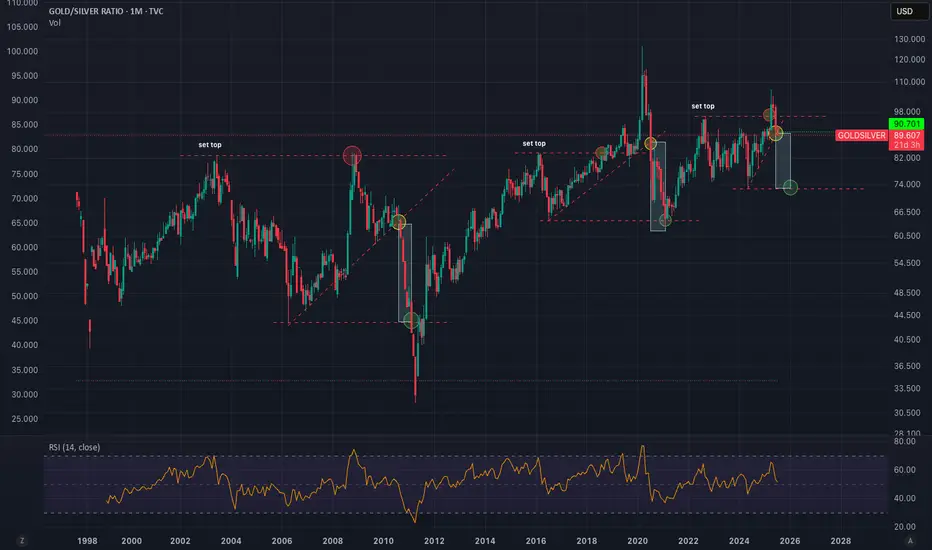
1. The ratio is trending within a symmetrical triangle pattern near 86.5.0, indicating gold is significantly more expensive relative to silver.
2. However, the ratio started declining after reaching peak of 105.5 during April, while testing the upper trend line of the triangle.
3. The ratio is expected to further fall & at least test the lower trendline of the triangle near 80.5, if breached, then support at 75.5 could be witnessed.
4. Currently, the ratio is trending near the levels previously seen during the Global Financial Crisis - 2008, after which it drastically declined.
Silver Shines Brighter Than Gold
---------------------------------------------------------------------------------------------------------------------
What is the Gold/Silver Ratio?
- The Gold/Silver ratio measures the value of gold in relation to silver.
- Basically, it tells us how many ounces of silver are needed to buy one ounce of gold.
- For example, if gold was trading at $1000 and silver was priced at $20, the gold : silver ratio would be 50.
- Current Situation - Gold Rate = ~$3500 & Silver = ~$40; the gold : silver ratio would be ~87.50
Interpretation
- A high ratio means gold is more expensive relative to silver (and vice versa)
- Historically, it has been seen that, when the ratio rises above 80 (currently it is 87.5), silver gets undervalued relative to gold
- An undervalued silver makes it a potential buy against gold.
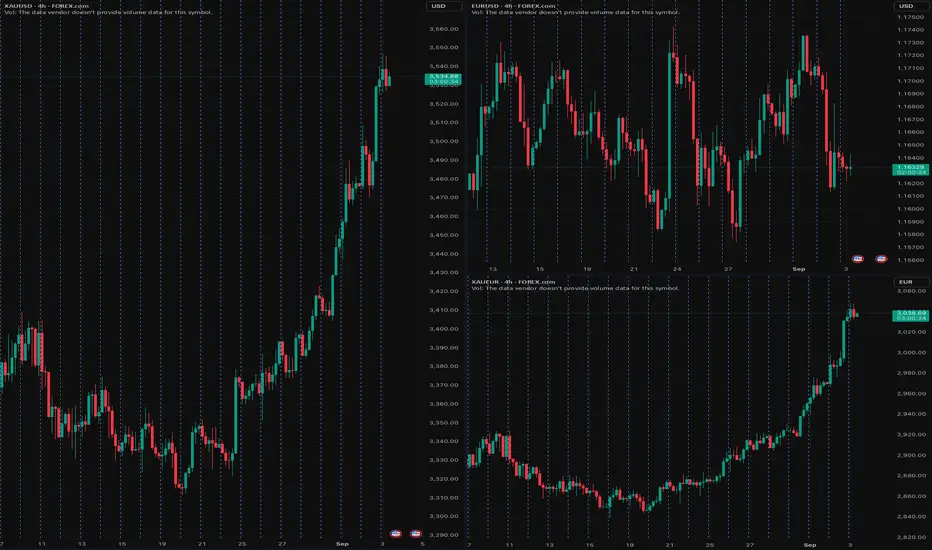
Gold’s $200 Surge Defies the DollarOver the past week, gold prices exploded by more than $200 per ounce, shattering the $3,500/oz threshold to new all-time highs . Silver joined the surge, breaching $40/oz for the first time since 2011 . This explosive precious metals rally is striking not only for its magnitude, but because it occurred in tandem with a strengthening U.S. dollar – a sharp break from the usual inverse correlation between gold and the greenback. Typically, “gold’s appeal reflects an inverse relationship with the dollar’s value”, as one analyst noted , and gold soars when the dollar slumps. Yet this time, the U.S. Dollar Index held firm (even rising against some currencies), so gold’s ascent “alongside the value of the US dollar” appears anomalous .
This disconnect has confounded the simplistic media narrative that tried to pin gold’s move on U.S. political drama – namely turmoil surrounding Donald Trump pressuring the Federal Reserve. Indeed, mainstream headlines have leaned on that explanation: “Gold surges after Trump’s Fed pressure,” blared the Financial Times, after President Trump’s attempted (and unprecedented) firing of Fed Governor Lisa Cook raised alarms about Fed independence . Bloomberg News similarly attributed gold’s spike to “rate-cut bets” spurred by Trump’s actions . There is some truth here – investors clearly sought safety amid U.S. political uncertainty, with the largest gold ETF (SPDR Gold Shares, ticker GLD) hauling in over $2.3 billion of inflows last week to top all ETFs, “as gold prices flirted with record highs near $3,500” following Trump’s attempt to oust a Fed official . Concerns over Fed independence and Washington turmoil did fuel safe-haven demand . But a closer investigation of market data and cross-asset flows reveals a more complex story than “Trump made gold jump.” In particular, the simultaneous rise of gold and the dollar hints at other forces at play – potentially global capital rotations and eurozone undercurrents – that the simplistic narrative overlooks.
Order Flow: U.S. Buying vs. Asian Selling
One immediate clue lies in where the strongest gold buying originated. Market internals and order flow patterns suggest that North American investors led this rally, while Asian and European participants were net sellers or laggards. Gold’s intraday price action repeatedly showed dips during Asia and London trading hours, followed by robust gains during U.S. market hours – indicating steady accumulation out of New York overcoming profit-taking elsewhere. This aligns with recent flow trends: “Gold ETF buying has flipped from Asia to Western investment markets”, notes BullionVault, as China and India saw outflows while U.S. and European gold funds began expanding together . In the past fortnight, Asian-listed gold ETFs shrank by over 5 tonnes – the heaviest 2-week outflow since the Ukraine invasion – even as Western funds saw their strongest stretch of inflows in over two years .
Physical gold selling in Asia corroborated this trend. As prices hit fresh highs above $3,000 and $3,500, Asian jewelry holders rushed to “cash in”. In India’s bazaars and Middle Eastern souks, retailers report a surge of people selling old jewelry and coins to lock in gains . “Customers raced to cash in their old gold,” Reuters noted, with scrap sales booming across India and the Middle East . This flood of recycled gold effectively made Asia a net supplier to the market during the rally, potentially “tempering gold’s rally” in those regions if it continues . In contrast, U.S. investors were voracious buyers: not only did American ETFs see big inflows, but U.S. futures markets showed relentless bids during New York trading sessions, driving price strength into each day’s close.
In sum, Western demand carried gold higher even as Eastern markets took profits. This East-to-West flow reversal suggests the price surge was not simply a global panic “bid” for gold, but rather a targeted rotation of capital – with U.S. and European buyers eagerly absorbing the supply coming out of Asia. Such a dynamic is important because it hints that new money (likely institutional and speculative) in the West was a key driver, rather than traditional physical demand from Asia (which actually softened amid the high prices).
Gold in USD vs. Gold in EUR: A Currency Disconnect
Another intriguing aspect of this rally is how differently it played out in U.S. dollars versus other currencies – particularly the euro. Gold’s price in USD hit record highs, but gold priced in euros (XAU/EUR) did not. In fact, at gold’s peak this week the euro-priced ounce “held beneath spring highs” even as the USD-priced ounce broke out . Gold in British pounds and Japanese yen did notch new records alongside USD gold , but the euro-denominated price lagged.
This discrepancy between XAU/USD and XAU/EUR is telling. Had the rally been driven purely by U.S.-centric fears (Trump/Fed turmoil) causing a weak dollar, we would expect the opposite – gold might jump in USD but soar even more in euros as the dollar falls. Instead, the dollar strengthened against the euro, and gold’s rise in USD terms outpaced its rise in EUR terms. One interpretation is that some of the buying came from investors shifting capital out of euro assets and into dollar-based gold, effectively boosting both gold and the dollar simultaneously. In other words, capital flight from euro-based holdings could be an underlying factor. If European investors (or global investors with euro exposure) moved funds into U.S. dollars or dollar-priced gold, that would drive the dollar higher at the same time as gold – precisely what we saw.
It’s notable that earlier in the year, gold in euros had spiked to record levels (during a bout of euro weakness and regional banking worries), whereas U.S. gold lagged at that time. Now the roles reversed: “the dollar price topped its previous high, but the euro price of gold stayed below its spring peak” . This reversal suggests the latest rally was U.S.-led, not euro-led. Rather than a panic specifically within Europe, this feels like a more subtle rotation away from the euro toward “safe” currencies and assets. The euro’s exchange rate was relatively firm during this gold spike (indeed, gold’s jump was despite a firm dollar, not because of a weak one), implying the move wasn’t about a collapsing euro – it was about proactive reallocation. In essence, global investors may be quietly diversifying out of euros into gold (and dollars) as insurance against potential eurozone troubles down the line.
Speculators Pile In: CFTC Data Shows Growing Longs
Fueling gold’s ascent has been a wave of speculative positioning in the futures market. The Commodity Futures Trading Commission (CFTC) Commitments of Traders (COT) report reveals that hedge funds and money managers have been steadily adding to bullish gold bets. In fact, bullish bets are at their highest levels in years. As one market analysis noted, “the net long position of Managed Money traders rising… back to 4-year high… reaching 155% of long-term average” . This means speculators hold vastly more long contracts than usual, a clear sign of momentum-chasing and confidence in further upside.
Recent data confirms the build-up: speculators’ net-long gold positions jumped to around 237,000 contracts in mid-August (versus ~178,000 in early 2024) and remain elevated . For context, that mid-August figure was the largest net long in at least four years. Even trend-following funds that had been absent are now “firing on all cylinders,” adding to length as gold broke out. Importantly, while these speculative inflows are large, some analysts point out they are “relatively modest… given the move in gold prices – suggesting there is further upside to come” if more investors pile in . In other words, positioning is bullish but not yet at extreme record levels in proportion to gold’s price move, leaving room for additional buyers.
This surge in paper gold interest highlights that the rally has a strong “hot money” component. It’s not just passive safe-haven holding; fast-moving traders are actively driving the market higher. The rising COT longs also underscore why gold’s jump defied the dollar: in a typical risk-off scenario, one might see short covering or flight from other assets incidentally lift gold, but here we have an affirmative speculative buildup anticipating higher gold ahead.
Massive ETF Inflows: GLD and Silver ETFs See Big Demand
Alongside futures activity, investment flows into gold and silver exchange-traded funds (ETFs) have been massive, indicating broad-based demand from institutions and retail investors alike. The flagship gold ETF, GLD, saw particularly eye-popping inflows. In the week of the surge, GLD attracted roughly $2.3 billion of new money, making it “the No.1 asset gatherer among U.S.-listed ETFs” . To put that in perspective, GLD outdrew even the largest stock index funds for the week – a remarkable rotation of capital into precious metals.
These inflows pushed GLD’s total assets to new heights, as investors sought the convenience of paper gold exposure during the rally. Other precious metals funds saw similar interest: iShares’ silver trust (SLV) reportedly logged sizable inflows as silver prices jumped in unison with gold. Silver’s rally – over 10% in a week to above $40/oz – was the strongest in years, and analysts noted that “momentum traders obviously also became involved” once silver broke technical levels . The U.S. government’s proposal last week to classify silver as a critical mineral (which could spur domestic stockpiling) “helped to fuel the surge through $40” , giving fundamental justification to silver’s move and further enticing ETF investors.
Taken together, the ETF data paints a picture of widespread investment allocation into precious metals. Gold-backed ETFs globally had already been seeing positive inflows in recent months – the World Gold Council reported that the first half of 2025 saw the largest H1 gold ETF inflows since 2020 – and this past week accelerated that trend. The demand was not confined to the U.S. either; European-listed gold funds also saw creations (with particularly strong buying in the UK, Switzerland, and Germany in recent months) . But the U.S. flows were dominant. North American funds accounted for the bulk of new gold ETF buying this quarter , reflecting that U.S. investors are driving this shift to hard assets.
Such massive ETF inflows, alongside record futures longs, indicate a broad conviction trade into gold and silver. Whether as an inflation hedge, a geopolitical hedge, or a play on future Fed easing, capital is pouring into these assets via easily accessible vehicles. GLD’s $2+ billion weekly haul underscores that this was not a niche move – it was front and center in capital markets.
Not a Typical “Risk-Off” – Stocks, Crypto and Bonds Stayed Resilient
Crucially, unlike many past gold spikes, this one did not coincide with a major selloff in other asset classes. In classic market panics, gold’s rise is often mirrored by tumbling equities, collapsing bond yields (as investors buy Treasuries), or even a rush out of speculative assets like cryptocurrencies. That didn’t really happen here – indicating this gold rally was driven by rotation of capital from cash or low-yield reserves, rather than forced liquidations elsewhere.
Consider the stock market: global equities barely blinked. The MSCI World Stock Index had just hit an all-time high in late August; it fell only about 1.5% from that peak during gold’s run-up . A 1.5% dip is trivial – essentially normal daily volatility – and U.S. indices similarly remained near record levels. There was no sense of an equity crash or widespread fear in stocks; in fact, some risk assets like small-cap stocks rose on hopes of Fed rate cuts. Crypto markets were also relatively stable. Bitcoin and other major cryptocurrencies held in their recent trading ranges with no signs of a flight-to-safety out of crypto. Unlike early 2020 (when Bitcoin plunged during a dash for cash), this time crypto was “largely unfazed”. If anything, crypto investors likely interpreted Fed dovishness as positive, which could have buoyed coins – but there was no mass exodus from crypto into gold.
Bonds told a more nuanced story. U.S. Treasuries did not rally alongside gold – in fact, long-term bond prices fell last week, sending yields higher . Typically, if there were a major fear-driven episode, one would expect Treasury yields to plunge (as bond prices rise on safe-haven buying). Instead, the 10-year and 30-year yields ticked up. Notably, gold and bonds moved in opposite directions: “the split between government debt and gold prices has been underway, with gold rising… while the value of longer-term Treasury bonds has halved over five years” . Part of last week’s bond weakness was due to fresh concerns about fiscal deficits and inflation – which ironically can boost gold. A fund manager at Newton noted that the bond market isn’t yet signaling long-term inflation, but “there is falling confidence that can continue indefinitely”, characterizing the situation as a “fiscal crisis, rather than an economic crisis” driving gold’s rise . In short, gold’s jump wasn’t the result of a panic-driven bond rally – if anything, it coincided with a bond selloff. That implies the money fueling gold had to come from elsewhere (cash, forex reserves, or rotation out of other holdings) rather than from investors dumping stocks and bonds in fear.
This cross-market resilience supports the idea that the gold/silver inflows were more of a strategic reallocation or hedge, not a reaction to an acute crash in other assets. As one analyst put it, “If you were a Martian observing this, gold and long-term bonds sending opposite signals is telling you there are concerns” below the surface – but it’s an unusual mix of signals. Investors didn’t run for the exits in equities or corporate bonds; instead, they appear to have drawn on sidelined cash or reallocated currency reserves to fund their gold purchases. This makes the episode more interesting: it hints at a rotation happening quietly, rather than an obvious crisis visible in all markets.
Beyond the Trades: Is Capital Fleeing the Eurozone?
These patterns – U.S.-led gold buying, euro underperformance, no broad risk asset selloff – point to a deeper macro narrative: a potential rotation of capital out of Europe’s financial system and into hard assets. Several data points and developments reinforce this interpretation:
Reserve Currency Shifts: In a striking milestone, gold has now surpassed the euro as the world’s second-largest reserve asset (behind only the U.S. dollar). An ECB report highlighted that for the first time ever, gold represents a larger share of global foreign exchange reserves (20%) than the euro (16%) . In other words, central banks collectively hold more value in gold than in euro-denominated assets. This reflects concerted gold accumulation (over 1,000 tonnes per year since 2022, more than double the prior decade’s average ) at the expense of fiat holdings. It’s effectively a rotation out of traditional currencies – notably the euro – and into bullion. Such a shift “is remarkable”, as one market veteran noted, and coincides with 95% of central banks stating they plan to increase gold reserves in the next year – the highest on record . This trend screams a subtle mistrust in the long-term stability of the euro and other fiat assets, and a desire for the safety of hard currency.
Eurozone Stress Signals: While the eurozone isn’t in open crisis, there are hints of structural stress that may be nudging smart money to preemptively seek safety. Political instability is one concern – for example, in France (the Eurozone’s second-largest economy), the government is teetering on the edge of collapse amid budget battles. Even ECB President Christine Lagarde cautioned that “any risk of a government falling in the euro zone a concern”, after French markets wobbled on snap election fears . Such political tremors feed into a narrative of euro-area fragility. Meanwhile, European banks and governments are grappling with high debt loads and thin margins. As interest rates rose this year, sovereign and corporate borrowing costs in Europe jumped, exposing vulnerabilities in heavily indebted nations. Observers have warned of “debt saturation” and precarious leverage in Europe’s financial system (some even pointing to bloated gold derivatives positions at European banks as a risk) . If investors – or other central banks – perceive even a small chance of a Eurozone financial accident (be it a debt crisis, a bank failure, or political rupture), they may quietly trim exposure now.
Geopolitical Fragmentation and Inflation Hedging: Beyond Europe-specific issues, the broader macro backdrop is one of fracturing globalization and lingering inflation – conditions under which hard assets historically thrive. Under President Trump, the U.S. has upended elements of the post-WWII order, from trade alliances to security commitments . Trade wars and tariffs are forcing reallocations of supply chains and reserves. According to Reuters, Trump’s aggressive policies and sanctions have “upended Western security policy” and contributed to an environment where diversifying away from reliance on any single currency (especially the U.S. dollar) becomes prudent . Many developing countries have responded by boosting gold holdings as a hedge against geopolitical risks and potential sanctions (a lesson learned after Russia’s USD reserves were frozen in 2022) . This “de-dollarization” impulse, interestingly, often doesn’t benefit the euro – it benefits gold. Nations looking to reduce dollar dependence aren’t rushing into euros; they’re buying bullion (and to some extent, yuan) . This adds to global gold demand independent of day-to-day traders.
At the same time, inflation remains a concern. Though off its peak, inflation in both the U.S. and Europe has been stubbornly above central bank targets, eroding trust in fiat purchasing power. Gold is the classic inflation hedge, and its appeal grows when investors worry that “there are concerns… the right tail of inflation risk” in the future . Notably, this gold rally occurred even as inflation expectations in bond markets remained relatively contained – suggesting some investors aren’t waiting for official signals; they are positioning early against the possibility of inflation or currency debasement down the road. The fact that inflation-linked bonds have not rallied (underperforming regular bonds) implies the bond market isn’t convinced inflation will run away . But gold’s surge could be seen as a belts-and-suspenders approach – insurance in case the bond market is wrong or central banks falter.
Hard Asset Accumulation by Private Wealth: It’s not just central banks. Wealthy individuals and institutions are also shifting into tangible assets. Anecdotally, vault operators report high demand for physical gold storage. Real assets from commodities to real estate are getting increased allocation in portfolios as a hedge against both inflation and geopolitical strife. Silver’s inclusion on a U.S. critical minerals list last week (to secure supply chains) is emblematic of the new era of resource nationalism and strategic stockpiling . Gold and silver stand to benefit as strategic assets in a fragmenting world. The rally in both metals might be an early sign of investors preferring the certainty of hard assets in hand over promises on paper.
All these factors converge to a clear insight: the gold and silver surge may be an early warning signal of capital seeking safety from systemic risks – particularly those emanating from currency systems and financial institutions. Unlike a sudden crisis that causes a panicked stampede, this feels more like a strategic redeployment of capital: a rotation before the full storm hits.
Conclusion: A Canary in the Coal Mine?
Gold’s extraordinary run this past week – soaring in concert with a firm dollar, absent a stock market crash – is not just a one-off curiosity. It appears to be a manifestation of deeper shifts in investor behavior and economic regime. The simple story of “Fed drama and political turmoil” belies the larger context: we are likely witnessing a rotation toward safety and solidity in anticipation of future turbulence. Whether that turbulence comes from Europe’s financial system, unsustainable government debts, or a fracturing global order, investors are hedging their bets.
Precious metals are, in effect, serving as a barometer of macro stress and a receptacle for capital seeking refuge. As the European Central Bank’s own analysis noted, “gold generally offers a safe haven in times of stress… in extreme cases, gold prices tend to rise alongside the US dollar, while stock and bond prices decline” . That’s essentially what we’ve just observed – minus the sharp stock decline (at least so far). It puts policymakers on notice: something is bubbling beneath the surface. The last time we saw gold and the dollar rising together was during episodes like the onset of COVID-19 and the 9/11 attacks – clear crises. This time, the “crisis” is more subtle: a slow burn of fiscal strains, geopolitical realignments, and creeping distrust in institutions.
For investors and professionals, the takeaways are clear. Diversification into hard assets is gaining momentum, and not without reason. Gold’s role as a portfolio stabilizer is reasserting itself; even at record nominal prices, it’s attracting huge inflows as a form of insurance. The traditional inverse relationship with the dollar is not sacrosanct – when confidence in both major fiat blocs (dollars and euros) is tested, gold can rise against all currencies at once. Silver’s concurrent jump and its industrial strategic importance highlight that this is a broader precious metals renaissance.
Finally, it’s worth pondering the source of the $200 gold move. The evidence suggests it came not from panic, but from prudence – a reallocation from the quiet corners of cash and currency reserves into the safety of bullion. If that is the case, this gold surge could very well be the early tremor before larger quakes. Investors are effectively voting with their wallets, and their message is a cautious one: prepare for potential storms by holding real assets. Gold’s unusual rally, defying the dollar gravity, might be the canary in the coal mine for broader shifts to come – from an era of easy money and faith in central banks to one where tangible value and trust (or the lack thereof) drive decisions. As always, gold is both a barometer and a beneficiary of such paradigm shifts.
Sources:
Reuters – “Gold hits a record $3,532…main drivers fueled by U.S. President Trump’s upending of policy and Fed independence concerns.”
ETF.com – “GLD led all ETFs last week, hauling in $2.3B as gold flirted with $3,500.”
Reuters – “Gold tops $3,500… FT: ‘Gold surges after Trump’s Fed pressure’… Bloomberg: ‘Record high as rate-cut bets fuel demand.’”
BullionVault – Order flow: “Asian gold ETFs shrank…while European and North American products have now expanded together in 7 of the past 8 weeks, the strongest stretch in 27 months.”
Reuters – Physical market: “As gold prices jump… customers race to cash in old jewellery… If the rush to sell continues, could temper gold’s rally.”
BullionVault – “Dollar gold hit new highs…but Euro and Yuan price of gold held beneath spring highs”
BullionVault – COT data: “Net long position of Managed Money traders 4-year high…155% of long-term average.”
Reuters – “Silver breached $40, highest since 2011… momentum traders involved after US proposal to label silver a critical mineral helped fuel the surge.”
BullionVault – “Western stock markets dropped only 1.5% from last week’s record… long-term gov’t debt fell, driving yields higher, even as gold rose.”
ECB Financial Stability Review (via Frank Holmes) – “Gold now represents 20% of global FX reserves vs 16% for the euro – first time gold’s share exceeds euro’s.”
Reuters – Christine Lagarde: “France is solid but any risk of a government falling in the euro zone is a concern.”
Reuters – “Annual central bank gold purchases have exceeded 1,000 tons since 2022, double the 2010s average”
World Gold Council – “Gold ETFs saw 397t inflows Jan-June 2025, the largest first-half inflow since 2020.”
ECB Research – “In extreme cases (9/11, pandemic onset), gold prices tend to rise alongside the US dollar while stock and bond prices decline markedly – confirming gold’s safe-haven role in times of stress.”
- Gold trades near record highs on US rate cut bets; silver at 14-year high | Reuters
- Gold Surpasses Euro as the Second-Largest Reserve Currency in the World
- What does the record price of gold tell us about risk perceptions in financial markets?
- Gold Tops $3500 Record Price | Gold News
- Gold ETF Inflows Lead $34.3B Surge Into U.S.-Listed ETFs
- Gold ETF Investing Flips from East to West | Gold News
- After the gold rush: Asian, Mid-East sellers flood jewellery market | Reuters
- Central bank demand propels safe-haven gold to record peak | Reuters
- Explainer: Gold's record-breaking rally: who's keeping it going? | Reuters
- Global flows stay hot | World Gold Council
- France's far-right RN says it is getting ready for potential snap elections | Reuters
- Eurozone Financial Crisis: Debt and Derivative Dangers
Explaining Fibonacci Retracement/Extension levelsThis video is designed to help teach you why I use the Fibonacci Defense levels as components of price action and how I use Fibonacci retracement/extension levels (related to previous market trends).
Remember, the three components of price action are TIME, PRICE, & ENERGY.
If you don't understand how price is structured before attempting to use Fibonacci concepts, it's almost like trying to throw darts blindfolded.
You must break down the previous trends in order to try to understand what is happening with current price trends (expansion/contraction/phases).
Watch this video and I hope it helps all of you understand what the markets are doing and how to use Fibonacci Retracement/Extension levels more efficiently.
All types of technical analysis are validation tools - not guarantees. The only thing we get out of technical analysis is a way to validate or invalidate our expectations. A or B. Nothing else.
Get some.
#trading #research #investing #tradingalgos #tradingsignals #cycles #fibonacci #elliotwave #modelingsystems #stocks #bitcoin #btcusd #cryptos #spy #gold #nq #investing #trading #spytrading #spymarket #tradingmarket #stockmarket #silver

SPY/QQQ Plan Your Trade Update For 8-26This new video should help you understand the dynamics playing out related to SPY/QQQ, BTCUSD and GOLD/SILVER.
Get some.
#trading #research #investing #tradingalgos #tradingsignals #cycles #fibonacci #elliotwave #modelingsystems #stocks #bitcoin #btcusd #cryptos #spy #gold #nq #investing #trading #spytrading #spymarket #tradingmarket #stockmarket #silver

SPY/QQQ Plan Your Trade Update For 8-22 : Is This The Top?This is a follow-up to my recent video to help answer questions and to share my analysis of the SPY/QQQ, Gold/Silver, and Bitcoin for all viewers.
This video also addresses the tools I use to stay on top of the swings in price movement and highlights why I believe the markets may continue to unwind from these lofty highs.
Get some.
#trading #research #investing #tradingalgos #tradingsignals #cycles #fibonacci #elliotwave #modelingsystems #stocks #bitcoin #btcusd #cryptos #spy #gold #nq #investing #trading #spytrading #spymarket #tradingmarket #stockmarket #silver

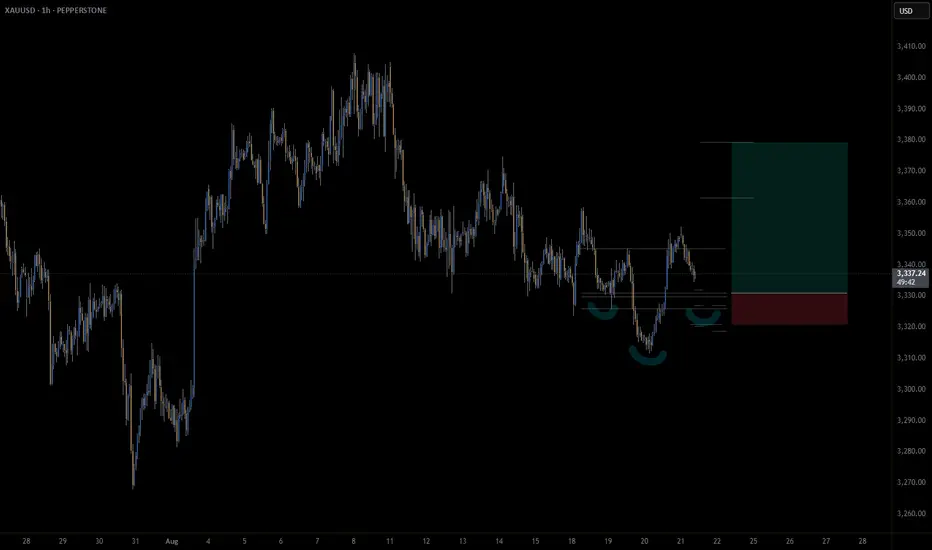
Gold - Inverse head and shoulders on hourly chartAn inverse head & shoulders is potentially forming on the hourly gold chart.
In this case, the IHS acts as a continuation pattern, as gold has been consolidating sideways for some time.
📊 Trade Plan:
Risk/Reward: 3.8
Entry: 3330.9
Stop Loss: 3320.8
Take Profit 1 (50%): 3361.5
Take Profit 2 (50%): 3379.3
💡 GTradingMethod Tip: Every moment in the market is unique. That’s why it’s crucial to predefine and accept your risk before entering a trade.
🙏 Thanks for checking out my post! Make sure to follow me to catch the next update. If you found this helpful, give it a like 👍 and share your thoughts 💬 — I’d love to hear what you think!
⚠️ Please note: This is not financial advice. This content is to track my trading journey and for educational purposes only.
Is this the top? SPY/QQQ Plan Your Trade Update For 8-20I know it has been a while since I shared a video.
This video is designed to share the downside risks I see as a potential for the markets IF this big speculative phase unwinds like I think.
Ultimately, you guys are the ones who will be making the trading decisions. I just want you to be aware that the markets are extremely volatile right now and the data is pointing to a very clean Excess Phase Peak (EPP) pattern.
As you are all aware, the EPP pattern suggests that a breakdown in price is likely where price may attempt to target the FLAG LOW.
If that happens, be prepared for a -15% to -20% breakdown in price before the end of 2025 - possibly seeing an even bigger price collapse.
In my opinion, this breakdown is the result of a broad unwinding of excesses related to the Biden economy (free money) and a move towards more reasonable US economic policies.
Overall, this pullback is necessary for the Wave 1 of Wave 5 structure to complete. Once this pullback is complete, the bigger rally phase (Wave 3 of Wave 5) will begin. And get ready for a big rally phase with Wave 3.
So, I hope this video helps you learn how to identify and plan for some of the biggest price swings in the SPY/QQQ, and prepare for even bigger moves in Gold/Silver and Bitcoin.
Get some.
#trading #research #investing #tradingalgos #tradingsignals #cycles #fibonacci #elliotwave #modelingsystems #stocks #bitcoin #btcusd #cryptos #spy #gold #nq #investing #trading #spytrading #spymarket #tradingmarket #stockmarket #silver

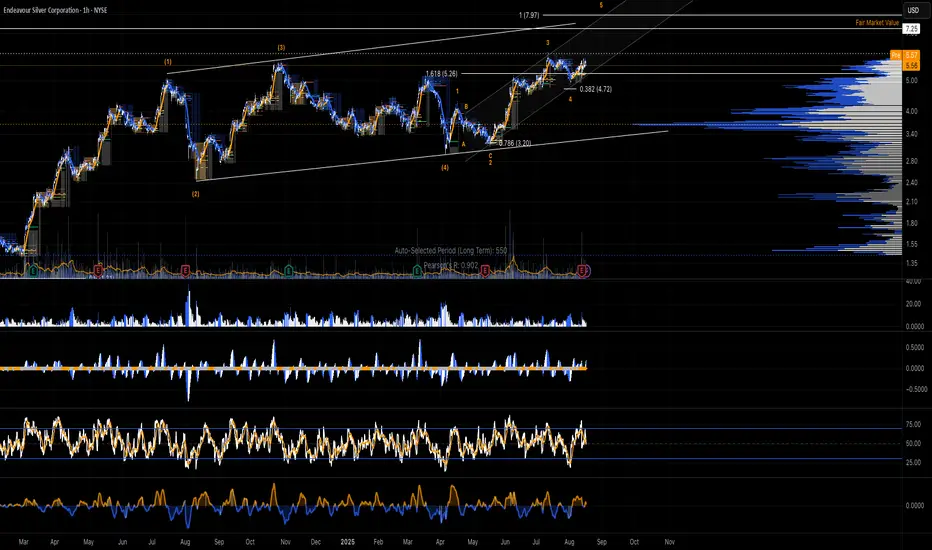
Endeavour Silver Corp. $EXK ~ Bulls in Charge...Endeavour Silver Corp. is a mineral company, which engages in the evaluation, acquisition, development and exploitation of precious metal properties in Mexico and Chile. The firm's projects include the Terronera property in Jalisco, the El Compas property, the Guanacevi Mine in Durango, Bolanitos Mines in Guanajuato, and the Parral project in Chihuahua, Mexico. The company was founded by Bradford James Cooke on March 11, 1981 and is headquartered in Vancouver, Canada.
Gold | Oil | Dollar | Silver | Natural Gas Price ForecastGold | Oil | Dollar | Silver | Natural Gas Price Forecast
COMEX:GC1! COMEX:SI1! AMEX:UNG NYMEX:CL1!

ETH - If You Know ...... You Know whats Coming
NYSE:BLK $BUIDL tokenized U.S.-Treasury fund launched on COINBASE:ETHUSD in Mar 2024—Wall Street is already settling real dollars on-chain.
NYSE:JPM JPMD stablecoin just went live on Base (an COINBASE:ETHUSD L2), piping wholesale payments from a $4 T balance-sheet straight through COINBASE:ETHUSD rails.
COINBASE:ETHUSD isn’t just riding the next crypto cycle—it’s becoming Wall Street’s settlement layer. From BlackRock’s on-chain Treasury fund to JPMorgan’s and soon Bank of America’s dollar tokens, a tidal wave of institutional stable-coin flows is lining up behind ETH. Fewer coins, more real-world volume—if you know, you know what’s coming.
NYSE:BAC CEO says they’ll issue a dollar-backed token the moment regulators nod—another tier-1 bank boarding the Ethereum train.
Stablecoin cap has blasted past $230 B , with 80 %+ of all on-chain transfers riding Ethereum (plus BSC) blocks.
Corporate settlements via stablecoins grew 25 % YoY in 2024 as multinationals replaced SWIFT with instant on-chain clearing.
Daily stablecoin throughput averages $7 B—each hop burning ETH and tightening supply.
BCG projects tokenized real-world assets to exceed $16 T by 2030 , with EVM chains as the default plumbing.
Over 500 M wallets already interact with stablecoins , a 30 % YoY surge led by emerging-market demand.
L2s like BINANCE:ARBUSDT & BINANCE:OPUSDT cut transaction fees 35 % yet still settle back to mainnet—meaning ETH captures the fee stream and the burn.
Bottom line: a tidal wave of bank-grade stablecoins + tokenized assets is lining up behind ETH; supply shrinks, demand soars—if you know, you know what’s coming.
quote] Marty Boots | 17-Year Trader — smash that , hit LIKE & SUBSCRIBE, and share your views in the comments below so we can make better trades & grow together!
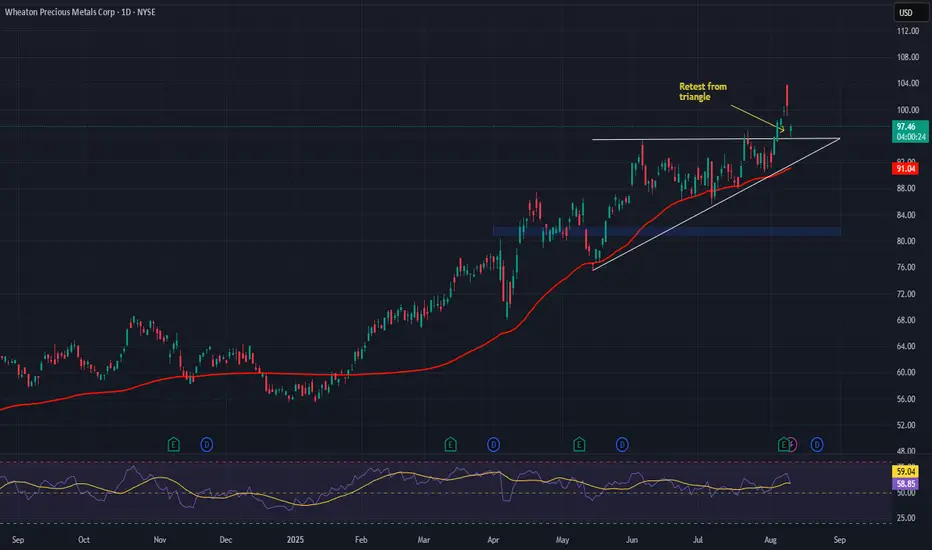
Wheaton (WPM) – Streaming Growth + Precious Metals TailwindsCompany Snapshot:
Wheaton Precious Metals NYSE:WPM is a top-tier precious metals streaming company, giving investors leveraged exposure to gold & silver while avoiding traditional mining risks.
Key Catalysts:
Production Growth Pipeline 🚀
Blackwater, Goose, Platreef, and Mineral Park all scheduled to begin production by late 2025.
Expected to meaningfully boost output, cash flow, and dividend capacity.
Commodity Tailwinds 📈
Rising gold & silver prices supported by central bank buying, geopolitical tensions, and persistent inflation.
Fixed-cost streaming model maximizes margin expansion in a bull metals market.
Earnings Acceleration 💵
Q2 2025 EPS forecast: $0.58 (+44% YoY).
Revenue forecast: $424M (+42% YoY).
Potential for valuation re-rating as growth trends materialize.
Shareholder Appeal 📊
$0.165 quarterly dividend offers both income and growth upside for investors.
Investment Outlook:
Bullish Entry Zone: Above $81.00–$82.00
Upside Target: $115.00–$120.00, driven by new mine ramps, commodity strength, and operational leverage.
#WPM #Gold #Silver #PreciousMetals #Mining #StreamingModel #Commodities #InflationHedge #DividendStocks #SafeHavenAssets
SPY/QQQ Plan Your Trade Update For 8-5This short video is to provide my followers with an update.
I'm still here. I'm still working on projects and new TV code. I have developed a couple of new strategies that I like and that seem to continue to perform.
Overall, I'm still doing my best to deliver superior analysis/results for my followers.
This video covers the SPY/QQQ, Gold/Silver, and BTCUSD (plus extras).
Hope you are all getting some great profits from these moves.
GET SOME.
#trading #research #investing #tradingalgos #tradingsignals #cycles #fibonacci #elliotwave #modelingsystems #stocks #bitcoin #btcusd #cryptos #spy #gold #nq #investing #trading #spytrading #spymarket #tradingmarket #stockmarket #silver

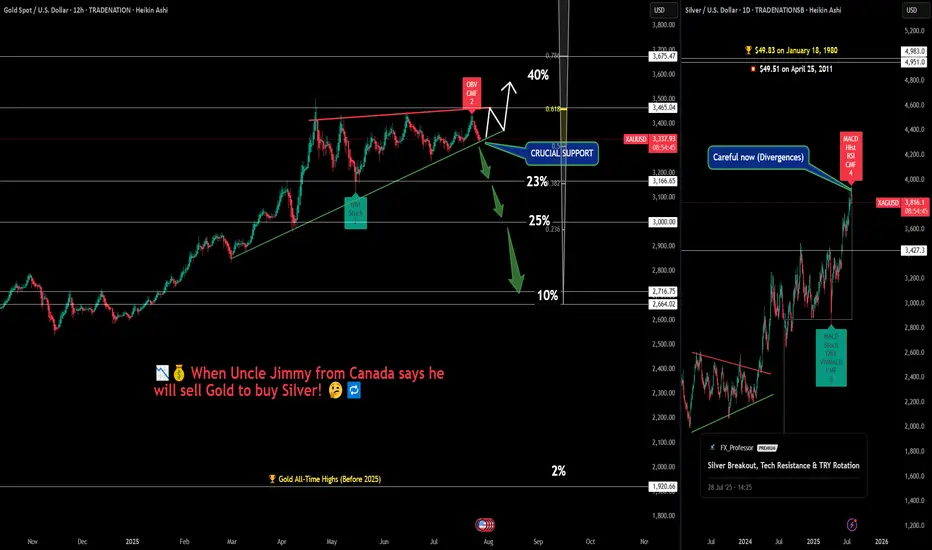
When Gold Believers Flip – Uncle Jimmy, Silver & New Safe Havens💰📉 When Gold Believers Flip – Uncle Jimmy, Silver, and the New Safe Havens 🧠🔄
Let me tell you a story that says more than any chart ever could.
📜 Meet Uncle Jimmy (from Canada) . He’s not really my uncle, but out of respect, that’s what I call him.
A true OG — early stockbroker, big mustache , 20+ apartments, a life built on commissions, charts, and one sacred truth: '' Gold never lies. ''
He's bought gold at every dip, every crisis, every whisper of war or inflation.
But now?
“I’m thinking of selling gold to buy silver.” ( WHAT?! 😳👀💥)
That’s it. That’s the moment.
📉 A gold maxi flipping into silver. A generational pivot.
And that’s the real divergence the chart doesn’t always show.
⚖️ Macro Sentiment Rotation:
📊 Gold
Sitting on crucial support. Breakout potential to $3,465+ remains — but divergences (OBV, CMF) are stacking. A breakdown? Targets stretch down to $3,000 or even $2,716.
🪙 Silver
Just hit $38.14 — now eyeing the legendary $49.83 ATH from 1980. Legacy capital rotating in. Silver’s moment? (My chart says 'wait a bit'...divergences!)
💻 NASDAQ/Tech
Some now call it the “new safe haven” — not because of bonds, but because of trust in corporate resilience vs. geopolitical chaos. When Nasdaq rises, silver often outperforms gold — risk appetite returns, and so does industrial metal demand.
₿ Bitcoin
And then there’s Bitcoin…
The safe haven that legacy minds still don’t trust.
I told Uncle Jimmy to buy it at:
→ $4,000
→ $18,000
→ $45,000
→ Even $70,000.... I stopped doing that at some point, he just wouldn't get it, or wouldn't make a move into the 'crypto unknown'. Respect!
So...He never did. Maybe Bitcoin just became what gold once was — but for the next generation. Not for Big Jimmy.
🧠 What to Watch:
Sentiment is shifting
Safe havens are evolving
Charts show structure — but stories show psychology
Whether you're long metals, crypto, or tech — the key is knowing when beliefs break and rotations begin.
Watch price. Listen to sentiment. And never underestimate Uncle Jimmy.
What would you tell Jimmy today if he was your uncle? Let me know below!
One Love,
The FX PROFESSOR 💙
Disclosure: I am happy to be part of the Trade Nation's Influencer program and receive a monthly fee for using their TradingView charts in my analysis. Awesome broker, where the trader really comes first! 🌟🤝📈
July 21 Special Update : Metals, SPY & More. What's Next.This special update is to highlight why I continue to believe traders should stay very cautious of this rally in the SPY/QQQ/BTCUSD.
Underlying economic data suggest that this is one big speculative rally following the April Tariff collapse.
And, the economic data I see from my custom indexes suggests the markets are moving into a very volatile and potentially dangerous topping pattern.
As I've stated many times in this video. I'm not saying the markets have topped and you should SELL EVERYTHING. I'm suggesting this market is extremely over-valued in terms of the underlying risk factors at play and the very clear data that suggests the markets are already in a recessionary price trend.
You may ask, "How can the markets continue to rally like this in a moderate recession?".
The answer is simple.
All bubbles end with a super-speculative phase. This phase is where everyone piles into a euphoric attempt to ride the rally higher.
It happened in the late 1990s. It has happened again through the 2000-2005+ housing bubble. Heck, it has occurred in the collectors market over the past few decades where people spent fortunes on the "hottest items" (think Beanie-Babies) only to find out they bought at the height of the bubble.
That is why I continue to urge traders to remain cautious and to withdraw profits from this speculative rally phase. Protect your investment capital immediately and consider the risks associated with the information I share in this video.
I'm not trying to scare anyone. I'm just trying to be realistic in terms of what I see in my data and why I believe now is the best time to MOVE TO SAFETY.
My data suggests that the markets are about to enter a fragile and potentially dangerous pullback phase. If you want to ride it out - go for it.
Otherwise, prepare for significant volatility over the next six months or more.
Get some.
#trading #research #investing #tradingalgos #tradingsignals #cycles #fibonacci #elliotwave #modelingsystems #stocks #bitcoin #btcusd #cryptos #spy #gold #nq #investing #trading #spytrading #spymarket #tradingmarket #stockmarket #silver

Bear-Trap armed: Gold ticks 4 / 5 boxes - waiting for the spark1️⃣ Why the 2020 déjà-vu is EVEN louder
2025 (now) 2020 (pre-rally)
TradingView ideas still bearish 💬
> 70 % 60 % bearish
Managed-money net-longs ≈ 115 k
-35 % from Apr. –25 % from peak
+ $741 m PM-ETF inflow Record IN-flows
G/S ratio 87 (< 90) Fell to 95
S&P keeps making highs Ditto
2️⃣ What’s still different
Real 10-y TIPS yield +0.7 % vs -1 % in 2020 → smaller monetary tail-wind.
Gold is already at an infl-adj. record – expect a short & sharp squeeze, not a fresh multi-year super-cycle (yet).
3️⃣ Checklist – updated
Signal Status 18 Jul Comment
———————————————————
Gold DAILY close ≥ $3 200–3 250 YES – $3 354 ✔
G/S ratio < 90 YES – 87 ✔
CFTC net-longs < 150 k YES – ~115 k ✔
ETF flows turn positive. YES – $741 m ✔
Equity stress (VIX > 25 or SPX −5 %) NOT YET – VIX 16.5 ✖
4 / 5 boxes = 99 % primed. One spark missing.
4️⃣ What could light the fuse
Date Potential trigger Why it matters
22 Jul Mega-tech Q2 earnings (NVDA/AMD) Any guidance miss → SPX wobble
30 Jul FOMC Fed holds but sounds dovish USD dump + yield spike risk
1 Aug Trump s “reciprocal” duties Imported-inflation scare → VIX pop
Early Aug. DXY crashes < 96 in < 5 days. Disorderly USD slide = funding stress
Hit ≥ 2 of: DXY < 96, VIX > 25, SPX -5 % or HY-spread +75 bp → final ✔.
Bottom line
The bear-trap thesis aged well: sentiment, positioning, ETFs, and G/S ratio have already clicked bullish.
Only equity-market stress is missing. A fast USD slide or a tariff shock right after a neutral Fed is the most likely detonator.
Stay nimble: Collect premium inside $3 250-3 400 while volatility sleeps – but keep alarms on VIX 25 and DXY 96. One red headline could still launch the squeeze.
Disclaimer: Educational opinion, not investment advice. Futures & CFD trading is risky – do your own research and consult a professional.
1 minute ago

Bear-Trap armed: Gold ticks 4 / 5 boxes - waiting for the spark
1️⃣ Why the 2020 déjà-vu is EVEN louder
2025 (now) 2020 (pre-rally)
TradingView ideas still bearish 💬
> 70 % 60 % bearish
Managed-money net-longs ≈ 115 k
(-35 % from Apr) –25 % from peak
+ $741 m PM-ETF inflow, first after months Record IN-flows
G/S ratio 87 (< 90) Fell to 95
S&P keeps making highs. Ditto
2️⃣ What’s still different
Real 10-y TIPS yield +0.7 % vs -1 % in 2020 → smaller monetary tail-wind.
Gold is already at an infl-adj. record – expect a short & sharp squeeze, not a fresh multi-year super-cycle (yet).
3️⃣ Checklist – updated
Signal Status 18 Jul Comment
———————————————————
Gold DAILY close ≥ $3 200–3 250 YES – $3 354 ✔
G/S ratio < 90 YES – 87 ✔
CFTC net-longs < 150 k YES – ~115 k ✔
ETF flows turn positive. YES – $741 m ✔
Equity stress (VIX > 25 or SPX −5 %) NOT YET – VIX 16.5 ✖
4 / 5 boxes = 99 % primed. One spark missing.
4️⃣ What could light the fuse
Date Potential trigger Why it matters
22 Jul Mega-tech Q2 earnings (NVDA/AMD) Any guidance miss → SPX wobble
30 Jul FOMC Fed holds but sounds dovish USD dump + yield spike risk
1 Aug Trump s “reciprocal” duties Imported-inflation scare → VIX pop
Early Aug. DXY crashes < 96 in < 5 days. Disorderly USD slide = funding stress
Hit ≥ 2 of: DXY < 96, VIX > 25, SPX -5 % or HY-spread +75 bp → final ✔.
Bottom line
The bear-trap thesis aged well: sentiment, positioning, ETFs, and G/S ratio have already clicked bullish.
Only equity-market stress is missing. A fast USD slide or a tariff shock right after a neutral Fed is the most likely detonator.
Stay nimble: Collect premium inside $3 250-3 400 while volatility sleeps – but keep alarms on VIX 25 and DXY 96. One red headline could still launch the squeeze.
Disclaimer: Educational opinion, not investment advice. Futures & CFD trading is risky – do your own research and consult a professional.

SPY/QQQ Plan Your Trade Special Update : BUCKLE UPThis video is a special update for all TradingView members. I felt I needed to share this information and present the case that I believe poses the most significant risk to your financial future - and it's happening right now.
Several weeks ago, I identified a very unique mirror setup in the SPY and kept an eye on how it was playing out. I needed to see confirmation of this setup before I could say it had any real likelihood of playing out as I expected.
As of today, I'm suggesting that we now have excellent confirmation that the US/Global markets are about to enter a deep consolidation phase, lasting through the rest of 2025 and possibly into 2026 and early 2027.
The interesting thing about this price pattern/structure is that it is almost exactly the same as the 2003-2007 structure, which I believe is the origin of this mirror setup. Almost down to the exact type of price bars/patterns I'm seeing.
Many of you are already aware that I've been calling for a critical low cycle in the SPY on July 18 for many months. What you may not realize is that the pattern is based on Weekly price data. The July 18 cycle low can have a span of +/- 1-3 weeks related to when and how the cycle low pattern plays out.
Watch this video. If you have any questions, message me or comment.
I'm still here, doing my best to identify and unlock the secrets of price action and to help as many traders as I can.
Price is the Ultimate Indicator.
Get some.
#trading #research #investing #tradingalgos #tradingsignals #cycles #fibonacci #elliotwave #modelingsystems #stocks #bitcoin #btcusd #cryptos #spy #gold #nq #investing #trading #spytrading #spymarket #tradingmarket #stockmarket #silver

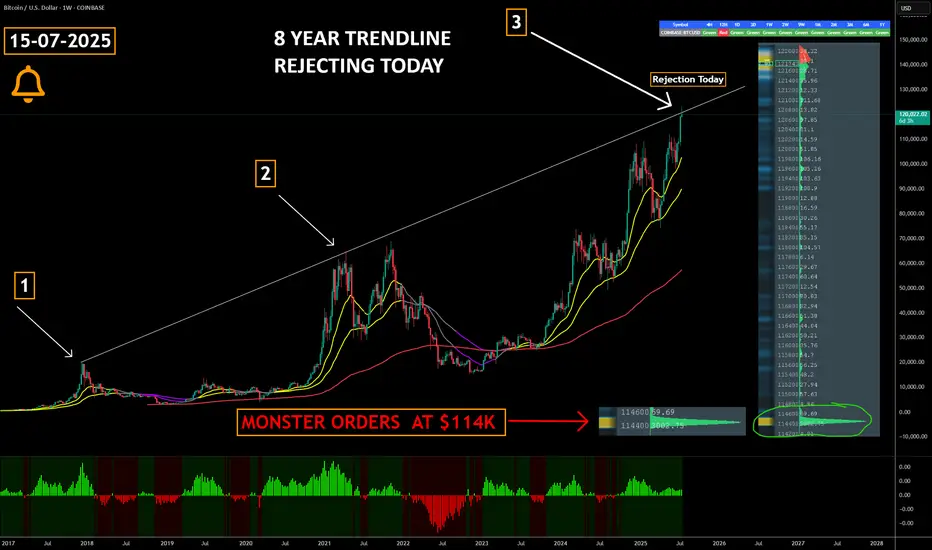
Did Bitcoin Just TOP OUT ??????
COINBASE:BTCUSD has just collided with an 8-year rising trendline that capped the market’s last two cyclical peaks—historically, this level has triggered multi-month corrections and Bear Markets.
Triple-test significance : a third touch of a long-term trendline ➜ heightened odds of a reaction; failure to break cleanly often confirms a major top.
Watch for confirmation signals —weekly bearish RSI divergence, waning volume, or rejection wicks can validate a reversal scenario.
Breakout = regime change : a decisive close and hold above the line flips it to support, opening the door to fresh price discovery and potential parabolic upside.
Large Orders at $114k create a visible demand wall in the order book, signalling that whales / institutions are ready to absorb a dip and accumulate at that level.
Risk-management alert : consider tightening stops, reducing leverage, or hedging until trendline fate is resolved.
The buy pressure has been relentless but this is always worth paying attention to
Marty Boots | 17-Year Trader — smash that , hit LIKE & SUBSCRIBE, and share your views in the comments below so we can make better trades & grow together!
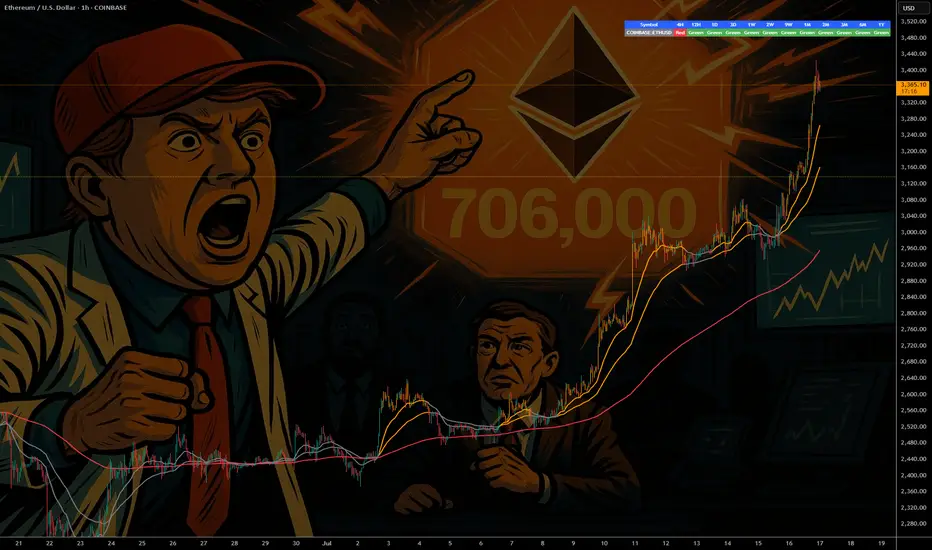
"Ethereum Is The New Bitcoin" - Tom Lee ETH / Stablecoins Are the ChatGPT of Crypto
Stablecoins are exploding in adoption — just like ChatGPT took over AI and Ethereum is the engine driving that revolution. In this post, we break down 10 reasons why Tom Lee is extremely bullish on Ethereum and why it could be the single most important digital asset in the future of finance . If you're sleeping on ETH, this might be your wake-up call.
Top 10 Bullish Points from Tom Lee on Ethereum:
• Ethereum is the backbone of stablecoins , which Tom Lee compares to the “ChatGPT of crypto” due to their viral adoption and massive utility.
• Over 51% of all stablecoins operate on Ethereum , contributing to around 30% of the network’s total fees.
• Ethereum network fees could 10x as stablecoin usage grows from $250 billion to $2 trillion.
• Ethereum is positioned to lead the tokenization of real-world assets , including stocks and real estate.
• ETH could reach $10,000 if asset tokenization becomes a mainstream financial practice.
• Ethereum has a regulatory edge in the U.S. , making it the preferred platform for compliant financial innovation.
• A $250 million ETH treasury strategy is underway , aiming to use Ethereum as a long-term reserve asset.
• Institutions will buy and stake ETH to secure stablecoin networks, making ETH the “next Bitcoin.”
• Ethereum dominates the crypto ecosystem , with nearly 60% of activity including DeFi, NFTs, and dApps built on its chain.
• HODL ETH for long-term growth , as its utility, demand, and institutional support continue to rise.
Conclusion:
Ethereum isn’t just a Layer 1 blockchain — it’s becoming the core financial infrastructure for the digital age . As stablecoins expand and institutions enter, ETH could be the most asymmetric opportunity in crypto right now.
📢 Drop a like, leave your thoughts in the comments, and don’t forget to follow for more powerful macro + crypto insights. 👍👍

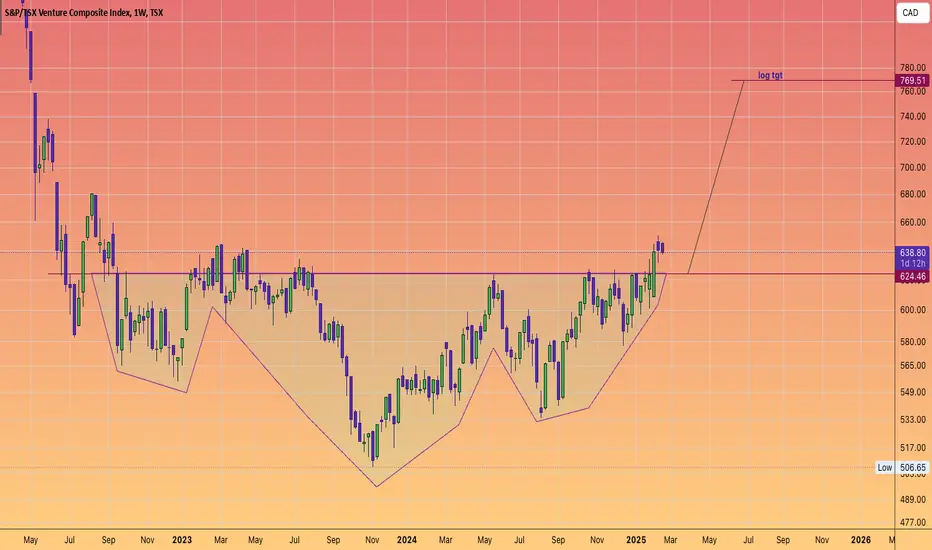
Canadian Venture index --- Inverse head & shouldersGold has reached unprecedented heights, approaching the $3000 mark—a prediction we made with precision. Now is the moment to turn our attention to silver and the mining sector.
To start, let's examine the Canadian venture index, which is displaying a promising inverse head and shoulders pattern. I am confident that the logarithmic projection will be achieved without much difficulty.
Gold/Silver Ratio to 72 Minimum - Imminent Silver BreakoutGoldSilver Ratio is following a clear pattern of behavior. We can expect a return to mean conservatively hitting 72 at a minimum. This puts silver at $46-58 if Gold doesn't move higher. I think we will see silver 5-10X over the next few years. Easy 25-50% in the short term (6-12 months).
SPY/QQQ Plan Your Trade End Of Week Update For 7-4Happy 4th of July
I've been very busy with projects and new tools for traders, as well as the new book I'm working on, and thought I would deliver an End Of Week update for everyone.
In this video, I cover the past Cycle Patterns and how they played out for the SPY/QQQ, Gold/Silver, and Bitcoin, as well as add some of my own insight related to the market trends.
All of my systems are still LONG and have not changed. I still believe this market is extremely overbought, and I believe it could roll over at any moment into a pullback - but we need to wait to see if/when that may/does happen.
Gold made a big move higher this week, and I believe that move could continue throughout July.
Bitcoin made a surprising Double-Top and is not rolling downward. Could be a breakdown in the markets as BTCUSD tends to lead the QQQ/NQ by about 3-5 days.
The SPY/QQQ rallied like a rocket all week. It was absolutely incredible to see the markets rally like this. But, I'm still cautious of a sudden rollover top.
I managed to catch some nice trades with options spreads this week, and my metals positions were on fire. I'm still trading from a "hedge everything" mode as I don't trust this rally, and I'm still watching for REJECTIONS near these new highs.
Stay safe and GET SOME.
DM me if you have any questions.
#trading #research #investing #tradingalgos #tradingsignals #cycles #fibonacci #elliotwave #modelingsystems #stocks #bitcoin #btcusd #cryptos #spy #gold #nq #investing #trading #spytrading #spymarket #tradingmarket #stockmarket #silver
