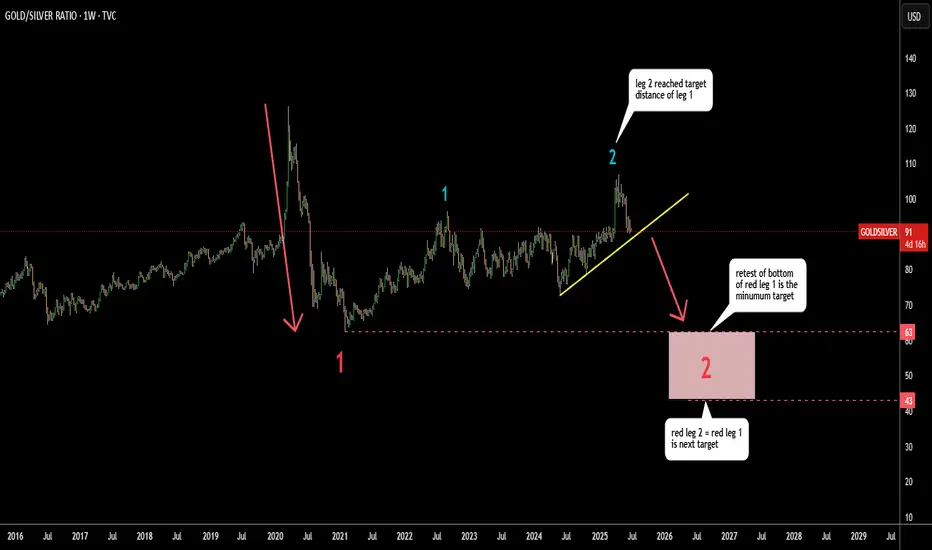
GOLD/SIlver Ratio Signals Risk On Gold/Silver ratio represents the appetite for risk
Stronger gold means risk off and vice versa
In spring, the ratio had hit the target for leg 2 (blue) within
large consolidation that took over 4 years to emerge
It travelled the equal distance of leg 1 (blue) and then reversed.
The next step might be the continuation to the downside for the ratio.
The minimum target is to hit the bottom of red leg 1 at 63.
The next target is located at the distance of the red leg 1 subtracted from the peak of blue leg 2. It was set at 43.
Both downside targets are within historical range.
Gold/Copper ratio shows same dynamics of "Risk-On" attitude on the market.
GOLD-SILVER
STEEL-NERVE SETUP – ARE WE RE-LIVING GOLD’S 2020 BEAR-TRAP?Retail sentiment is ultra-bearish, positioning is cooling, Silver is outperforming and the S&P 500 is screaming risk-on … exactly the cocktail we saw in June 2020, right before Gold & Silver exploded higher.
1️⃣ WHY THIS FEELS LIKE 2020 AGAIN
2025 (now) 2020 (pre-rally) Read-through
> 70 % of TradingView ideas are bearish 💬 > 60 % were bearish Crowd may be offsides again
Managed-money net-longs -18 % from April peak 📉 -25 % from March peak Powder for fresh longs
First monthly ETF outflow (-$1.8 bn) 🚪 Record inflows Capitulation, not euphoria
Gold/Silver ratio down to 94 ⚖️ Fell to 95 Silver leadership = bottoming tell
S&P 500 at new ATH 📈 S&P at new ATH Risk-on backdrop identical
2️⃣ WHAT’S DIFFERENT THIS TIME
Real 10-y TIPS yield +0.7 % (2020: -1 %) → smaller monetary tail-wind.
Gold already at inflation-adjusted ATH → upside could be shorter & sharper, not a fresh super-cycle (yet).
3️⃣ CHECKLIST FOR A REAL BEAR-TRAP
Signal Watch-level
Gold holds $3 200–3 250 (100-d SMA + fib) Daily close above zone
Gold/Silver ratio breaks < 90 Momentum confirmation
CFTC net-longs < 150 k Position flush
ETF flows turn positive Fear → FOMO
S&P stumbles / vols spike Classic risk-bid for Gold
Need 3 of 5 boxes ticked to validate the squeeze thesis.
4️⃣ CATALYST CALENDAR
3 Jul – NFP: sub-75 k print could fire the opening salvo.
9 Jul – Tariff freeze decision: escalation would revive safe-haven demand.
15 Jul – CPI & 30-31 Jul – FOMC: dovish turn + soft data could complete the squeeze.
Disclaimer: This post reflects my personal opinion for educational purposes only; it is not financial advice. Trading futures and commodities involves substantial risk and can lead to total loss of capital—do your own research (DYOR) and consult a qualified professional before acting.

SPY/QQQ Plan Your Trade for 6-25 : Breakaway PatternToday's Breakaway pattern suggests the SPY/QQQ may attempt to move into another breakaway price move - very similar to yesterday's price move.
I will add that I believe the SPY cycle patterns have already moved through a breakaway phase with the ceasefire news early this week. I believe the gap and breakaway move yesterday may be the breakaway trend we are expecting today.
That would suggest the markets could pause and pullback a bit over the next few days.
Gold and Silver are trying to find a bottom after the brief selling that took place over the past few days. I really do believe Gold and Silver are poised to make a big move higher.
Bitcoin is on a terror to the upside. But be cautious of the downward cycle channel that may prompt a rollover in BTCUSD near the $107,500 level.
I spend a little time near the end of this video highlighting my work on the Tesla 3-6-9 price theory and going over a few examples for my new book on trading.
Enjoy the quick look at some of the more advanced techniques I'm working to unlock for all of you.
Get some.
#trading #research #investing #tradingalgos #tradingsignals #cycles #fibonacci #elliotwave #modelingsystems #stocks #bitcoin #btcusd #cryptos #spy #gold #nq #investing #trading #spytrading #spymarket #tradingmarket #stockmarket #silver

SPY/QQQ Plan Your Trade For 6-24 : Post Market UpdateThis post-market update highlights the weakening volume while my primary proprietary modeling system continues to stay BULLISH.
The markets are really quite interesting right now. Weakening volume in this Gapping uptrend, today, suggests traders are not buying into the ceasefire between Iran and Israel.
Additionally, the move in metals suggests a PANIC phase has setup in the US markets.
This type of panic phase typically leads to selling of assets and moving capital into CASH.
I suggest traders continue to prepare for a moderate melt upward trend over the next few days - but be prepared for any potential breakdown (possibly trying to FILL THE GAP).
This market appears to be running on fumes.
While I believe Trump's policies will lead to a stronger bullish price trend over the next few years, these disruptions and the potential for consumers to pull away from spending/economic activity over the second half of 2025 is still very real.
Buckle up.
At this point, hedge your trades, move some capital into CASH and prepare for bigger price volatility as we move into July 2025.
Get some.
#trading #research #investing #tradingalgos #tradingsignals #cycles #fibonacci #elliotwave #modelingsystems #stocks #bitcoin #btcusd #cryptos #spy #gold #nq #investing #trading #spytrading #spymarket #tradingmarket #stockmarket #silver

SPY/QQQ Plan Your Trade For 6-23 : Afternoon UpdateWhat happened to the CRUSH pattern?
Everyone wants to know why the CRUSH pattern didn't show up today. Well, I keep telling all of you these SPY Cycle Patterns are based on GANN, Tesla and Fibonacci price structures. They do not take into consideration news, global events, or anything outside of PRICE.
They are predictive - meaning they attempt to predict potential price shapes/patterns weeks, months, and years in advance.
The markets, obviously, are seeking some normalcy after the Iran conflict. I thought the CRUSH pattern would have been a perfect fit for today - but obviously the markets didn't agree.
If you have been following my videos, you know I keep saying the US stock market is acting as a global hedge for risks. Traders are pouring capital into the US stock market as a way to avoid global risk factors.
Traders are also pouring capital into Gold/Silver. Demand for physical metals is through the roof right now.
Time will tell if my Excess Phase Peak pattern plays out as I expect or if we rally to new ATHs.
Obviously, this sideways rollover topping pattern could present a breakaway in either direction.
Again, my patterns are not correlated based on news or other events. They are strictly price-based.
Get some...
#trading #research #investing #tradingalgos #tradingsignals #cycles #fibonacci #elliotwave #modelingsystems #stocks #bitcoin #btcusd #cryptos #spy #gold #nq #investing #trading #spytrading #spymarket #tradingmarket #stockmarket #silver

SPY/QQQ Plan Your Trade For 6-23 : CRUSH PatternToday's CRUSH pattern suggests the markets will struggle to find any support for a rally. A CRUSH pattern is usually a large breakdown type of price bar that moves aggressively against the dominant trend.
Som, today I'm expecting some fairly large price action and I believe the markets may start a breakdown move this week as we continue to get more news related to the Israel/Iran/US conflict.
This week will be a "resettling" week in my opinion. Buyers will start to actively liquidate and reposition assets as we move deeper into this conflict. When buyers turn into sellers (to get out), the markets usually react very aggressively in trend.
Metals continue to hold up without making any big moves. I believe the increased FEAR level could play out as a moderate rally for metals over the next 15-30+ days.
BTCUSD broke down very hard (more than 6%) over the past 3-4+ days. This is a big move downward for Bitcoin and could suggest US technology stocks/sectors could also collapse on fear of a "rollover top" in the US stock market.
Smart traders will hedge and pull capital away from this potential top - just like I've been suggesting for the past 2-3+ weeks.
Oddly enough, if we do get a rollover/top this week because of the Iran conflict, it plays right into my Excess Phase Peak pattern and the predictions I've been making over the past 4+ months.
No, I don't foresee events like this Israel/US/Iran conflict. I can't see into the future.
What I can do, and continue to try to deliver, is the best analysis I can offer without becoming BIASED by indicators, comments, or other inputs.
I just read the chart and will tell you what I see as the most likely outcome.
Get some..
#trading #research #investing #tradingalgos #tradingsignals #cycles #fibonacci #elliotwave #modelingsystems #stocks #bitcoin #btcusd #cryptos #spy #gold #nq #investing #trading #spytrading #spymarket #tradingmarket #stockmarket #silver

Middle East Tension & Markets: My Honest Stance🌍🕊️✌️ Middle East Tension & Markets: My Honest Stance 💣 🔥 🗡️
Hi everyone,
It’s Friday, June 20th — and we face a fragile moment: the uncertainty of possible US military action against Iran. 📉📰✈️
On my charts:
Bitcoin (BTC) reached key resistance and now ranges sideways as we await clarity.
Gold (XAUUSD) remains the classic safe haven — it holds an ascending structure, but profit-taking could trigger dips if markets crash.
Silver (XAGUSD) is similar, yet needs broader industrial strength to outperform gold.
Crude Oil (WTI) could spike dramatically if bombs fall — but I choose not to profit from pain.
USDJPY & USD pairs reflect global trust in the dollar and US stability — I’ll cover this more next week.
My personal stance is simple:
💙 I never short disasters. I never profit from human suffering. I am LONG on humanity and peace. 🕊️✌️🌈
👉 I expect potential market gaps between now and Monday:
✅ Bad news (war) → gold, silver, oil likely pump
✅ Good news (diplomacy) → risk assets rebound, oil stabilizes
I am positioned carefully with small risk and clear stops. My goal: protect my capital, trade my plan, but never bet on pain. If I lose because peace prevails — I win as a human.
Stay safe, trade wisely, and never forget: sometimes the best trade is no trade at all.
One Love,
The FXPROFESSOR 💙
Disclosure: I am happy to be part of the Trade Nation's Influencer program and receive a monthly fee for using their TradingView charts in my analysis. Awesome broker, where the trader really comes first! 🌟🤝📈

SPY/QQQ Plan Your Trade For 6-20 : Pause Bar PatternToday's Pause Bar pattern suggests the SPY/QQQ will slide into a sideways type of PAUSE in price action today. I'm not expecting much to happen and if we do see any breakaway or breakdown trending it will likely be related to news.
While we have options expiration today and a host of other things that could drive the markets, I believe the markets are struggling to find direction right now. Thus, a pause in trading would be somewhat normal after a holiday-shortened trading week.
Gold and Silver are struggling after a brief rally last week. I believe this is fear related to the Israel/Iran conflict. Metals should continue to move higher.
BTCUSD is slightly higher (forgot to cover BTCUSD in the video), but not moving into a breakaway phase.
Overall, everything is very flat in early trading today. It may stay that way with my PAUSE BAR pattern.
Get some.
#trading #research #investing #tradingalgos #tradingsignals #cycles #fibonacci #elliotwave #modelingsystems #stocks #bitcoin #btcusd #cryptos #spy #gold #nq #investing #trading #spytrading #spymarket #tradingmarket #stockmarket #silver

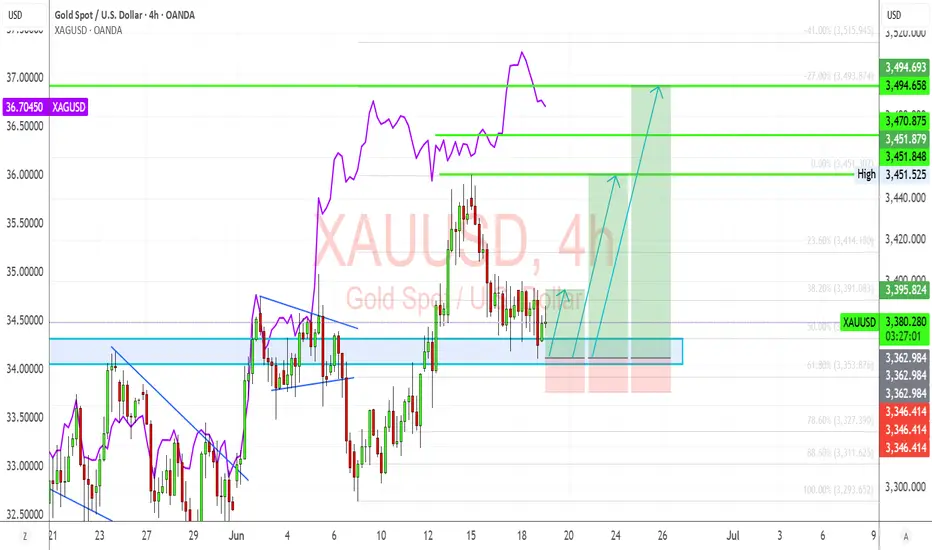
Gold Ready to Shine Again? Watch This Battle Zone Closely!Gold is consolidating above the 50% retracement (3372) after defending key structure at 3368–3378. Bullish momentum is building as Silver continues to lead, and the US Dollar (DXY) weakens post-FOMC. If buyers step in here, we could see a clean breakout toward 3415–3450 and beyond. But if 3368 breaks, the bull case is temporarily invalidated.
🧭 Technical Highlights:
✅ Support Zone: 3368–3378 (Fibonacci + bullish order block)
✅ Resistance Targets: 3395, 3415.84, 3451.84, 3470+
🔄 Silver Divergence: XAGUSD broke higher → leading XAU bullishly
🔼 Bias: Bullish (as long as 3368 holds)
🌐 Fundamental Drivers:
🏦 Fed dot plot turns dovish – Only 1–2 cuts, but no hikes planned; supports gold upside.
⚔️ Middle East tensions rising – Iran vs. Israel/US rhetoric keeps risk premium high.
📉 DXY weakens after Powell avoided hawkish tone; real yields remain capped.
💬 Silver outperforming on safe-haven + industrial hedge flows.
💡 Trading Plan Summary:
Buy Zone: 3372–3380
TP Zones: 3395, 3415, 3450+
Invalidation: Close below 3368
Confirmation: Break and close above 3395 with volume = signal to scale in
🔔 Keep an eye on:
US Jobless Claims, SNB & BoE Decisions
DXY 98.70 key level
Silver reaction near 36.70–37.20
SPY/QQQ Plan Your Trade For 6-19: GAP Reversal Counter TrendToday's pattern is a GAP Reversal in Counter Trend mode. I believe this could represent a breakdown in the ES/NQ as the US stock market is closed for the Juneteenth holiday.
Obviously, after the Fed comments yesterday (stating "uncertainty") and with the continued Israel/Iran conflict playing out, it makes sense to me that the US markets would move into a pre-weekend consolidation phase.
Even though the US stock market will be closed, the futures market will likely stay open and will carry some general market sentiment and reactions to news.
Watching Gold/Silver and Bitcoin should be very interesting today. I suspect the markets will continue to consolidate downward today - leading to a potential breakdown seeking support day on Friday.
Buckle up. We'll likely have 3-5+ days of news related to the Israel/Iran conflict and other issues over this weekend. It could be very interesting to see how the global markets move through this news.
Get some.
Happy Juneteenth
#trading #research #investing #tradingalgos #tradingsignals #cycles #fibonacci #elliotwave #modelingsystems #stocks #bitcoin #btcusd #cryptos #spy #gold #nq #investing #trading #spytrading #spymarket #tradingmarket #stockmarket #silver

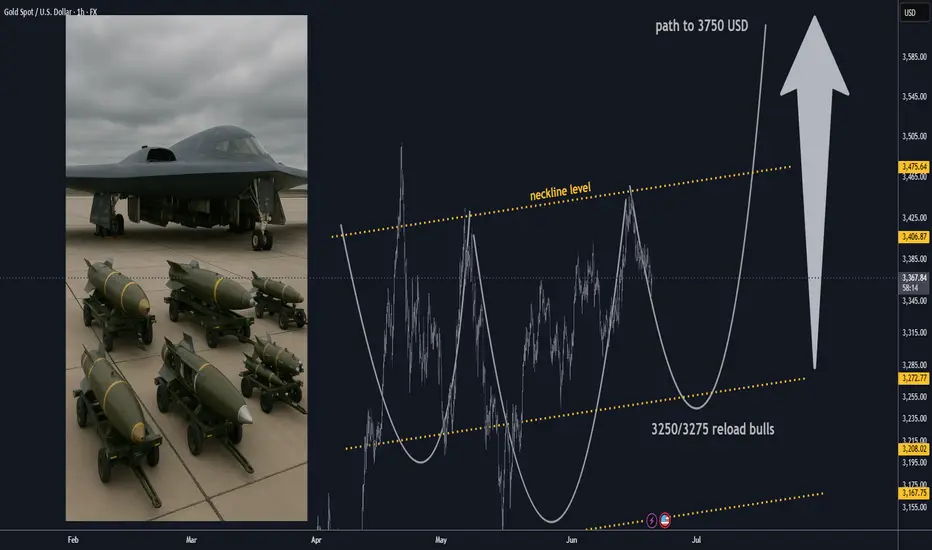
Gold Market Update: Bulls Will target 3750 USD after 3500 USD🏆 Gold Market Mid-Term Update (June 19, 2025)
📊 Price & Technical Outlook
Current Spot Price: ~$3,365
Technical Setup
Inverted H&S pattern forming/completed on higher timeframes — confirms bullish reversal structure.
Reload (buy) zone: $3,250–$3,275 (ideal accumulation range for bulls if price pulls back).
Swing trade setup: Entry: $3,250–$3,275 (reload zone)
Take Profit (TP): $3,750
Support: Major at $3,250–$3,275 (break below = reassess bullish bias).
Resistance: $3,450–$3,500 ; next major resistance: $3,600, then $3,750.
Price consolidating above $3,250–$3,350 is technically healthy — maintaining bullish structure.
🏆 Bull Market Overview
The pullback appears complete; uptrend resumes amid strong macro/geopolitical drivers (inflation, rates, safe haven flows).
Key Levels: $3,000 (macro support), $3,250 (bulls must defend), $3,500 (breakout zone), $3,750 (swing TP).
Short-term dips = buying opportunities — “Buy the Dip” remains favored as long as support holds. Upside targets: Immediate: $3,600 Swing target: $3,750
Summary:
Gold remains in a bullish mid-term structure, with the inverted H&S pattern pointing to higher prices ahead. Bulls look to reload at $3,250–$3,275, targeting $3,750 for swing trades. As long as $3,180–$3,200 holds, buying dips is the play. A sustained breakout above $3,400–$3,600 opens the door for new all-time highs.
SPY/QQQ Plan Your Trade For 6-18 : GAP Potential PatternToday's GAP Potential pattern suggests the SPY/QQQ may GAP a bit higher at the open, then move into a melt-up phase, trying to identify resistance, then roll into a topping pattern and move downward.
I believe the recent "rollover" of the markets (initiating last Friday with the Israel/Iran conflict) is still dominating the markets and news related to the ongoing conflict could drive a moderate pullback in US assets.
Headed into the Juneteenth holiday (Thursday, June 19), I suggest traders prepare for the US markets to move into somewhat of a SETTLEMENT mode today - where traders don't want to hold too many open positions into Friday's trading.
Additionally, Gold and Silver could move into a very strong upward price move over the next 4-5+ days. So be prepared for metals to hedge risks when the US stock market is closed.
BTCUSD seems to be struggling into the FLAG APEX. I'm waiting to see if my FLAG count is correct and if we get the breakdown in BTCUSD as I expect.
Get some.
#trading #research #investing #tradingalgos #tradingsignals #cycles #fibonacci #elliotwave #modelingsystems #stocks #bitcoin #btcusd #cryptos #spy #gold #nq #investing #trading #spytrading #spymarket #tradingmarket #stockmarket #silver

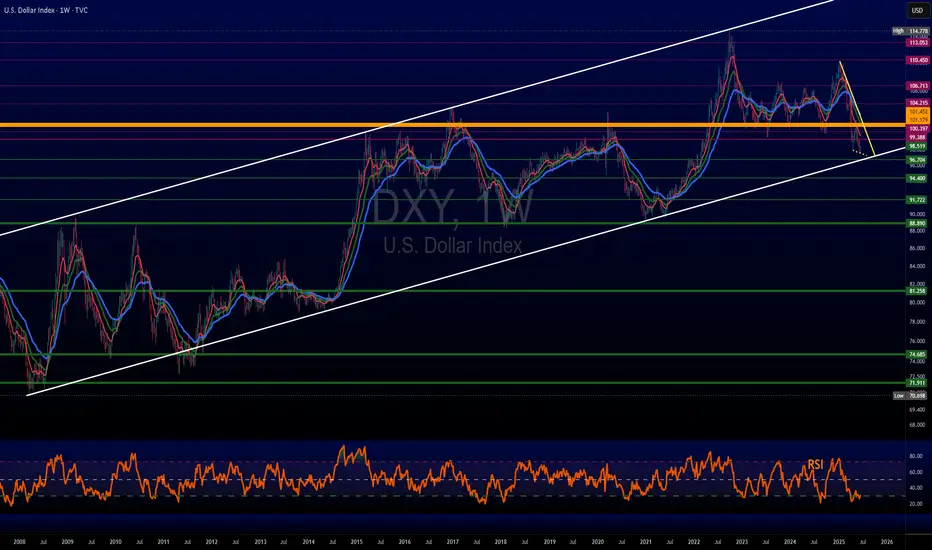
$DXY Dollar stays weak but is it bottommed?Have not many ANY trades based on the US Dollar. Have not been convinced in either way, yet.
TVC:DXY has been weaker lately but not by much. Well, at least compared to its previous low.
However, LONGER TERM we see it's biz as usual.
It is currently fairly oversold on the weekly chart & could be primed to change direction.
SPY/QQQ Plan Your Trade for 6-17: Top Resistance PatternToday's pattern suggests the SPY/QQQ will move into a type of topping pattern, attempting to identify resistance, then roll away from that resistance level and trend downward.
I suggest the news related to the conflict between Israel & Iran may continue to drive market trends with traders moving away from uncertainty near these recent highs.
Silver makes a big move higher. Gold will likely follow later this week or early next week.
BTCUSD moves into a sideways FLAGGING pattern - possibly attempting a BIG BREAKDOWN event over the next few weeks.
Overall, the markets look like they are poised for a very big move - just waiting for the GREEN LINK (GO).
Stay safe. Protect capital and HEDGE.
Get some.
#trading #research #investing #tradingalgos #tradingsignals #cycles #fibonacci #elliotwave #modelingsystems #stocks #bitcoin #btcusd #cryptos #spy #gold #nq #investing #trading #spytrading #spymarket #tradingmarket #stockmarket #silver

SPY/QQQ Plan Your Trade For 6-16 : Up-Down-Up PatternToday's Up-Down-Up Pattern suggests the markets will transition into a moderate upward trending price bar - which is quite interesting in the world we have today.
War and a big weekend of events, protests and other new items could drive market trends over the next few days.
Still, the SPY Cycle Pattern for today is an Up-Down-Up - which suggests last Thursday was an Up bar, last Friday was a Down bar, and today should be an Up bar.
The Gold/Silver pattern is a POP pattern in Counter-trend.
I believe the US markets are benefiting as a safe-haven for capital as the global turmoil drives global investors to seek safety and security for their capital.
That means as long as the world continues to spin out of control, the US markets and the US-Dollar will act as a moderate safe-haven for capital.
Gold and Silver should also benefit from this global chaos.
Bitcoin is benefiting from the strength of the US markets (and the technology sector) as well.
Let's see how this week start to play out. I'm waiting for some more news.
Could be very interesting this week.
Get some.
#trading #research #investing #tradingalgos #tradingsignals #cycles #fibonacci #elliotwave #modelingsystems #stocks #bitcoin #btcusd #cryptos #spy #gold #nq #investing #trading #spytrading #spymarket #tradingmarket #stockmarket #silver

Atleast 3x your moneyAlright, this is getting set to fly high now. Catching with gold and other commodities. All the best !!

SPY/QQQ Plan Your Trade For 6-13 : Harami-Inside PatternToday's pattern suggests the markets may stall into a sideways price range.
After the news of Israel targeting Iran in a preemptive strike late yesterday afternoon, the markets moved dramatically lower while Gold & Silver moved higher on the news.
I, personally, see this market trend as a shift in thinking ahead of a long Father's Day weekend.
I see traders trying to position their accounts/trades for uncertainty.
I believe we could see a bit of a shift today - particularly in Metals and the QQQ/NASDAQ/BTCUSD.
Overall, I strongly suggest traders prepare for extreme volatility this weekend as any further news of a counter-strike or further military action in the Middle East could roil the markets.
Happy Friday the 13th - everyone.
Going to be an interesting day to say the least.
Get some.
#trading #research #investing #tradingalgos #tradingsignals #cycles #fibonacci #elliotwave #modelingsystems #stocks #bitcoin #btcusd #cryptos #spy #gold #nq #investing #trading #spytrading #spymarket #tradingmarket #stockmarket #silver

SPY/QQQ Plan Your Trade For 6-12: BaseRally In Trend ModeToday's pattern suggests the markets may attempt to identify a base and move higher (rally) off that base level.
Given the overnight price activity, I suggest the process of identifying the base level could prompt a deeper early decline in price - possibly attempting to retest 595-597 lows before finding support and attempting to rally.
As I've been warning over the past few weeks/months, I'm still seeing the Excess Phase Peak pattern playing out as a Flag Termination - rolling into a downtrend and attempting to move back towards the $480 lows as a real possibility. I've been warning and watching for the breakdown in trend - but we've not seen it yet.
Thus, we are still BULLISH until we get a confirmation of a solid breakdown. That would be a move below the 580-585 level at this point. We need to see some type of solid breakdown in price, breaking away from the FLAG setup and moving downward, before I could confidently suggest the Flag Breakdown has happened.
Gold and Silver are making a big move higher. Gold is finally starting to move back above $3400 and I believe watching Silver, Gold, & Platinum rally suggests FEAR is elevating as we move into the end of June.
I still believe Gold has a chance to rally above $4k before the end of June. We'll see if it happens.
BTCUSD is moving into a DUAL-EPP pattern. This is very interesting. Watch the video as I highlight why this could prompt a dual-stage EPP breakdown in Bitcoin over the next 20 to 50+ days.
Get some.
#trading #research #investing #tradingalgos #tradingsignals #cycles #fibonacci #elliotwave #modelingsystems #stocks #bitcoin #btcusd #cryptos #spy #gold #nq #investing #trading #spytrading #spymarket #tradingmarket #stockmarket #silver

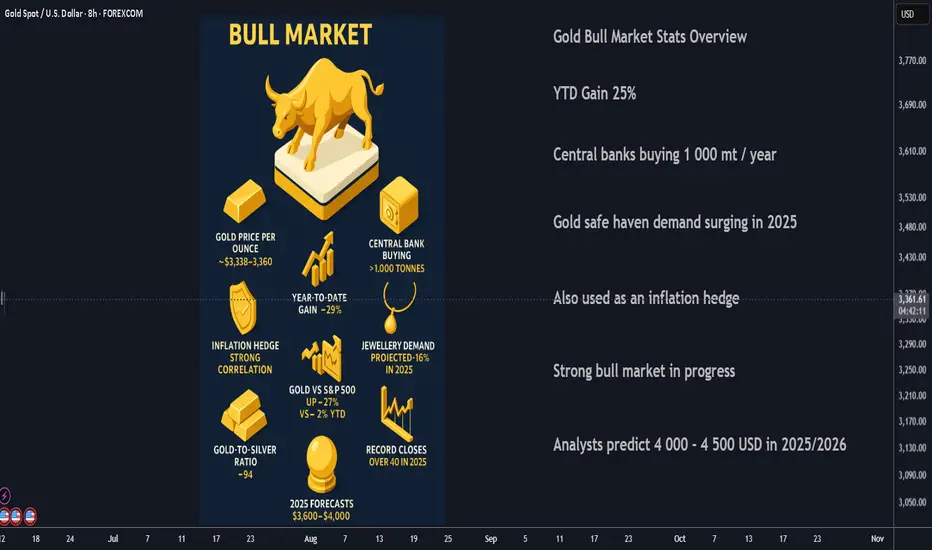
TOP 10 Stats of the Current Gold Bull Market in 2025 and Outlook📊 Top 10 Stats of the Current Gold Bull Market (2025)
1. 🥇 Gold price per ounce: Around $3,338–$3,364, with a recent all-time high above $3,500 in April 2025
2. 📈 Year-to-date gain: About +29% in 2025 so far, after a +30% gain in 2024
3. 🏦 Central bank buying: More than 1,000 tonnes bought for the fourth straight year, reserves near record levels
4. 🔒 Inflation hedge: Strong inverse correlation with real yields; high demand driven by inflation and geopolitical worries
5. 📊 Gold vs S&P 500: Both reached new highs together; gold is up about 27% YTD while the S&P 500 is up only around 2%
6. 💍 Jewellery demand: Global gold jewelry demand is down about 9% in 2024, projected to drop another 16% in 2025 due to high prices
7. ⚖️ Gold-to-silver ratio: Now around 94, down from a peak of 105—showing silver is regaining ground
8. 🏅 Record closes: More than 40 record daily closes for gold in 2025, prices consolidating around $3,290–$3,400
9. 🏛️ Technical breakout: Broke out of a 13-year “cup-and-handle” technical pattern in March 2024
10. 🔮 2025 forecasts: Predictions range from $3,600–$4,000 by Q2 2026, with some expecting as high as $4,500 if risks rise
________________________________________
🔄 How This Gold Bull Market Compares to Past Bull Markets
1️⃣ 1968–1980 Super Bull
• 🕰️ Gold climbed from ~$35 to ~$850, a massive 2,330% gain over 12 years
• 🔥 Driven by double-digit inflation, end of the gold standard, and political turmoil
• ⚠️ Huge corrections, including a nearly 45% drop in 1974–76, but rapid rebounds
2️⃣ 1999–2008 Bull Market
• 💹 Gold surged from ~$252 to ~$1,023 (about +305%) in 9 years
• 🚀 Fueled by the commodities supercycle and concerns about global imbalances
• 📉 Big correction during the 2008 financial crisis, but gold rebounded fast
3️⃣ 2018–2025 (Current Cycle)
• ⏳ Gold broke out in 2024 from a 13-year sideways base
• 💥 Up nearly 200% from the 2018 lows to over $3,500
• 🏦 Central banks are the biggest buyers, unlike earlier cycles
• 🛡️ Corrections have been milder—2022 saw only a 20% drop
• 🏃♂️ Fast recovery: new highs reached within months, not years
________________________________________
📊 Quick Comparison Table
Metric 1968–80 Super Bull 1999–2008 Bull 2018–2025 Current
🚀 Total Gain ~2,330% ~305% ~200% so far
⏲️ Length 12 years 9 years 7 years so far
💔 Biggest Drawdown –45% (1974–76) –30% (2008) –20% (2022)
🏦 Central Bank Role Moderate Emerging Dominant
📉 Correction Speed Years to recover 4 years Months
🏛️ Technical Pattern Secular breakout Multiple peaks Broke 13-yr base
________________________________________
🧭 What Makes the Current Bull Market Unique
• 🏦 Central banks are setting the pace with record-breaking demand
• 🩹 Corrections are less severe and recoveries are quicker
• 📈 Gold is rallying alongside stocks, which is rare historically
• 🏛️ The breakout from a 13-year consolidation signals strong structural support
• 🔮 Major forecasts predict further highs through 2026, suggesting this may become one of the strongest cycles ever
SPY/QQQ Plan Your Trade For 6-11: Bottom-Base Rally Counter TrndToday's counter-trend Bottom-Base Rally pattern suggests the markets may attempt to find a peak and roll over into a downtrend.
The normal Bottom-Base Rally pattern is similar to the start of a moderate price base/bottom, then moving into a moderate rally phase.
In counter-trend mode this pattern would be inverted - forming a Top and then moving into a downward price trend.
I've been warning of the potential of a rollover top type of pattern in the SPY over the past few weeks - but it never really setup/confirmed.
I'll be curious to see if this counter-trend pattern, today, sets up some type of big top formation in the SPY/QQQ. It might be related to news as well.
Gold and Silver have a Gap-Stall-Revert-FLUSH pattern. This is always an interesting pattern because is suggests price is going to attempt to either gap and trend or stall and revert. My guess is we are looking at more trending in metals today.
Platinum is RIPPING higher (PL1!). Because of this, I believe Silver and Gold will attempt to follow Platinum and move to the upside today.
BTCUSD is stalling a bit. We'll see if we get any big price move in Bitcoin today. After the big rally over the past few days, it will be interesting to see if BTCUSD reverts downward or continues higher.
Overall, today's patterns suggest the markets are seeking direction. Get ready for an exciting day in the markets.
Get some.
#trading #research #investing #tradingalgos #tradingsignals #cycles #fibonacci #elliotwave #modelingsystems #stocks #bitcoin #btcusd #cryptos #spy #gold #nq #investing #trading #spytrading #spymarket #tradingmarket #stockmarket #silver

Platinum 10 years accumulation 2 000 USD Overview of Catalysts
Here’s a detailed look at the top 10 key catalysts influencing platinum prices—and how they stack up on a 0–10 impact scale 🎯.
1. Supply Deficits (Mining Shortfalls) ⛏️
Trend: Persistent structural deficits—the largest since 2013—with a projected deficit of \~598 koz in 2024.
Drivers: Declining output in South Africa and Russia, underinvestment, and aging mines.
Impact Score: 10/10 – Direct upward pressure on price.
2. Industrial Demand & Green-Energy Growth 🏭
Trend: Industrial consumption is booming, with strong growth in sectors like wind turbines, glass, and electronics.
Support: This broad demand fuels a large part of the supply deficit, and goes well beyond automotive use.
Impact Score: 9/10 – Strong structural support.
3. Auto Catalyst Substitution (Pd → Pt) 🔄
Trend: Cost-effective substitution as platinum approaches price parity with palladium; significant volume was substituted in 2023, with more projected for 2024.
Significance: Boosts automotive demand in an area previously dominated by palladium.
Impact Score: 8/10.
4. Electric Vehicle Adoption (EVs) ⚡
Trend: EVs don’t use platinum in catalytic converters, which is a structural hit to demand as EV growth continues.
Significance: Long-term downside pressure.
Impact Score: 7/10.
5. Hydrogen Fuel Cell Demand 💧
Trend: Hydrogen vehicles use platinum, with projected demand growth toward 2030.
Limitations: Growth remains slower than battery EVs.
Impact Score: 6/10.
6. Recycling Constraints 🔄
Trend: Recycling, which provides about a quarter of supply, is falling due to fewer end-of-life vehicles and glass, reducing the supply buffer.
Market Effect: This amplifies supply tightness.
Impact Score: 6/10.
7. Chinese Emission Policies 🏭
Trend: China’s tightening emissions regulations are supporting demand, with end uses well protected against a slowdown.
Importance: China is the largest platinum user; policy gives stability.
Impact Score: 7/10.
8. Jewellery & Investment Trends 💍
Trend: Jewellery demand remains steady, and investment demand is rising.
Note: This is a smaller demand segment, but it is supportive.
Impact Score: 5/10.
9. Macroeconomic & Auto Production Outlook 📉
Trend: Weak global auto production is lowering platinum use, but recovery in auto could lift demand.
Aftermath: Economic rebound could support prices.
Impact Score:** 5/10.
10. Speculative Sentiment & Positioning 📈
Trend: Inventories are depleted; investors are waiting for a breakout.
Tipping Point: A price surge could spark momentum-driven demand.
Impact Score:** 4/10.
| Rank | Catalyst | Score (/10) |
| ---- | ---------------------------------- | ----------- |
| 1 | Supply Deficit | 10 |
| 2 | Industrial / Green-Energy Demand | 9 |
| 3 | Auto Catalyst Pd → Pt Substitution | 8 |
| 4 | EV Adoption (Negative Impact) | 7 |
| 5 | Chinese Emission Policies | 7 |
| 6 | Hydrogen Fuel Cell Growth | 6 |
| 7 | Recycling Constraints | 6 |
| 8 | Jewellery & Investment Demand | 5 |
| 9 | Macro Slowdowns / Auto Production | 5 |
| 10 | Speculative Positioning | 4 |
📌 Key Insights & Outlook
* Tight supply and diversified demand—especially from green energy and industrial sectors—are the strongest bullish forces for platinum.
* Auto-driven substitution offers further upside, while EV growth and recycling limitations act as constraints.
* Chinese regulations add resilience; hydrogen offers potential if growth accelerates.
* Jewellery and investment flows remain minor but supportive.
* Much depends on auto sector recovery and investor psychology—momentum effects could amplify gains if technical levels break.
🔮 Final Take
Platinum remains positioned for medium-term strength, thanks to severe supply tightness and robust non-auto demand drivers. For investors, key areas to watch are further deficits, industrial trends, and catalytic substitution. Be mindful of potential headwinds from EV adoption and macroeconomic softness, but the structural case remains compelling.

SPY/QQQ Plan Your Trade For 6-10 : POP PatternToday's POP pattern suggests a potential big price move will take place. Given the overnight activity on the ES (rallying higher then rolling over), I suggest today's price move may attempt to retest these overnight highs, then repeat the breakdown phase into the close.
The markets continue to try to melt upward. This trend will continue until the markets decide to break downward.
After the deep low created by the tariff news, the markets continue to try to rally to new highs. It is very likely that Q2 earnings data may push the SPY to new ATH levels before we see any big rotation in price.
The markets have a tendency to move just above recent highs, then stall and revert downward as a pullback. This move may be no different.
The continued stalling of price trying to move higher recently suggests the markets are running into moderate resistance and I believe traders are actively pulling capital away from this rally.
The trend is still BULLISH. Stay cautious of this upward move as a breakdown could happen at any time.
Gold and Silver are moving into an impressive rally phase. Silver and Platinum have moved considerably higher over the past 10+ days. I believe Gold is lagging and will make a big move higher over the next 5 to 10+ days.
Silver is targeting $41-44+. Gold should target $3400 to $3500+ near the same time.
Bitcoin made a huge rally yesterday - reaching my 110,500 upper resistance level. Now, we see if Bitcoin has the momentum to carry higher or if it will fail and rollover into a downtrend.
It seems we are right as a MAKE or BREAK level in the markets. I'm still a believer of MELT UP until it fails.
I continue to watch for technical failure - but I've not seen it happen yet.
Get some.
#trading #research #investing #tradingalgos #tradingsignals #cycles #fibonacci #elliotwave #modelingsystems #stocks #bitcoin #btcusd #cryptos #spy #gold #nq #investing #trading #spytrading #spymarket #tradingmarket #stockmarket #silver

SPY/QQQ Plan Your Trade For 6-9: Inside BreakawayToday's pattern suggests the SPY/QQQ will attempt to make a breakaway type of price move - away from Friday's open-close range.
Given the fairly tight opening price level this morning, I would stay cautious in early trading today and try to let the first 60 minutes play out - looking for that breakaway trend/momentum.
Overall, the markets are still in a Bullish price phase - trying to push higher.
But, as I continue to warn, I believe the markets could rollover and break downward at any time.
BTCUSD moved substantially higher overnight. This could be the beginning of a bigger advance higher. But, it could also be an exhaustion move higher.
Gold and Silver are still melting upward. This move in metals recently certainly shows the markets are still fearful of any potential downside price activity.
Again, I urge traders to stay cautious as we continue to struggle within the sideways price range.
Price will show us what it wants to do and I believe this move higher in BTCUSD could be a false type of breakout move to the upside.
Get some.
#trading #research #investing #tradingalgos #tradingsignals #cycles #fibonacci #elliotwave #modelingsystems #stocks #bitcoin #btcusd #cryptos #spy #gold #nq #investing #trading #spytrading #spymarket #tradingmarket #stockmarket #silver
