$BTC short idea Plan and Trigger This is not a prediction this is a plan..
If this happens do this..
The plan here is IF BTC 1. breaks below PWO - Previous Week Open, 2.Breaks below rising Trendline, 3.Breaks below R2-H (Range 2 High(thats the trigger to go short with Targets marked on chart.
Target 1 = R1-L (Range 1 Low)
Target 2 = R2-Mid (Range 2 Mid)
Notice the inefficient and fast move up noted on the chart. these usually get filled so if we trade in to this candle range i suspect a fast down move to follow.
GOLD-SILVER

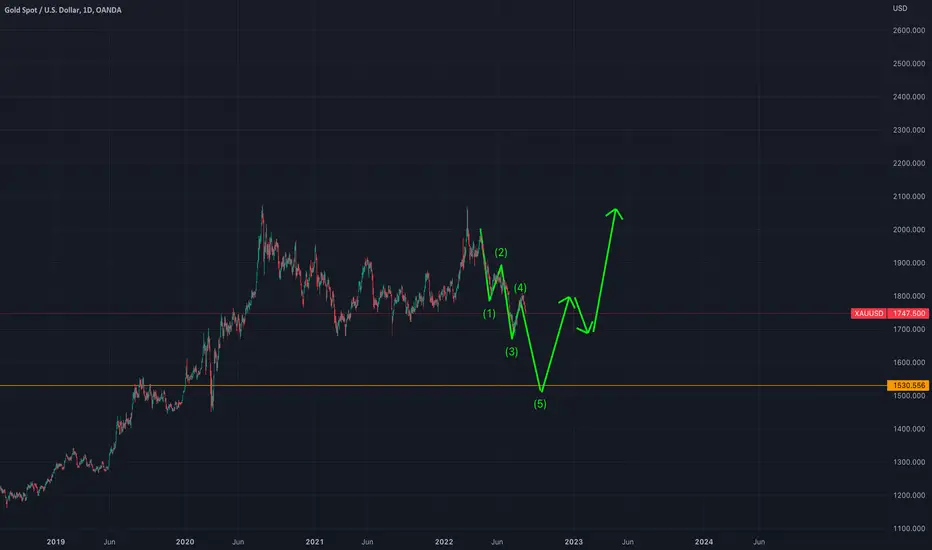
$XAUUSD Gold going to plummet due to $DXY dollar wrecking ballPlease check out my analysis on DXY I did which explains the time tables and variables. If I was any other currency (but Swiss) - I'd be buying gold and silver (physical). Your central banks will print away to appease the plebs as they start to install a ecurrency social credit score system. If I was American I'd wait a bit to buy gold and silver at least if you're going to do it - buy half physical now, buy some puts on some miners (they fall harder when gold falls) and then use any dry powder to buy more physical.
I anticipate that there will also be nationalization of resources and sectors - so mining stocks won't be a good go to unless you're investing in $NEM, since America will be the last to nationalize. Some countries may just tax windfall profits like they're considering with oil companies. This would drop the stock so physical is the only way to go. If you make money on the puts, use that also to buy more physical.
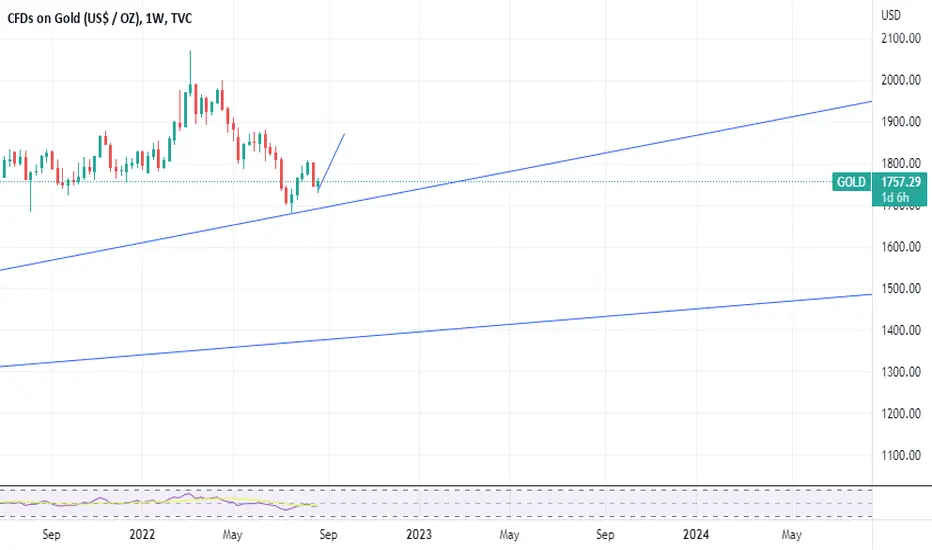
XAUUSD | LongAt the moment the downtrend has been broken and we are seeing a good correction after the start of a new uptrend; If Powell's speech in Jackson Hole does not cause too much volatility, we can hope for gold growth.
be profitable🤑
Gold breaks out of the downtrend?!As discussed in this video, gold breaks out of the downtrend as indicated by the RSI which can be a reliable leading indicator when it comes to increasing your odds of foreseeing a change in trend.

XAUI have made a post attached to this chart about the current JPY and XAU correlation and it shows that if we the expected sell of in the Yen we can look to short XAU down to area of balance labelled in this chart, I have drawn a horizontal box on the chart to signify the area highlighted on the JPYX Chart, Please take a look at the other chart below.
gold forecastgold has a resistance around 1900 and above and according to the world situation, there are so many countries are struggling for their economy situation in this time I am not sure gold will go down
COVER ALL SHORTS AND SELL PUTS RALLY TO 4375 THIS MORNING i HAVE NOW COVERED ALL SHORTS The FED is going to let the inflation to run HOT I have now moved to a 100 % net long gold n silver
Metals Copper idea (22/08/2022) Copper futures.
The rise of the metal depends on the 3.1315 support point to achieve the bullish movement, and we expect the metal to rise in the near term and also in the long term, it may rise from the current prices and the second wave has ended or the decline continues to the 61% level at prices of 3.3440 and the second wave ends there

Precious metals about to jumpI think we're already in recession, it won't take long before regular people and precious metals investors to realize that. Expecting a 🚀 trend for precious metals.
A buy of your lifetime is coming imo....I think this upcoming dip in precious metals will be the last time you will see those low prices....
$GAL $GAL.AXThis is how i would play GAL.
So much to explain could do with a video. But anyway il try explain.
Identified three ranges. R1 R2 and R3.. H=High, L=Low and Mid = Mid range.
Price rejected R2 High and is currently consolidating between R2 H and R2 Low...
Plan A looking for entry on retest of R3 H or deep to R3 Low. This level has not been retested yet. Will look for entry on 15 or 5 minute tf using the EMA cross and some sort of falling resistance break.
T1 = 1.255
T2 = 1.330
If it trades below the MID range and holds im not interested and will have to re-evaluate.

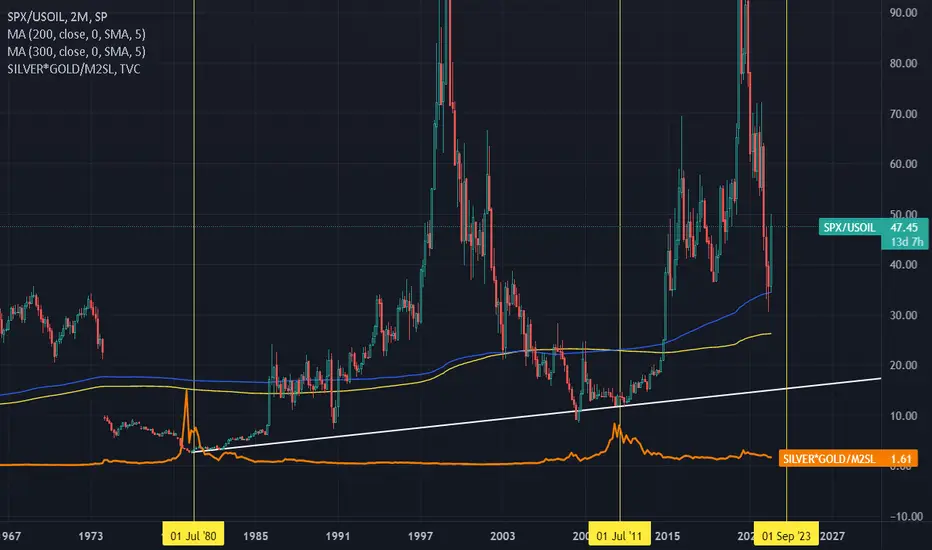
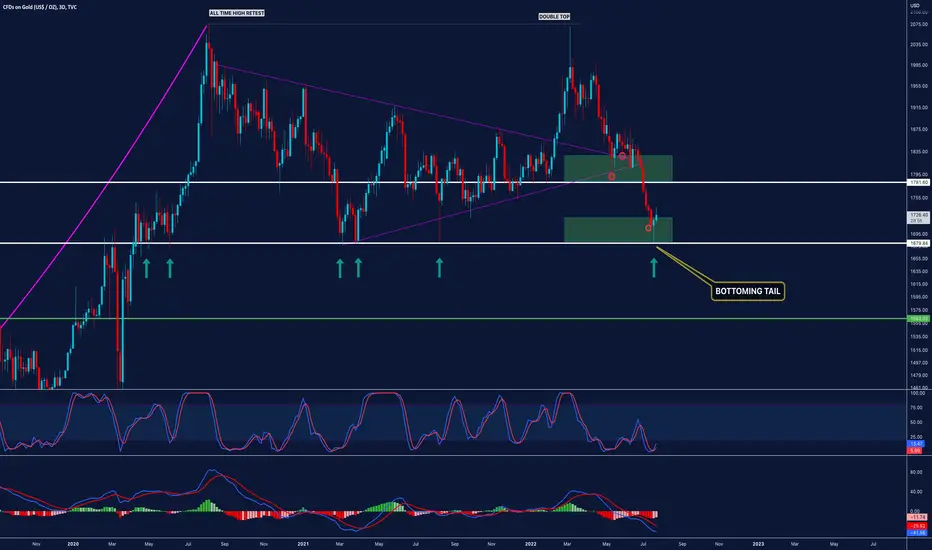
GOLD and SILVER peak when SPX/USOIL bottomsClear relationship between the ratio of SPX/USOIL and precious metals. The ratio bottoms precisely when gold and silver prices peak. If you "zoom in" you can see a strong downward tail (shooting star) in the latest month. Compare to previous bottoming events.
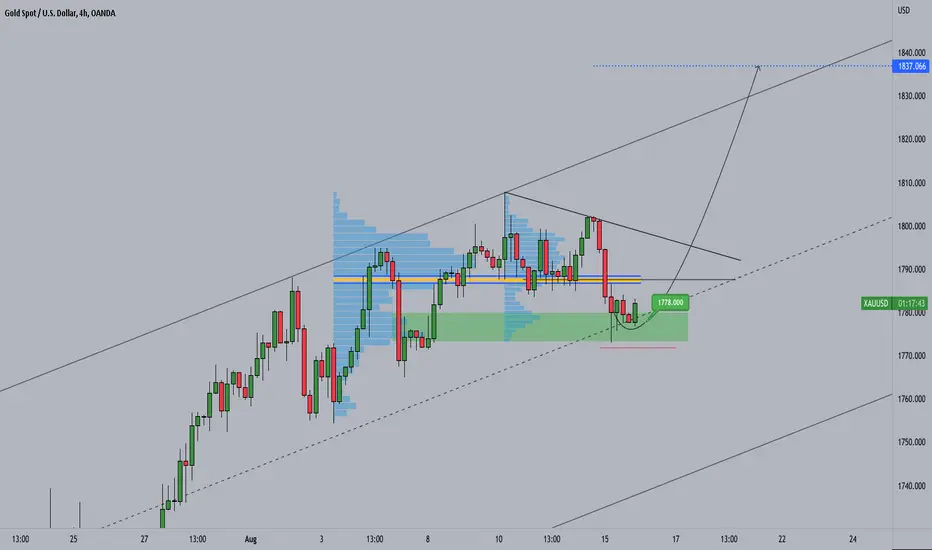
GOLD Forecast 8/15Here we a potential buy at 1778 with a target of 1830 - 1837, stop loss below the low of 1773
We are looking for a bullish trend continuation from the .618 zone in the green box. Targeting the 1.618 extension & Daily time frame 50% confluence within the 1830's
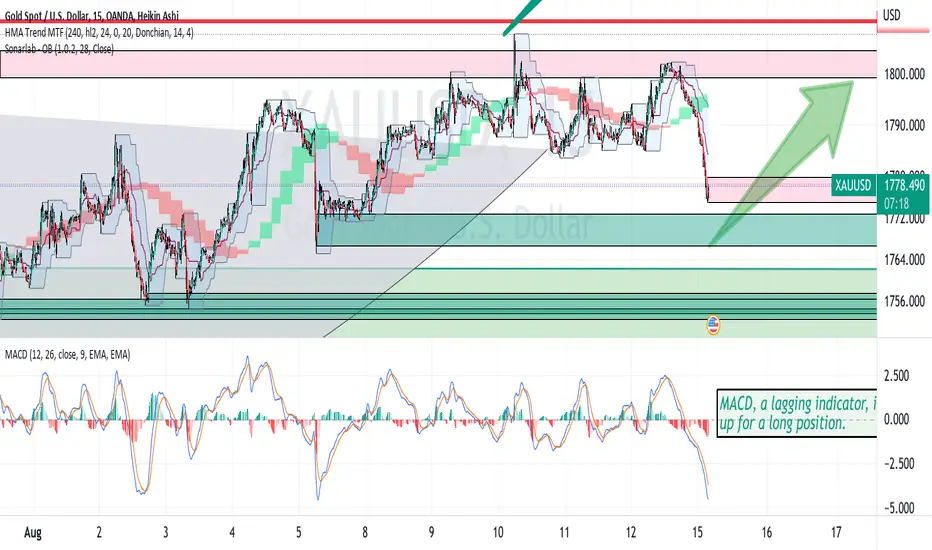
GOLD READY TO BOUNCE UPOANDA:XAUUSD
The 15N chart shows spot gold in a downtrend in the London
market. It will soon hit sell orders accelerating the downtrend
into the buy order zones. I believe that it will reverse
and trend upward to the overhead sell orders which are
at 1798 for one percent of upside.
This is my idea for a day trade of XAUUSD on the forex market
first the UK then NY. It is for information only and not a trade
recommendation.
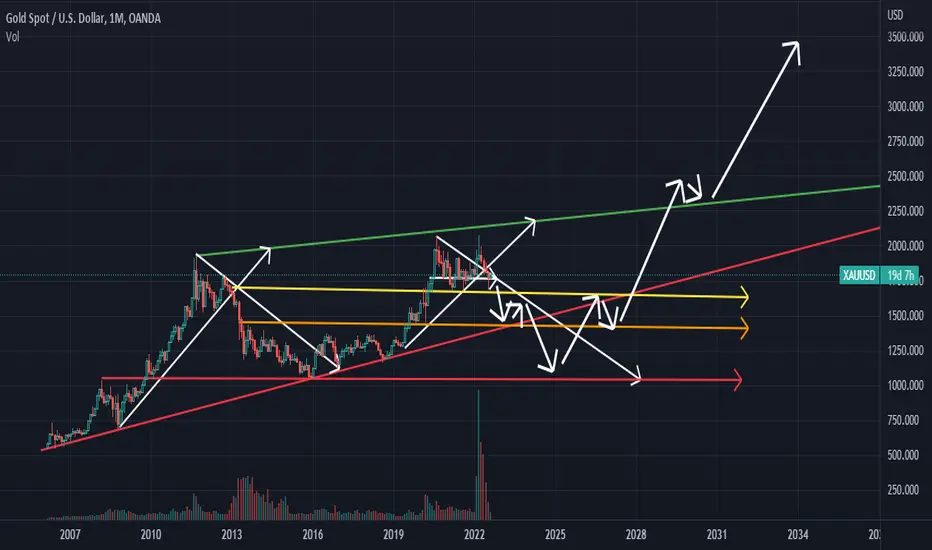
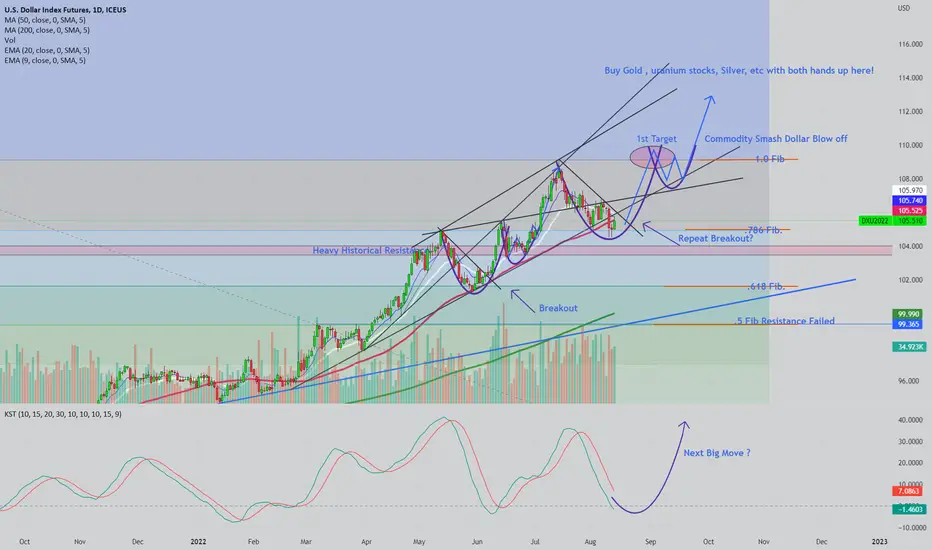
Double cup and handle U.S dollar blow off?With more rate hikes coming in the future due to inflation still being too hot, this could be a reality. When commodities stop falling in the future with a dollar pushing higher (2023?), that should be a good time to really back up the truck with physical gold and silver #1. #2 Mining stocks in gold, silver, copper, uranium, steel, etc should also be on your radar for deals you never thought you'd get. Tech boom done, next is a Commodity Boom after an all out assault to smash inflation. Good luck everyone.
SPX / SPOT GOLD Ratio may be at a TOPSP:SPX
With the ration at a top as suggested by looking to the left and the RSI pivot
indicator, a strategy might be to exit stocks and buy spot gold.
An alternative view is that they both might be about to downtrend
but that gold will downtrend slower causing the ratio to drop.
Please comment as to your opinion. Thanks !

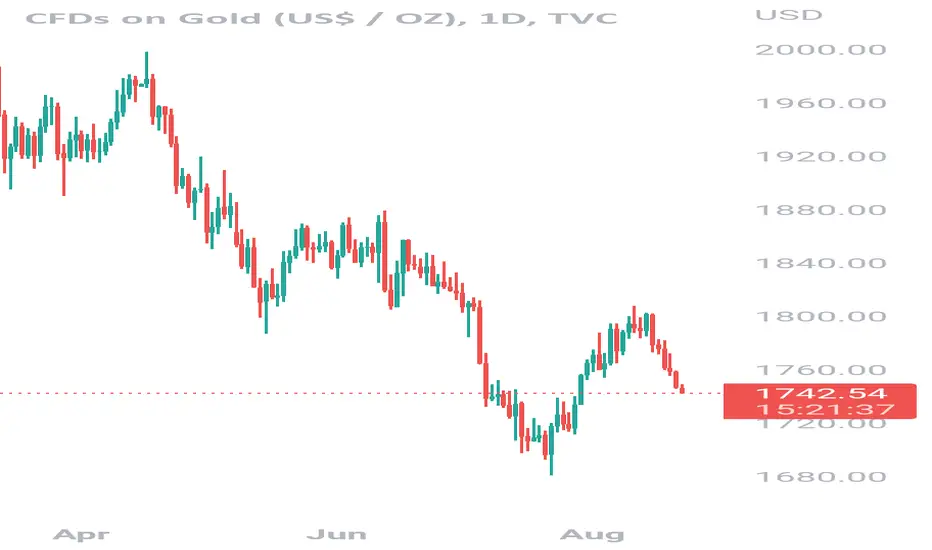
Gold w/ a full retraceTVC:GOLD has completed a full retrace back to historical support around the 1670-1680 zone. This area has help support multiple times in the past making it rather significant.
With this full retrace came a fantastic buying opportunity (especially for stackers) that I personally took advantage of. I do not trade paper metals but simply use the charts to time great stacking opportunities for the long term.
Silver had built a long term consolidation zone with similar support structure in place before breaking down lower. Check the image below for similarities. :) If the 1670 level is lost on a higher time frame, Gold could slide lower but not all hope is to be lost or Bearish, we do have good news!
Price action has looked to formed a bottoming tail on the 3 day with some momentum building in the indicators. Check the Stochastic RSI and watch for the cross to stay true and close above the 20 level while the MACD Historgram has flipped colors and looking for its bullish cross as well. Since Gold is such a massive market its always good to use the lower time frames to time entries and get a early warning of what could happen on the higher time frames. Such as - 1 Day flips bullish before the 3D which flips bullish for the 1 week and so forth.
Buttttt, there is a catch. Theres always a catch. price could get hammered back down for a retest or collapse of this support area after the next Fed announcement which I believe is the 27th of July.
Watch Crude Oil, IYC, & GOLD. The Markets Entering New PhaseGold, Crude Oil, IYC are about to enter a new phase. Take a look at 2006~2014 as a perfect example of what's next. Got Gold?
This is going to be an epic run if you know what to expect.

Gold & Silver Reaching A Launchpad with Currencies (like 2003)Many traders believe the current setup in Gold/Silver is similar to 2018 or 2015. But the reality is this is more similar to 1999~2003 with a strong US Dollar and weakening global currencies.
As long as Gold/Silver continue to strengthen while the US Dollar stays strong, foreign currencies will weaken and wreak havoc on foreign markets.
Eventually, the risk levels will increase in foreign markets which will send FEAR skyrocketing. That will move capital into Gold/Silver and break the channel/trends that are currently in place.
I believe we are very close (possibly 2 to 4+ months away) from that breaking point.
Watch global Emerging Markets and foreign governments for signs of collapse. These will be the early warning signs that Gold/Silver are "T-minus 10".
Once the US Dollar peaks/turns, we'll be at "T-minus 3".
At that point, everything will be ALL SYSTEMS GO for Gold & Silver.
Pay attention. This is a huge setup for precious metals.

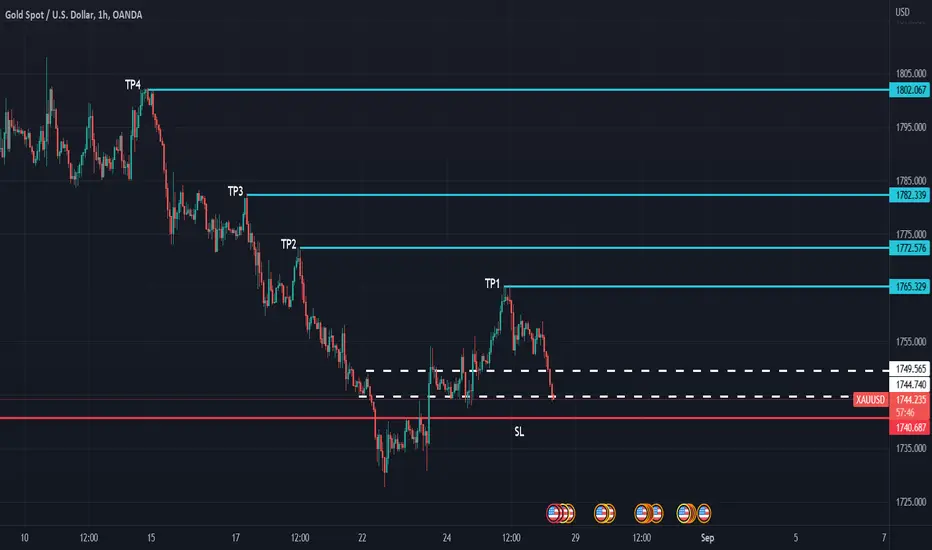
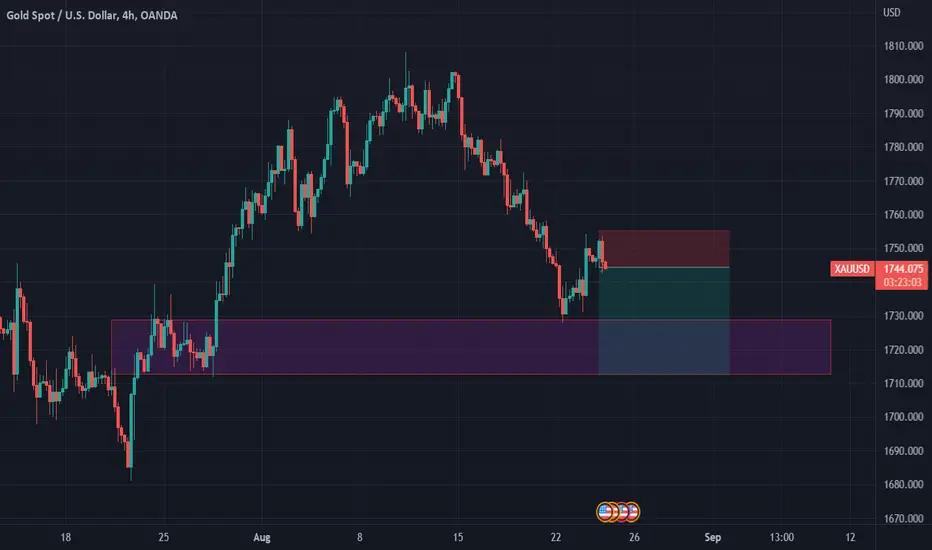
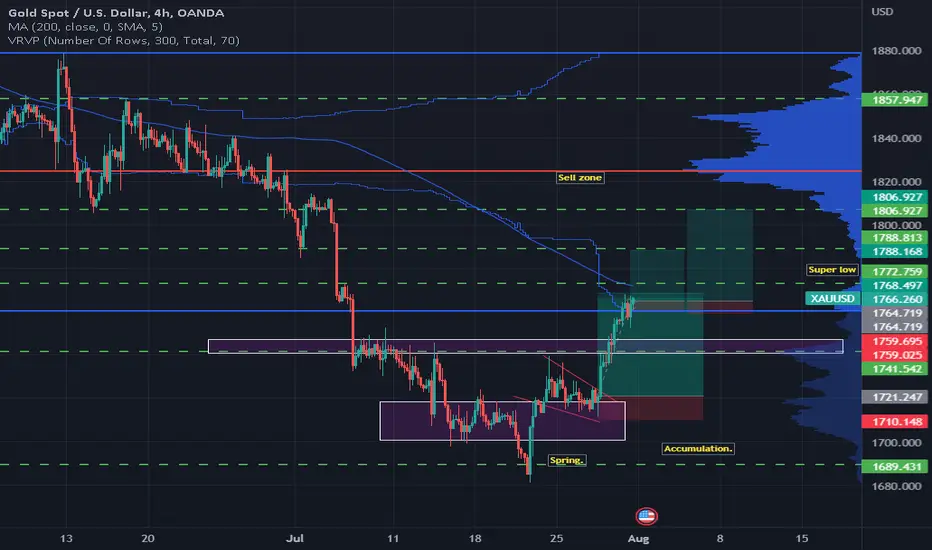
XAUXAU has done brilliantly since the last post with a rise of around $50, price now forms an inside bar on the 4H, an inside bar is often found in impulsive moves what it represents is a lower time frame consolidation so when we see as a green hammer/pin it can signify a good chance of imbalance continuing so because of this we have to look for previous levels of balance in the market, where will price stall?
I have labelled a few targets I believe we can hit, I could have added another setup with a slighty higher TP, but I think it is best to start closing out the long positions a bit quicker, so keep an on the 4H chart and LTF and when you see obvious signs of the market deteriorating then we have to act accordingly.
Longer term I believe the continued rate hikes will continue to close the gains XAU saw in the super inflation, I still believe DXY Index will climb considerably higher in the long term, so we can keep an eye for shorts if we enter a distribution phase.
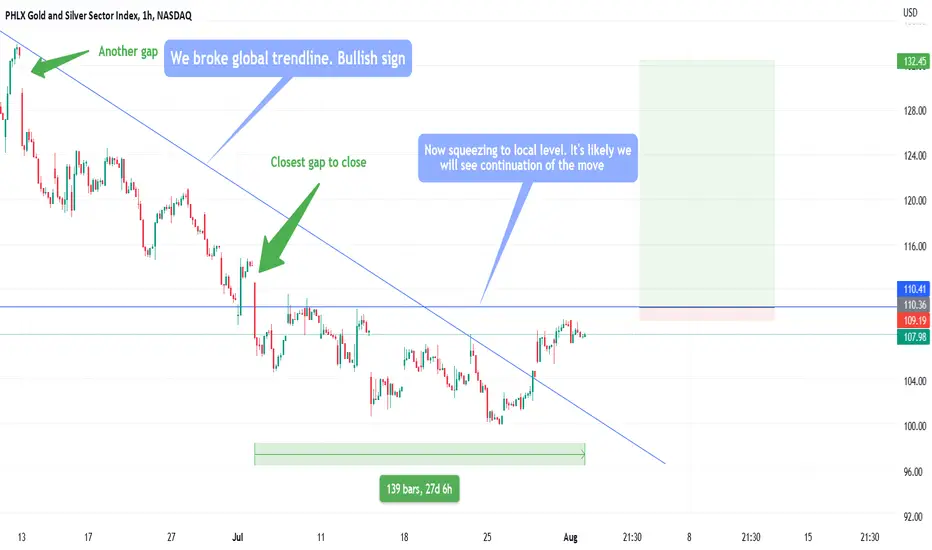
XAU - Gold is in bullish trend, may accelerate soon🌙XAU Globally
We broke throught huge trendline, this breaking bearish trend and becoming bullish once again
XAU Locally
We stopped before important level at 110 and currently accumulating power below it. Accumulation looks healthy and is 27d old right now.
After more squeezing it may be a good idea to open long.
As targets we may choose gaps - one at 114 and another one at 130
What do you think of this idea? What is your opinion? Share it in the comments📄🖌
If you like the idea, please give it a like. This is the best "Thank you!" for the author 😊
P.S. Always do your own analysis before a trade. Put a stop loss. Fix profit in parts. Withdraw profits in fiat and reward yourself and your loved ones
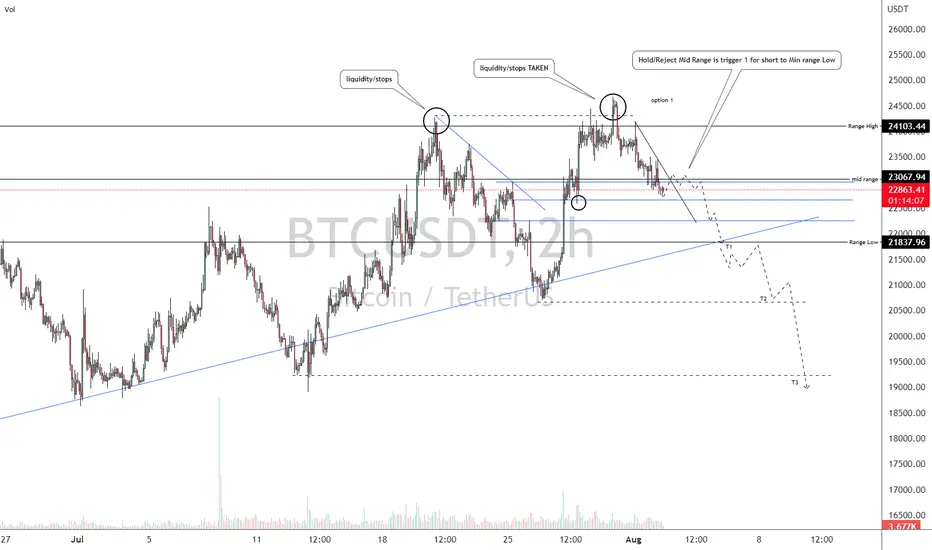
BTC Bear Casethis is my plan for a short scalp or swing on BTC.
liquidity has been taken at range high. Usually happen before a bigger move lower.
If we reject/hold below mid range im looking for shorts with targets marked on the chart T1 T2 and T3.
looking at ES and Nasdaq for confluence which look like a pullback is a high probability.
Again i dont care what way it goes.. plan for it and if your trigger gets triggered play it and manage risk.. Fu#k the Perma Bulls they will get you rekt..
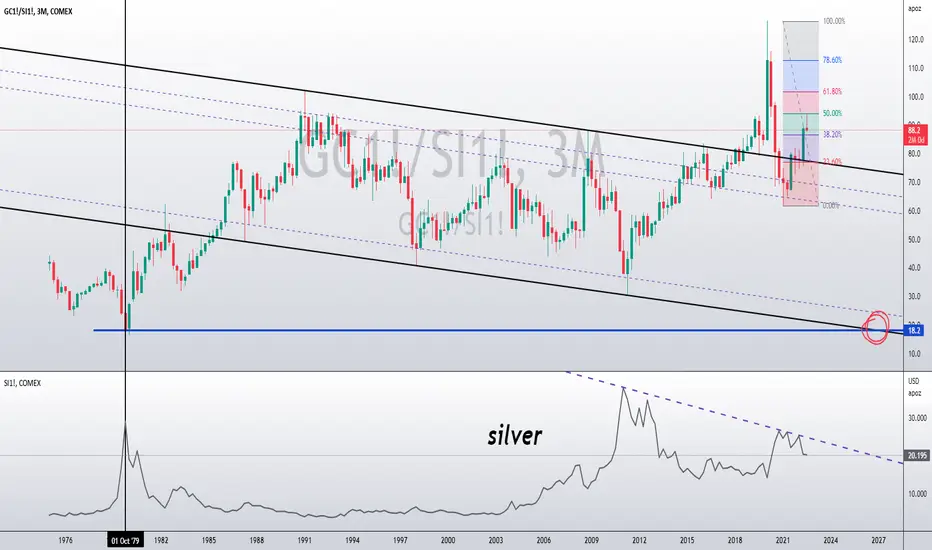
gold to silver ratio$gsr quarterly, using futures, has now done a perfect Fibonacci 50% retrace, and begun to build a bear hammer, or engulfing.
Most reversals after a long upside trend are pretty violent.
Last time inflation was this great, it took 18 ounces of silver to buy one ounce of #gold.