SPY/QQQ Plan Your Trade For 4-9 : Top/Resistance PatternToday's pattern suggests the SPY/QQQ will attempt to move a bit higher in early trading - trying to identify a resistance area. Then, roll over into a downward price trend.
Be cautious of the overnight price range, potentially already setting the upper boundary of the TOP pattern for today. It can happen that overnight trading sets a PEAK/TOP, and we move into sideways/downward trading related to the current TOP/Resistance pattern.
I believe the US markets will attempt to move upward, toward the $490-500+ level before topping out today. I believe this move will be related to the strong support near the $480 level and will attempt to further establish the downward price channel established by the big breakdown in trend over the past 9+ days.
Ultimately, I believe price is struggling for direction, but I also believe this process (with tariffs) is working out as expected.
This is obviously a very volatile market - so stay cautious as we move into a more consolidated price trend over the next few weeks.
I don't expect the markets to try to make any really big moves over the next 2+ week (unless news hits). At this point, I believe the markets will try to UNWIND the volatility over the next 2+ weeks.
BTCUSD is trading near the lower range of the consolidation phase. This could be the start of the breakdown to the Ultimate Low.
GOLD and Silver are moving higher after forming the base (just as I expected). Metals will likely rally strongly as global fear elevates.
Thank you for all the great comments. I'll try to publish a few new videos today and tomorrow to help everyone out.
Remember, price gives us new information every minute/bar. It is a matter of unraveling the puzzle with price - one bar at a time.
If you like what I do, follow along.
Get some.
#trading #research #investing #tradingalgos #tradingsignals #cycles #fibonacci #elliotwave #modelingsystems #stocks #bitcoin #btcusd #cryptos #spy #gold #nq #investing #trading #spytrading #spymarket #tradingmarket #stockmarket #silver
GOLD-SILVER

Gold/Silver Ratio Nears 100: What Does It Mean Historically?The Gold/Silver ratio is on the verge of reaching 100, an extremely rare level seen only at key historical turning points. The chart includes a 2,500-week linear regression channel, which shows that over the very long term, the ratio has been steadily rising, though at a slow pace. Occasionally, the ratio touches the 1.5 standard deviation line, and in rare, game-changing events, and sometimes it even breaks beyond that level.
Here are some of the key historical turning points marked by major spikes in the Gold/Silver ratio:
1- Early 1990s: The collapse of the Soviet Union, the Gulf War, and a U.S. recession pushed the ratio to 106. It remained above 1.5 standard deviations for more than two years.
2- 2002: Following the dot-com bubble burst, the 9/11 attacks, and the Iraq War, the ratio climbed to 82.6, nearing the 1.5 deviation line.
3- 2008 Recession: The global financial crisis triggered by the collapse of Lehman Brothers sent the ratio to 88.50. This spike sparked a major rally in both gold and silver, lasting until 2011 when the ratio reached one of its deepest bottoms.
4- 2019: The U.S.–China trade war under Trump’s first term pushed the ratio to 93, again nearing the 1.5 deviation threshold.
5- 2020 (COVID-19 Shock): The pandemic caused one of the biggest disruptions in modern economic history. Although relatively short-lived, its impacts were severe. The Gold/Silver ratio surged to 126 , marking the highest level in modern records, possibly the highest in all of history.
6- 2024–2025 (Global Trade War?): With the U.S. imposing major tariffs on key global trading partners, this could be another historic inflection point. The full impact is still unfolding, but risks of a serious global slowdown, or even a deep recession are rising. A full-scale trade war remains a real possibility.
Now, the Gold/Silver ratio is approaching 100 and nearing the 1.5 standard deviation line. It remains unclear whether this represents a powerful pair trade opportunity—"sell gold, buy silver"—or a structural breakout where the ratio stays elevated for an extended period. In either case market is showing that this is one of the rare turning point of global economy.

Likely bottom values-SUB 30 SILVER at 100 GSR-BACK THE TRUCKStocks are pulling the entire market, every sector, down, as it approaches a final 4 year cycle low. Here are the criteria most probable to be met in anticipating a bottom

SPY/QQQ Plan Your Trade Update For 4-8 : Absolute PerfectionThank you. Thank you to all of you who follow my videos and believe in my research.
The last few days/weeks have been absolutely incredible.
My SPY Cycle Patterns, on average, are about 70-80% accurate over a 12-month span of time. There are things, like news and big events (elections, outside forces, big news) that can disrupt any market trend and completely invalidate my SPY Cycle Patterns.
But, when the markets are generally left to their own accord, the SPY Cycle Patterns play out almost perfectly.
Yes, traders need to learn to adopt a PLAN A vs. PLAN B mentality with my SPY Cycle Patterns.
If Brad is right - this will happen. And if Brad is wrong, the opposite will likely happen.
But, the comments I've been receiving over the past 20+ days have been incredible.
Thank you.
Knowing that I'm reaching a larger group of people now (than when I started doing these videos about a year ago) and knowing that some of you are really seeing some BIG GAINS following my research is simply incredible.
I started doing these videos to prove my research and tools were incredible solutions for traders. But, at the same time, I started doing this to combat some of the scammers that are out there.
In my world, watching people (or hearing from them) after they've been scammed a couple of times is heartbreaking.
Most people put a lot of time and effort into trying to become skilled traders. I get it.
That's why I'm doing this - to show you the right path and to show you that price is the ultimate indicator.
Again, thank you from the bottom of my heart. Keep sending me those success stories and...
GET SOME.
#trading #research #investing #tradingalgos #tradingsignals #cycles #fibonacci #elliotwave #modelingsystems #stocks #bitcoin #btcusd #cryptos #spy #gold #nq #investing #trading #spytrading #spymarket #tradingmarket #stockmarket #silver

SPY/QQQ Plan Your Trade Update 4-8 : Counter Trend Bottom/RallyThis video was created to help you better understand why it is important to WAIT for the SPY Cycle Patterns to setup efficiently.
It is critically important that all of you learn the three basic rules of trading.
1. Never try to force a position/trade. If your research tells you some type of price event/trend is likely - don't jump into the trade too early. Wait for confirmation and wait for price to confirm your analysis is correct.
2. Start with a small position. Never GO BIG on your initial trade. If you are wrong, you can manage the trade with a small win/loss. If price moves in the direction you expect, you can add more once you get confirmation the trend will continue (potentially).
3. BOOK PROFITS early and keep BOOKING PROFITS as the trend continues higher. You can always get back into the trade with CALL/PUT options - but if you don't learn to BOOK PROFITS EARLY (20-30% profits in the trade), then you'll very likely FAIL to build your account efficiently.
(Trust me, #3 is VERY IMPORTANT)
Beyond these three simple concepts, one of the most important aspects of trading with my SPY cycle patterns is to learn to WAIT for the pattern to setup efficiently.
Today is a great example.
The BOTTOM/Rally Start pattern was in Counter-trend mode. Thus, I expected it to be INVERTED - turning it into a TOP/Selloff Start pattern.
In order for that pattern to play out, we needed to see the markets open higher (and potential trend higher for a bit of time), then roll over into a top pattern. After that tops pattern setup, the markets should continue to move into a moderate selloff trend (downward).
Think about it. Were you smart trying to SELL INTO the rally this morning or were you smart to wait for the ROLLOVER and sell into the breakdown trend?
IMO, smart traders waited for the top to setup/confirm and started selling as we got into the breakdown trend phase.
Again, I'm trying to help you learn to become a better trader.
I hope this video helps.
Get some.
#trading #research #investing #tradingalgos #tradingsignals #cycles #fibonacci #elliotwave #modelingsystems #stocks #bitcoin #btcusd #cryptos #spy #gold #nq #investing #trading #spytrading #spymarket #tradingmarket #stockmarket #silver

SPY/QQQ Plan Your Trade For 4/8 : Bottom/Rally Start - CounterFirst off, today's pattern is in a COUNTER TREND mode. Think of that as the pattern being INVERTED to the current price trend.
Next, the Bottom/Rally Start pattern is usually a base/bottom type of pattern that prompts a fairly strong bullish/rally phase in price.
This time, because it is inverted (in Counter-trend mode) and is forming within the broad consolidation phase of the current EPP pattern, I believe this Bottom/Rally Start pattern will really be a Top/Selloff start type of pattern.
Where price will find resistance in early trading, form a rollover top, and start to move back downward towards the 500-505 level on the SPY.
I don't believe this downward price move will attempt to break below 480-485 today. I believe today's move will be a moderate pullback in the trend.
Although any BIG news could disrupt the current support near $480, so be aware that any big news event could crush the markets (again) and send the SPY trying to retest the $480 support level.
Gold and Silver appear to be basing - perfect. I'm watching for Metals to really start to reflect the FEAR in the markets and rally above $3200 (Gold)/$39 (Silver).
BTCUSD appears trapped in the breakdown stage of the current EPP Consolidation phase and the new CRADLE pattern. No matter how I try to identify if I'm wrong with BTCUSD, I keep seeing the breakdown as the more dominant trend.
Get some.
#trading #research #investing #tradingalgos #tradingsignals #cycles #fibonacci #elliotwave #modelingsystems #stocks #bitcoin #btcusd #cryptos #spy #gold #nq #investing #trading #spytrading #spymarket #tradingmarket #stockmarket #silver

SPY/QQQ Plan Your Trade EOD Review : POP PatternToday's pattern played out perfectly.
I'm really amazed that the SPY rallied up to my resistance level ($520-525) and stalled/bottomed exactly near my $480 support.
Absolutely PERFECT reflection of the data I presented this morning and from my research over the weekend.
Now, if my analysis is correct, we move into a sideways consolidation pattern for the next 3+ weeks where price will attempt to establish a range (moving slightly downward in trend) before we get to the late-June breakdown (setting up the July 2025 low), then another big breakdown in October 2025.
I can't tell you how pleased I am with the comments and messages I get every day. Some of you are KILLING IT and I'm so happy to be able to help.
Remember, we are all trying to find the best way to profit from these market trends. So remember to share your success with others and let them know how to find the best tools for trading (on TradingView).
Now, let's get busy trying to get ready for the next phase of this market trend (which will come in June).
I'll keep you updated.
Get some.
#trading #research #investing #tradingalgos #tradingsignals #cycles #fibonacci #elliotwave #modelingsystems #stocks #bitcoin #btcusd #cryptos #spy #gold #nq #investing #trading #spytrading #spymarket #tradingmarket #stockmarket #silver

SPY/QQQ Plan Your Trade For 4-7 : POP In Counter Trend ModeToday's POP pattern in Counter Trend mode suggests the markets will find support and attempt to POP upward a bit.
I expect the SPY to attempt to reach levels above 505 today. Possibly trying to peak near 510.
The same thing will happen with the QQQ - a potential rally (POP) higher targeting the 420-425 level.
Watch this video TWICE if you really want to understand what is taking place in the markets right now.
The tariff issue will settle over the next 15+ days. The SPY/QQQ are moving into the EPP Consolidation Phase (just like I've been telling you for months now).
BTCUSD is moving into a BREAKDOWN phase and will likely target $63k over the next 30+ days.
Gold and Silver reacted to the breakdown of the SPY/QQQ as they always do - PANIC SELLING.
Now that the panic selling pressure appears to be subsiding, Gold and Silver should build a base and begin an explosive move higher - targeting $4200-4500 for gold and targeting $41-44 for silver.
We live in exciting times and I still believe the US markets will DOUBLE or TRIPLE over the next 5-10+ years.
Get Some.

SPY/QQQ Plan Your Trade For 4-4 : Breakaway PatternToday is a very interesting day because my MRM investment model turned BEARISH on the Daily chart. That means we have broken through major support because of this tariff war and the markets are not OFFICIALLY (based on my models) into a Daily BEARISH trend (or a Daily Broad Pullback Phase).
What that means is we need to start thinking of the markets as OVERALL BEARISH and trying to identify support - or a base/bottom in the near future.
This is no longer a BULLISH market - everything seems to have flipped into a BEARISH primary trend (OFFICIALLY).
So, watch this video to understand how Fibonacci price levels will likely play out as the SPY targeting the 500-505 level (possibly lower) and where the same Fibonacci price levels will prompt the QQQ to target 395-400.
BUCKLE UP. This is a BIG CHANGE related to overall market trend.
Gold is holding up much better than Silver. But I still believe this is a PANIC selling phase in Gold/Silver and they will both base/recovery and RALLY much higher.
The funny thing about the cycles in Gold/Silver is this:
In 2007-08, just after the major expansion phase completed, the Global Financial Crisis hit - prompting a large downward price rotation in metals.
Maybe, just maybe, this forced tariff war issue is a disruption that will "speed up" the process of metals rallying above $5000++ over the next 60+ days.
I see this move as PHASES and it appears the tariff disruption may prompt a faster Phase-Shift for metals over the next few months. We'll see.
BTCUSD seems to be in SHOCK. It's really going nowhere on very low volume.
If BTCUSD is a true hedge or alternate store of value - I would think it would have an upward reaction to this selling.
We'll see how this plays out.
Get some.
#trading #research #investing #tradingalgos #tradingsignals #cycles #fibonacci #elliotwave #modelingsystems #stocks #bitcoin #btcusd #cryptos #spy #gold #nq #investing #trading #spytrading #spymarket #tradingmarket #stockmarket #silver

SPY/QQQ Plan Your Trade For 4-3 : GAP Breakaway PatternFirst off, thank you for all the great comments and accolades related to my calling this breakdown (nearly 60+ days ago).
Did I get lucky having these new tariffs announced, causing the markets to break downward? Probably.
Did my research suggest the markets were going to break downward anyway? YES.
Did my research predict these tariffs? NO.
My research is specifically price-based. You'll notice I don't use many indicators, other than my proprietary price pressure and momentum indicators.
The purpose of what I'm trying to teach all of you is that price is the ultimate indicator. You can use other indicators if you find them helpful. But, you should focus on the price chart and try to learn as much as you can from the price chart (without any indicators).
Why, because I believe price tells us everything we need to know and we can react to price more efficiently than getting confused by various technical indicators.
At least, that is what I've found to be true.
Today's pattern suggests more selling is likely. After the markets open, I suggest there will be a bunch of longs that will quickly be exited and shorts that will be exited (pulling profits). Thus, I believe the first 30-60 minutes of trading could be extremely volatile.
My extended research suggests the markets will continue to try to move downward (over the next 60+ days) attempting to find the Ultimate Low. But, at this point, profits are profits and we all need to BOOK THEM if we have them.
We can always reposition for the next breakdown trade when the timing is right.
Gold and Silver are moving into a PANIC selling phase. This should be expected after the big tariff news. Metals will recover over the next 3-5+ days. Get ready.
BTCUSD is really not moving on this news. Kinda odd. Where is BTCUSD as a hedge or alternate store of value? I don't see it happening in price.
What I do see is that BTCUSD is somewhat isolated from this tariff news and somewhat isolated from the global economy. It's almost as if BTCUSD exists on another planet - away from global economic factors.
Still, I believe BTCUSD will continue to consolidate, attempting to break downward over the next 30+ days.
Remember, trading is about BOOKING PROFITS and moving onto the next trade. That is what we all need to focus on today.
Get Some.
#trading #research #investing #tradingalgos #tradingsignals #cycles #fibonacci #elliotwave #modelingsystems #stocks #bitcoin #btcusd #cryptos #spy #gold #nq #investing #trading #spytrading #spymarket #tradingmarket #stockmarket #silver

Using The CRADLE Pattern To Time/Execute TradesThis simple video highlights one of my newest pattern definitions - the Cradle Pattern.
In addition to the many other patterns my technology identified, this Cradle Pattern seems to be a constant type of price construct.
I'm sharing it with all of you so you can learn how to identify it and use it for your trading.
Ideally, this pattern represents FLAGGING after a trend phase.
It is a consolidation of price within a flag after a broad trending phase.
It usually resolves in the direction of the major trend, but can present a very solid reversal trigger if the upper/lower pullback range is broken (see the examples in this video).
Learn it. Use it.
Price is the ultimate indicator.
Learn to read price data more efficiently to become a better trader.
Get some.
#trading #research #investing #tradingalgos #tradingsignals #cycles #fibonacci #elliotwave #modelingsystems #stocks #bitcoin #btcusd #cryptos #spy #gold #nq #investing #trading #spytrading #spymarket #tradingmarket #stockmarket #silver

SPY/QQQ Plan Your Trade Update Update For 4-2 : ConsolidationThis quick update shows why I believe the SPY/QQQ will struggle to make any big move as long as we stay within the 382-618 "Battle Zone".
The SPY continues to rally up into this zone and stall out. If the SPY stays within this zone, I believe the markets will simply roll around in a tight range and go nowhere today.
Thus, I published this article to warn traders not to expect any big trends until we breakout - away from this Fibonacci "Battle Zone".
You can't kick the markets to make it go anywhere. And, unless you are trading very short-term swings in price - you are probably better off sitting on the sidelines waiting for a broad market trend to establish.
This is a warning. As long as we stay in the Fibonacci "Battle Zone", price will struggle to build any major trend.
So, play your trades accordingly - or just take a break from trading while you wait for the markets to roll out of the "Battle Zone".
Get some.
#trading #research #investing #tradingalgos #tradingsignals #cycles #fibonacci #elliotwave #modelingsystems #stocks #bitcoin #btcusd #cryptos #spy #gold #nq #investing #trading #spytrading #spymarket #tradingmarket #stockmarket #silver

SPY/QQQ Plan Your Trade For 4-2 : GAP Reversal Counter TrendToday's pattern suggests price may attempt to move downward in early trading, trying to find support near recent lows, then potentially roll a bit higher.
I do expect price to move into a downward price trend - attempting to break below the 549 price level and targeting the 535-545 target Fib level this week.
Today, Thursday, and Friday are all GAP/Breakaway types of patterns. So we should be entering an expansion of price trend and I believe that trend will be to the downside.
Gold and Silver are nearing a Flag Apex level. Very exciting for a potential breakout rally driving Gold up above $3250 and Silver up above $36.
I personally believe there is nothing stopping Gold and Silver in this rally phase until Gold reaches levels above $4500. GET SOME.
BTCUSD had a very interesting spike low. I still believe BTCUSD will roll downward - targeting the $76-78k level, then break downward towards the $60k level. Time will tell.
The rest of this week should be very exciting with the Breakaway and GAP patterns.
Get some.
#trading #research #investing #tradingalgos #tradingsignals #cycles #fibonacci #elliotwave #modelingsystems #stocks #bitcoin #btcusd #cryptos #spy #gold #nq #investing #trading #spytrading #spymarket #tradingmarket #stockmarket #silver

SPY/QQQ Plan Your Trade For 4-1-25 : Temp Bottom PatternToday's pattern suggests the SPY/QQQ will attempt to find temporary support near recent lows or a bit lower.
I'm not expecting much in terms of price trending today. I do believe the downward price trend will continue today with the SPY attempting to move down to the 548-550 level trying to find support.
The QQQ will likely attempt to move downward toward the 458-460 level trying to find the support/base/bottom level today.
Gold and Silver are in a moderate consolidation phase that I believe is transitioning through a Flag-Trend-Flag-Trend-Flag-Trend type of phase. Ultimately, the trend will continue to push higher through this phase as metals have moved into the broad Expansion phase. This phase should see gold attempt to move above $4500+ before the end of May/June 2025.
BTCUSD is rolling within the 0.382 to 0.618 Fibonacci price levels related to the last price swing. I see this middle Fib level and the "battle ground" for price. I expect price to stall, consolidate, and roll around between these levels trying to establish a new trend.
Thus, I believe BTCUSD will move downward, attempting to move back down to the $78,000 level.
Nothing has really changed in my analysis except that we are experiencing a 48-96 hour consolidation phase before we move back into big trending.
Play smart. Position your trades so that you can profit from this rolling price trend and prepare for the bigger price move downward (targeting the bigger base/bottom near April 15, 2025).
Get some.
#trading #research #investing #tradingalgos #tradingsignals #cycles #fibonacci #elliotwave #modelingsystems #stocks #bitcoin #btcusd #cryptos #spy #gold #nq #investing #trading #spytrading #spymarket #tradingmarket #stockmarket #silver

Gold is Confusing-Physical is Simple Gold may have put in an IC top, or we could be early on a missed ICL

SPY/QQQ Plan Your Trade EOD Update : Rejecting The BreakdownDoes this big rejection bar mean the selling trend is over?
I doubt it.
In my opinion and experience, big rejection bars like this reflect a critical price level where the markets will attempt to REVISIT in the near future.
Normally, when we get a big rejection bar, like today, we are testing a critical support/resistance level in price and you can see the difference between the SPY, DIA and QQQ charts.
The QQQ price data is already below the critical support level and barely trying to get back above the rejection level. Whereas the SPY and DIA are still above the rejection lows.
I see this as a technology driven breakdown and because of the continued CAPTIAL SHIFT, we may move into a broader WAVE-C breakdown of this current trend.
I see the SPY already completing a Wave-A and Wave-B. If this breakdown plays out like I expect, we'll see a bigger breakdown in price targeting $525-535, then possibly reaching $495-505 as the immediate ultimate low.
If you follow my research, there is a much lower level near $465-475 that is still a likely downward target level, but we'll have to see how price reacts over the next 2+ days before we can determine if that level is still a valid target.
Watch for more support near recent lows tomorrow, then a potential breakdown in the SPY/QQQ/DIA.
Get some.
#trading #research #investing #tradingalgos #tradingsignals #cycles #fibonacci #elliotwave #modelingsystems #stocks #bitcoin #btcusd #cryptos #spy #gold #nq #investing #trading #spytrading #spymarket #tradingmarket #stockmarket #silver

SPY/QQQ Plan Your Trade For 3-31 : Carryover PatternToday's pattern suggests the SPY/QQQ will attempt to carryover Friday's selling trend.
I do believe the SPY/QQQ will attempt to find some support as we move into a Temp Bottom pattern tomorrow. So be aware that the SPY/QQQ may attempt to find support near 535-540/450-455 over the next few days.
I would also urge traders to not get very aggressive in terms of trying to pick a bottom in this downtrend.
In my opinion, I don't see any reason why anyone should be buying into this breakdown unless you are prepared to take a few big lumps. Just wait it out - wait for a base/bottom to setup.
Gold and Silver are moving higher and I believe this trend will continue for many weeks/months.
BTCUSD should continue to move downward - trying to establish the Consolidation Phase range.
As we move into trading this week. Be aware that Tuesday/Wednesday of this week are more ROTATION type days. They may be wide-range days - but they are still going to be ROTATIONAL.
Get some.
#trading #research #investing #tradingalgos #tradingsignals #cycles #fibonacci #elliotwave #modelingsystems #stocks #bitcoin #btcusd #cryptos #spy #gold #nq #investing #trading #spytrading #spymarket #tradingmarket #stockmarket #silver

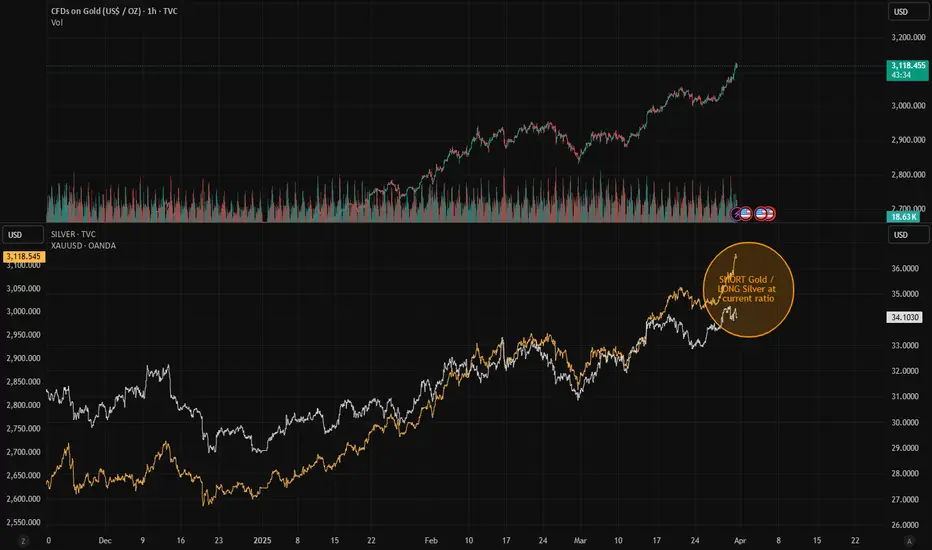
Gold/Silver Ratio AnalysisGold (XAU/USD) currently trading at $3,118 has significantly outpaced Silver (
SILVER) at $34.07 since mid-March. This divergence has pushed the Gold/Silver ratio to elevated levels, creating a potential mean-reversion opportunity.
Looking at the chart, both metals maintained strong correlation through January-February 2025 before Gold began its dramatic acceleration in March-April. While both assets remain in strong uptrends, Gold's nearly vertical move in April suggests potential overextension relative to its historical relationship with Silver.
Trading Strategy
Consider a pairs trade setup:
SHORT Gold / LONG Silver at current ratio
Target: Reversion to 50-day moving average of Gold/Silver ratio
Stop: 2% additional expansion of current ratio
Risk Management
Key to this trade is position sizing that equalizes dollar exposure between the two positions. Use reduced leverage as precious metals volatility remains elevated across the complex.
TVC:XAU NASDAQ:XAG #PairsTrading
The Greatest Opportunity of Your Life : Answering QuestionsThis video is an answer to Luck264's question about potential price rotation.
I go into much more details because I want to highlight the need to keep price action in perspective related to overall (broader) and more immediate (shorter-term) trends.
Additionally, I try to highlight what I've been trying to tell all of you over the past 3+ years...
The next 3-%+ years are the GREATEST OPPORTUNITY OF YOUR LIFE.
You can't even imagine the potential for gains unless I try to draw it out for you. So, here you go.
This video highlights why price is the ultimate indicator and why my research/data is superior to many other types of analysis.
My data is factual, process-based, and results in A or B outcomes.
I don't mess around with too many indicators because I find them confusing at times.
Price tells me everything I need to know - learn what I do to improve your trading.
Hope you enjoy this video.
Get Some.
#trading #research #investing #tradingalgos #tradingsignals #cycles #fibonacci #elliotwave #modelingsystems #stocks #bitcoin #btcusd #cryptos #spy #gold #nq #investing #trading #spytrading #spymarket #tradingmarket #stockmarket #silver

SPY/QQQ Plan Your Trade For 3-28-25 EOD Review : Brutal SellingI sure hope all of you were able to profit from this big selling trend today.
And I also hope you didn't get trapped in the potential for a base/bottom rally off the recent lows.
This move downward reminds me of the 2022-2023 downward trending pattern when the Fed was raising rates.
What Trump is doing with tariffs is very similar. It is slowing the economy in a way that will not break it - but it will result in slower, more costly, economic function.
Watch this video and I sure hope all of you have great (profitable) stories to share with me today.
I know I do. And, I'm positioned for the weekend. Ready to profit no matter what the markets do.
Get some.
#trading #research #investing #tradingalgos #tradingsignals #cycles #fibonacci #elliotwave #modelingsystems #stocks #bitcoin #btcusd #cryptos #spy #gold #nq #investing #trading #spytrading #spymarket #tradingmarket #stockmarket #silver

SPY/QQQ Plan Your Trade For 3-28-25 : Carryover in Counter TrendToday's pattern suggests the SPY/QQQ will attempt to move downward in early trading. The SPY may possibly target the 564-565 level before finding support. The QQQ may possibly attempt to target the 475-476 level before finding support.
Overall, the downward trend is still dominant.
I believe the SPY/QQQ may find some support before the end of trading today and attempt to BOUNCE (squeeze) into the close of trading.
Gold and Silver are RIPPING higher. Here we go.
Remember, I've been telling you of the opportunities in Gold/Silver and other market for more than 5+ months (actually more than 3+ years). This is the BIG MOVE starting - the BIG PARABOLIC price rally.
BTCUSD has rolled downward off the FWB:88K level - just like I predicted. Now we start the move down to the $78k level, then break downward into the $58-62k level looking for support.
Love hearing all of your success stories/comments.
GET SOME.
Happy Friday.
#trading #research #investing #tradingalgos #tradingsignals #cycles #fibonacci #elliotwave #modelingsystems #stocks #bitcoin #btcusd #cryptos #spy #gold #nq #investing #trading #spytrading #spymarket #tradingmarket #stockmarket #silver

SPY’s Epic Crash: Bearish Flag Unleashed!Buckle up, trading fam, because the SPDR S&P 500 ETF Trust (SPY) just pulled a move so wild, it’s giving Keeping Up with the Kardashians a run for its money. We’re talking a bearish flag breakdown on the 4-hour chart that’s got more twists than a Game of Thrones finale, more drama than a Bachelor rose ceremony, and more profit potential than a Shark Tank pitch gone viral. If you’re ready to laugh, learn, and maybe make some cash, then grab your popcorn—this 2,500-word rollercoaster is about to take you on a ride you won’t forget! 🎢
Act 1: SPY’s Golden Era—Living Its Best Barbie Life
Let’s set the scene: it’s late October 2024, and SPY is strutting its stuff like it’s Margot Robbie in Barbie. The price climbs from $570 to a dazzling $607.98 by mid-January 2025—a 6.5% glow-up that’s got traders swooning harder than Ken at a Dreamhouse party. SPY’s basically saying, “I’m not just an ETF—I’m iconic,” as it basks in the glow of a bull market hotter than a Love Island villa.
But here’s the tea: even the shiniest stars can fall. By mid-January, the Stochastic Oscillator at the bottom of the chart is flashing “overbought” signals louder than a Real Housewives reunion meltdown. It’s the first sign of trouble—like when you realize the DJ at the club just played “Sweet Caroline” for the third time, and the vibe’s about to go south. SPY’s living large, but the party’s about to get crashed, Jersey Shore style.
Act 2: The Flagpole Plunge—SPY Sinks Faster Than the Titanic
Cue the dramatic music, because mid-January 2025 is when SPY decides to pull a full-on Titanic. The price plummets from $607.98 to $566.77 in a matter of days—a $41.21 drop, or 6.8%, that’s got traders screaming “I’m not okay!” louder than a Euphoria episode. This sharp decline is the flagpole of our bearish flag pattern, and it’s a doozy. SPY’s sinking faster than Jack and Rose’s ship, and the bulls are left clinging to the wreckage like there’s no room on the door. 🚢
The Stochastic Oscillator dives into oversold territory (below 20), confirming the bearish momentum is stronger than the Hulk after a double espresso. It’s a bloodbath on Wall Street, and SPY’s the main character in this tragic plot twist. But just when you think the drama’s over, SPY decides to play coy—like a Bachelor contestant who says “I’m not here for the right reasons” but sticks around for the drama anyway. Enter the consolidation phase, aka the “flag” part of the bearish flag pattern. Let’s break it down, shall we?
Act 3: The Flag—SPY’s Tease Game Is Stronger Than a Love Island Bombshell
From late January to mid-February 2025, SPY enters a consolidation phase that’s more tantalizing than a Love Island bombshell walking into the villa. The price bounces between $566.77 and $577.74, forming a sneaky little upward-sloping channel. It’s like SPY’s playing hard to get, teasing traders with a “Will I rally? Will I crash?” vibe that’s got everyone on edge. The Stochastic Oscillator hovers below 50, like a villa couple who’s “just talking” but definitely not coupled up yet.
This consolidation is the “flag” in the bearish flag pattern, and it’s a classic setup. Think of it as SPY taking a quick breather after its big fall, sipping a cocktail by the pool before diving back into the drama. Bearish flags are continuation patterns, meaning the price is likely to keep falling after this little flirt-fest. It’s like when you’re watching The Masked Singer—you know the reveal’s coming, but the suspense is what keeps you glued to the screen. And trust me, you won’t want to miss the next act.
Act 4: The Breakout—SPY Says “I’m Out!” Like a RuPaul’s Drag Race Exit
Mid-February 2025 arrives, and SPY decides it’s done with the games. The price breaks below the lower trendline of the flag at $566.77, and it’s like watching a RuPaul’s Drag Race queen sashay away after a lip-sync battle: dramatic, fierce, and leaving the bulls in the dust. The breakout confirms the bearish flag pattern, and the bears are strutting their stuff like they just won the crown. 👑
The price doesn’t just dip—it plunges to $546.33 by late March 2025, a further drop of $20.44 (or 3.6%) from the breakout point. The Stochastic Oscillator dives back into oversold territory, confirming the bearish momentum is back with a vengeance. SPY’s basically telling the bulls, “You better work—because I’m not!” as it leaves them gagging on the runway.
Let’s talk about the measured move—the price target for this bearish flag. We take the length of the flagpole ($41.21) and project it downward from the breakout point ($566.77). That gives us a target of $525.56. SPY doesn’t quite hit that mark—it bottoms out at $546.33—but it gets close enough to make traders sweat harder than a Chopped contestant with 30 seconds left on the clock. It’s a solid performance, even if it didn’t stick the landing perfectly.
Pop Culture Parallels: SPY’s Bearish Flag Is a Reality TV Showdown
Let’s take a step back and look at this chart through a pop culture lens, because SPY’s bearish flag is basically a reality TV showdown. The initial uptrend from October to January is the honeymoon phase—think The Bachelor contestants on their first group date, all smiles and champagne. 🥂
The flagpole drop in mid-January is the drama bomb, like when a contestant gets caught kissing someone else in the hot tub. The consolidation phase is the confessional montage, where everyone’s talking smack and plotting their next move. And the breakout? That’s the rose ceremony—SPY’s handing out its final rose to the bears, and the bulls are sent packing with nothing but a suitcase and some tears.
Trading Tips: How to Slay This Bearish Flag Like a Drag Race Superstar
Now that we’ve had our fun, let’s get down to business. How can you trade this bearish flag like a Drag Race superstar? Here’s the tea, served piping hot:
1. Short the Breakout (Sashay, Don’t Shantay)
When SPY broke below the flag at $566.77, that was your cue to short the stock faster than you can say “Sashay away!” A short position here could’ve netted you a $20.44 gain per share as the price dropped to $546.33—enough to buy yourself a new wig for the next challenge.
2. Set a Stop-Loss (Don’t Get Read for Filth)
To avoid getting read for filth by a fake-out, set a stop-loss above the flag’s upper trendline at $577.74. That way, if the breakout flops harder than a Drag Race comedy challenge, you’re safe.
3. Target the Measured Move (Go for the Crown)
The measured move target of $525.56 was the goal, but SPY stopped at $546.33. That’s still a win—like making it to the top 4 but not snatching the crown. If you’d shorted at the breakout, you’d be serving looks and profits.
4. Watch for a Bounce (Don’t Sleep on the Comeback)
As of late March 2025, SPY’s at $546.33, and the Stochastic is oversold. This could mean a short-term bounce is coming, like a Drag Race queen returning for an All-Stars season. Keep an eye on resistance at $566.77 and $577.74—if SPY breaks above those, the bears might be in for a shady twist.
The Bigger Picture: Is SPY’s Downtrend the New Black?
Let’s zoom out for a hot second. Before this bearish flag, SPY was in a strong uptrend for months, living its best life like a Vogue cover star. This pattern marks a potential trend reversal, like when skinny jeans went out of style and baggy pants became the new black. If the downtrend continues, the next support level could be around $540—or even lower if things get really messy.
But here’s the million-dollar question: is this the start of a bigger bear market, or just a temporary dip? It’s like trying to predict the winner of Survivor—nobody knows, but everyone’s got a theory. The Stochastic being oversold suggests a bounce might be near, but the overall trend is still bearish. So, keep your wits about you, because this market’s shadier than a Real Housewives dinner party.
Why This Chart Is More Addictive Than a Love Is Blind Binge
If you’re still here, you’re officially obsessed—and I don’t blame you! This SPY chart is more addictive than a Love Is Blind binge because it’s got all the elements of a great reality show: drama, suspense, and a cast of characters (the bulls and bears) who can’t stop fighting. The bearish flag is the villain we love to hate, and the price action is the love triangle we can’t stop watching.
Plus, trading is a lot like reality TV. You’ve got your highs (the uptrend), your lows (the flagpole drop), and those messy in-between moments (the consolidation). But when the breakout happens, it’s like the finale episode where someone finally gets engaged—or in this case, the bears get their moment in the spotlight. 💍
Final Thoughts: Don’t Miss the Next Episode of SPY’s Reality Show
SPY’s bearish flag breakdown is a masterclass in technical analysis, wrapped in a package of drama and sass that’d make even the most stoic trader crack a smile. Whether you’re a Wall Street pro or a newbie just here for the tea, this chart has something for everyone.
So, what’s next for SPY? Will it hit that $525.56 target, or will the bulls stage a comeback like a Love Is Blind couple at the altar? Only time will tell, but one thing’s for sure: you won’t want to miss the next episode of this reality show. Keep your eyes on the chart, your finger on the trigger, and your sense of humor intact—because in the world of trading, you’ve got to laugh to keep from crying. 😜
Join the Trading Villa!
If you loved this recap of SPY’s bearish flag drama, don’t ghost me like a Love Island ex! Drop a comment with your thoughts—are you shorting SPY, or are you waiting for a bounce? And if you want more trading tea, puns, and reality TV references, hit that follow button faster than you can say “I’m here to make friends.” Let’s spill the tea and make some money together! 🍵

SPY/QQQ Plan Your Trade For 3-27-25 : Breakaway PatternToday's Breakaway pattern suggests the markets will continue to melt downward (possibly attempting to fill the Gap from March 24).
I strongly believe the SPY/QQQ are completing the "rolling top" pattern I suggested would happen near or after the March 21-24 TOP pattern my deeper cycle research suggested was likely.
At this point, things are just starting to line up for a broader market decline while the current EPP pattern plays out as a Breakdown of the EPP Flagging formation (moving into consolidation).
Gold and Silver are RIPPING higher. Yes, I do expect a little bit of volatility near these recent highs. But, I also expect metals to continue to rally higher from these levels over the next 10-15+ days. Watch the video.
Bitcoin is stalling/topping - just as I suggested it would months ago.
Now we see how the market move into this new trending phase and how far this current trend will drive price trends. I believe the SPY/QQQ/Bitcoin will all continue to move downward while Gold/Silver move (RIP) higher on this breakaway move.
This is a PERFECT trader's market.
Get some.
#trading #research #investing #tradingalgos #tradingsignals #cycles #fibonacci #elliotwave #modelingsystems #stocks #bitcoin #btcusd #cryptos #spy #gold #nq #investing #trading #spytrading #spymarket #tradingmarket #stockmarket #silver
