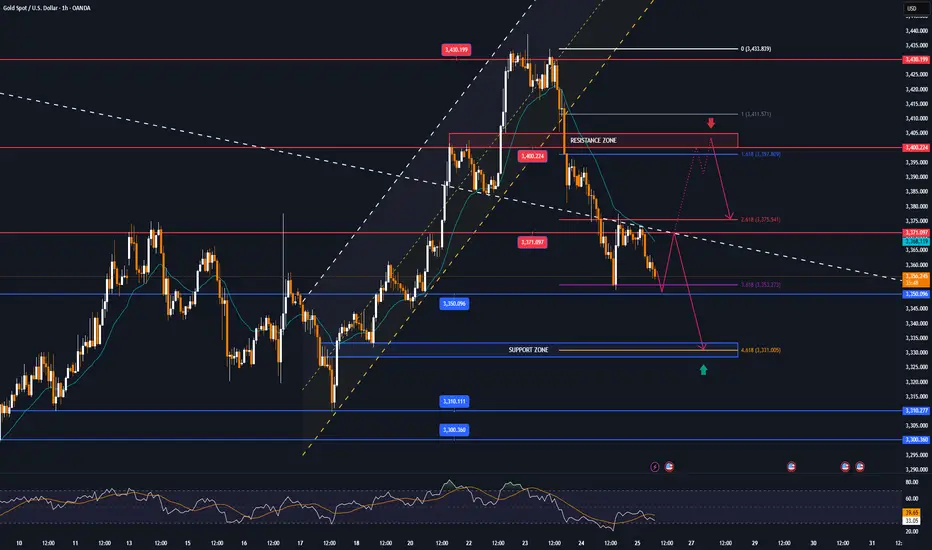
GOLD (XAUUSD): Support & Resistance Analysis for Next Week
Here is my latest structure analysis and important
supports and resistances for Gold for next week.
Consider these structures for pullback/breakout trading.
❤️Please, support my work with like, thank you!❤️
I am part of Trade Nation's Influencer program and receive a monthly fee for using their TradingView charts in my analysis.
Gold
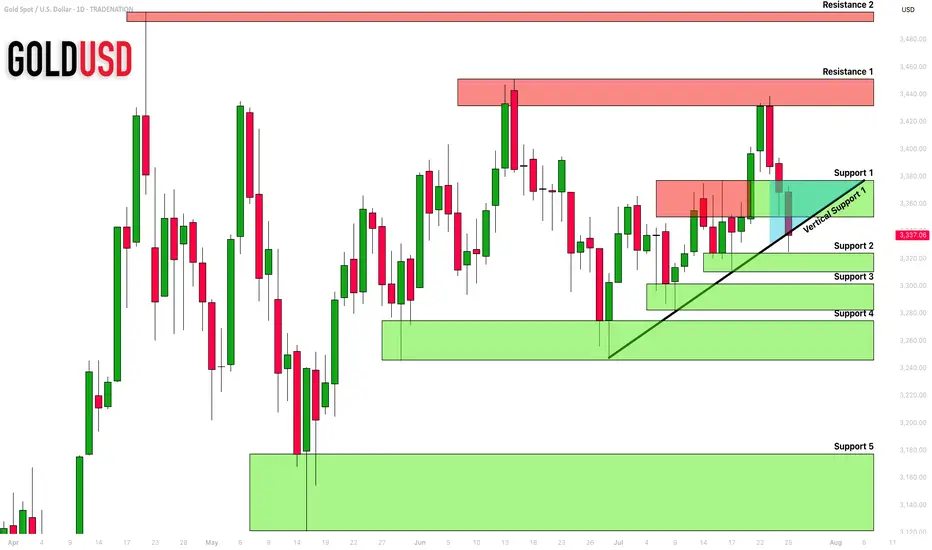
XAUUSD Gold closed bearish and I’ll continue looking for sells. I’d prefer gold to retrace and create a LH and continue selling towards 3310. Last time price was around 3310, it had a massive bullish run so that’ll be the only area I’d sell to unless price breaks that support.

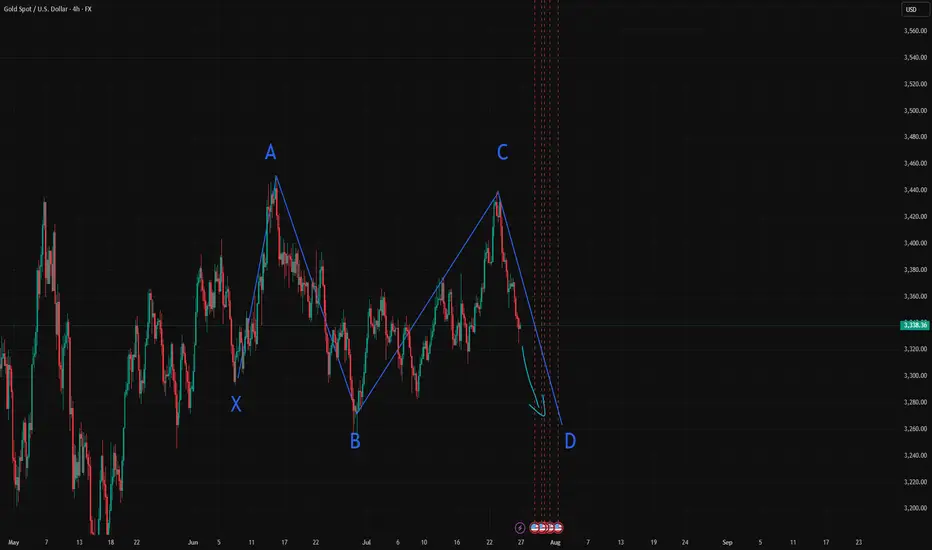
GOLD gartely , XAUUSD ShortLooks like a perfect gartely pattern here on 4h frame , gold might go bearish to 3260
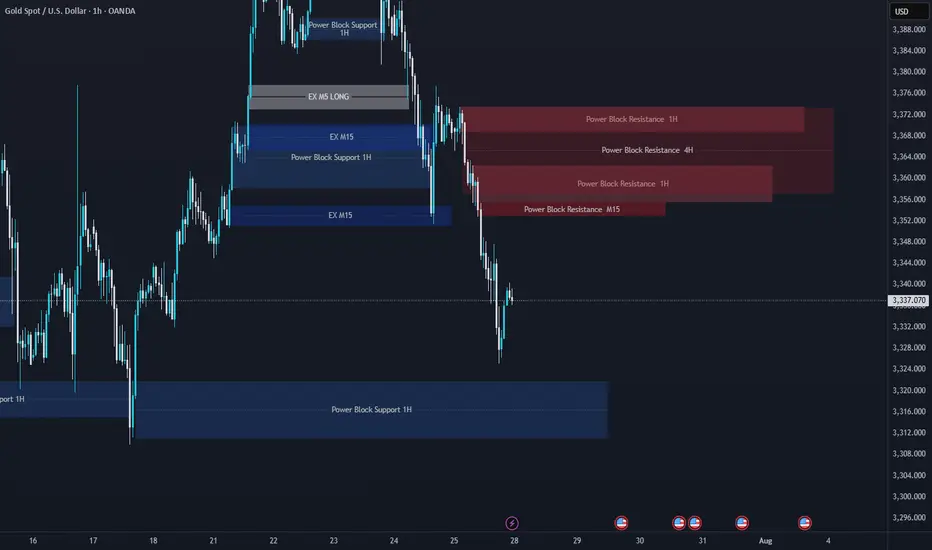
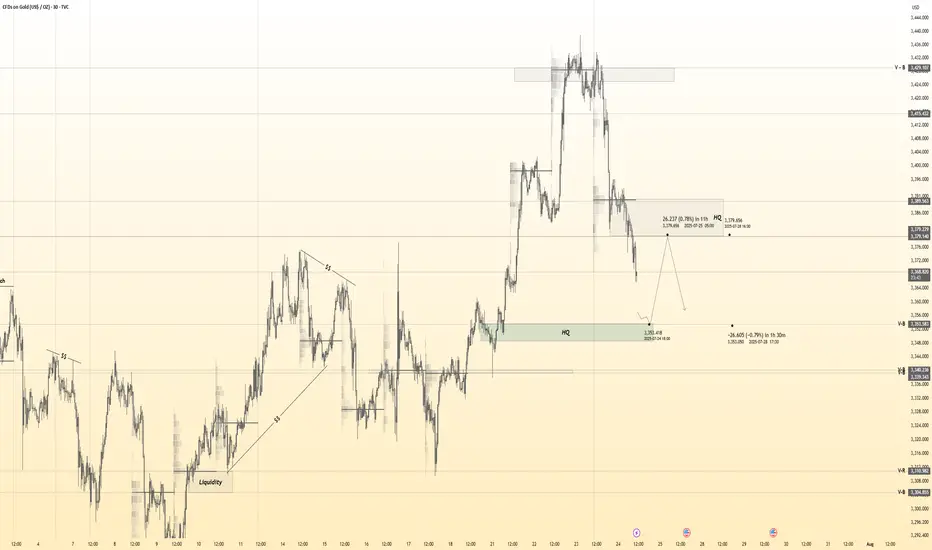
XAUUSD Support & Resistance Levels🚀 Here are some key zones I've identified on the H1/M15/M5 timeframe.
These zones are based on real-time data analysis performed by a custom software I personally developed.
The tool is designed to scan the market continuously and highlight potential areas of interest based on price action behavior and volume dynamics.
Your feedback is welcome!
Gold Approaching 3365 Breakout: Bullish Continuation Above TrendDaily Analysis:
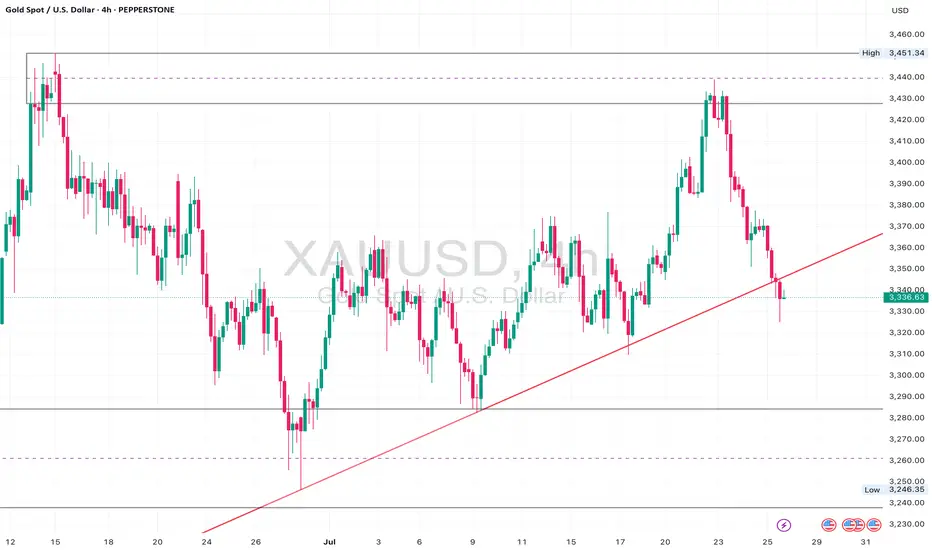
Price is respecting the long-term trendline support and still holding firmly above the 3300 region. Bulls are defending structure with a clean series of higher lows. No major change in trend as long as price remains above 3246.
4H Analysis:
Price is consolidating above the trendline and building structure around 3350. A clean break and close above 3365 could ignite a push toward the 3450 supply zone.
1H Analysis:
Descending trendline break confirmed with bullish closure. Retest holding well above 3350. If structure remains intact, next short-term target is 3375–3390.
Confirmation & Entry:
Break and close above 3365 with strong bullish candle = confirmation. Optional entry on 3350–3355 retest. Targets: 3390, 3450.
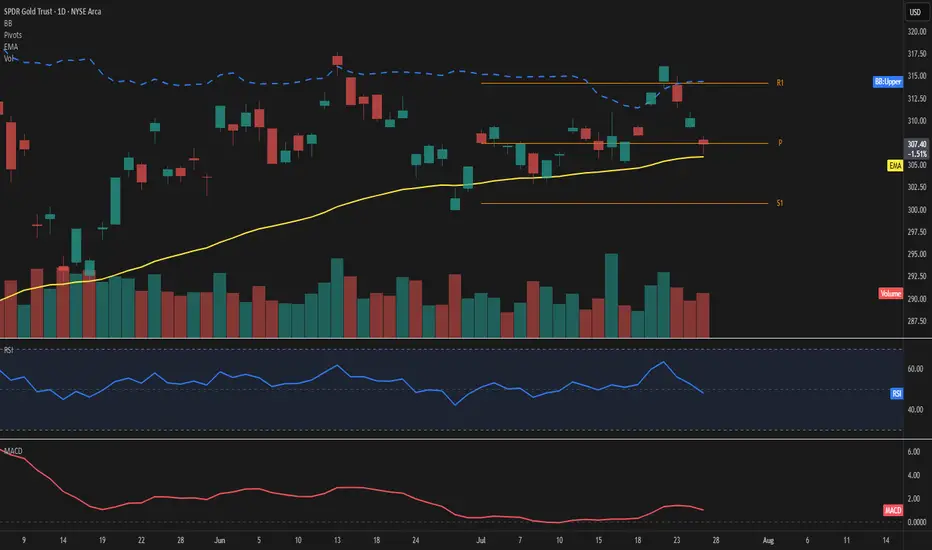
GLD – Price consolidates at highsPrice is hovering just above the 50-day EMA at 307, showing signs of short-term hesitation near the Fibonacci pivot. The upper Bollinger Band sits at 314, leaving moderate room for expansion if momentum picks up.
The RSI reads 48, reflecting a balanced setup without clear directional bias. MACD remains slightly positive, suggesting a still-constructive but soft momentum.
Key levels to watch include the pivot at 307 and the support at 301. On the upside, the 314 area aligns with both R1 and the upper band, acting as the next challenge.
Volume is up sharply (+22%) despite a mild -0.9% price pullback, indicating possible accumulation beneath the surface.
As long as price holds above the 50-day EMA, the structure remains intact.
A move away from the pivot zone will likely define the next directional wave.
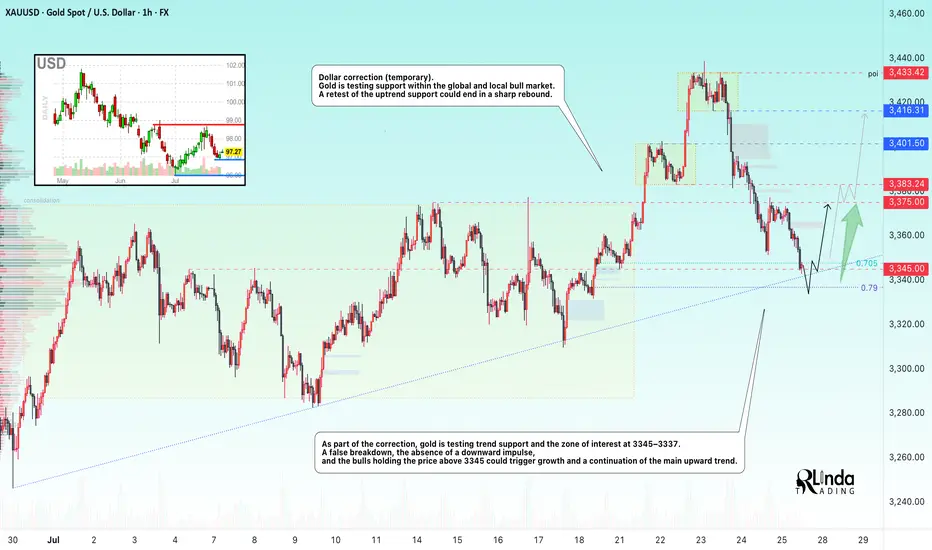
GOLD → Countertrend correction, retest of 3345 before growthFX:XAUUSD , undergoing a deep correction after a false breakout of local resistance at 3433, has reached the support of the upward trend. Will the bulls be able to maintain the trend?
Gold held below $3,400 on Friday, rebounding from $3,350, and is poised to end the week higher. Investors are watching the conflict between Thailand and Cambodia, which is boosting demand for safe-haven assets, and are also awaiting decisions from the Fed and the Bank of Japan next week. The markets received additional support from US trade deals with Asian countries and progress in negotiations with the EU, easing fears of a tariff war.
As part of the correction, gold is testing trend support and the 3345-3337 zone of interest. A false breakdown, lack of downward momentum, and bulls holding prices above 3345 could trigger growth and a continuation of the main upward trend.
Resistance levels: 3375, 3383
Support levels: 3345, 3337, 3330
Technically, the support level of 3345 plays a fairly important role in the market. If, during the correction, the bulls manage to hold their ground above this zone, the prospects for recovery will be high, especially against the backdrop of geopolitical problems.
Best regards, R. Linda!
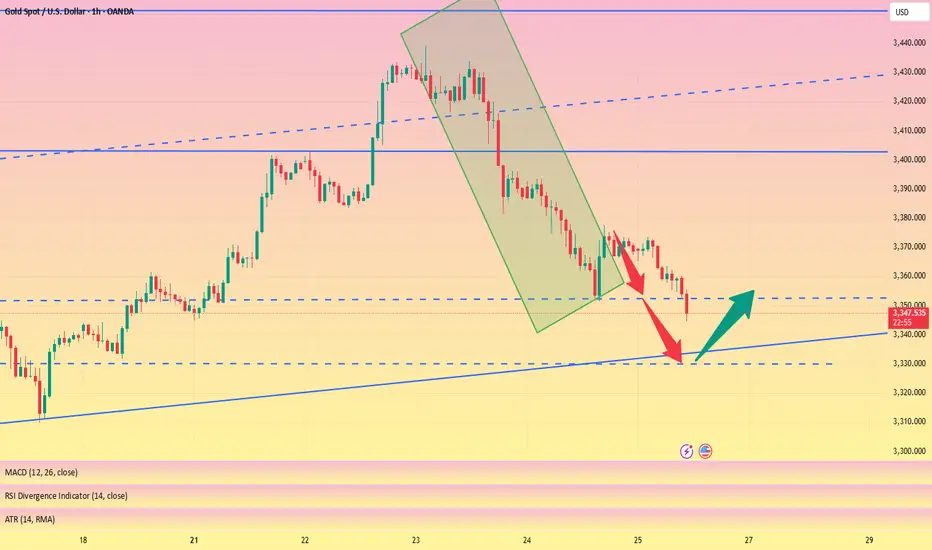
Gold setup for coming week.Hi everyone
This is our setup going into the last week of July trading week.
We could possibly see market retest the 3321-3324 zone & make its way back up to 3347 area, this will also be an area to be monitored for possible break out that will lead back to 3362.
We are looking to get a possible downward pressure from 3345 area to 3303.
Let always look at what market presents & bag potential profits at pivitol areas.
Have a good weekend & good trading week coming up

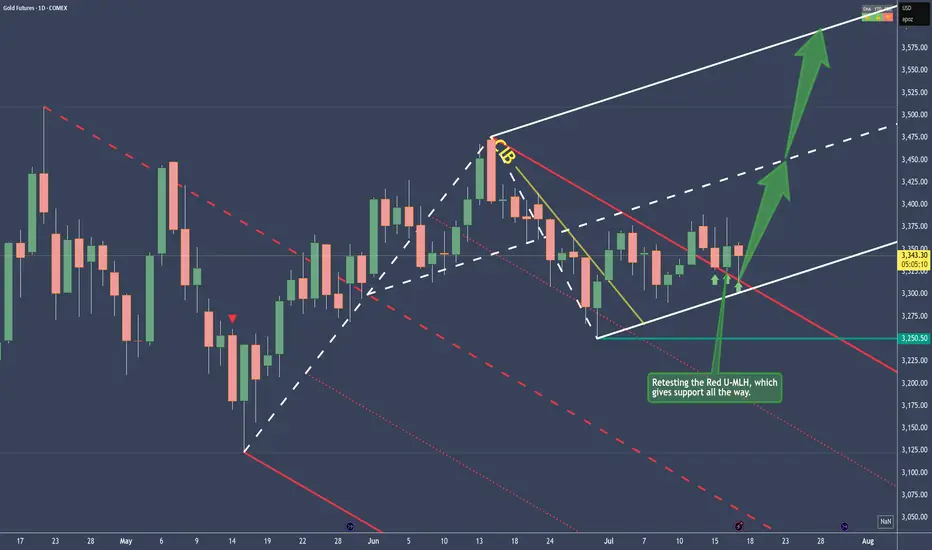
Gold - Bullish and here's whyPrice traveled within the Red Fork, until it broke the CIB Line, which is indicating a Change In Behavior.
From there on, sideways action, until the break of the Red U-MLH happened.
After the close above the Red U-MLH, price has tested it the 3rd time now. At the time of writing, the Bar looks like a PinBar. So it has good sepparation from the bottom, or a long Down-Wick. That's indicates good strenght.
To me this looks like a good long trade, but as everytime, play it save and don't let greed eat your brain ;-)
GOLD BEARS ARE STRONG HERE|SHORT
GOLD SIGNAL
Trade Direction: short
Entry Level: 3,383.09
Target Level: 3,336.50
Stop Loss: 3,413.51
RISK PROFILE
Risk level: medium
Suggested risk: 1%
Timeframe: 12h
Disclosure: I am part of Trade Nation's Influencer program and receive a monthly fee for using their TradingView charts in my analysis.
✅LIKE AND COMMENT MY IDEAS✅

GOLD continues to correct down, good news from trade situationOANDA:XAUUSD has fallen sharply again, currently trading around $3,360/oz, reflecting the easing of global trade tensions, affecting demand for safe-haven assets. The US Dollar and US Treasury yields have also increased, affecting gold prices.
The US Dollar Index ( TVC:DXY ), which tracks the greenback against six other currencies, rose to 97.56.
The yield on the 10-year US Treasury note US10Y rose to 4.386%. The US real yield, calculated by subtracting inflation expectations from nominal interest rates, rose nearly 3.5 basis points to 2.046%.
Markets are increasingly optimistic about such deals after the United States and Japan reached a trade deal, and the European Union could be next. In addition, rising stock markets and low volatility have kept gold's gains in check.
The United States and the European Union are moving toward a potential trade deal that would include a 15% tariff on EU goods and zero tariffs on some items.
The European Commission said Thursday that a negotiated trade solution with the United States is within reach.
“Our focus is on reaching a negotiated outcome with the United States,” a European Commission spokesperson told reporters about the EU-U.S. tariff talks. “We believe that such an outcome is achievable.” The European Commission has repeatedly said that its current priority is to reach a deal with the United States to avoid the 30% tariffs that U.S. President Trump has proposed to impose on EU products starting August 1.
On the economic data front, initial jobless claims in the United States unexpectedly fell last week, suggesting the job market remains solid.
The U.S. Bureau of Labor Statistics reported on Thursday that initial jobless claims fell to 217,000 in the week ended July 19, below expectations of 227,000 and down from 221,000 the previous week.
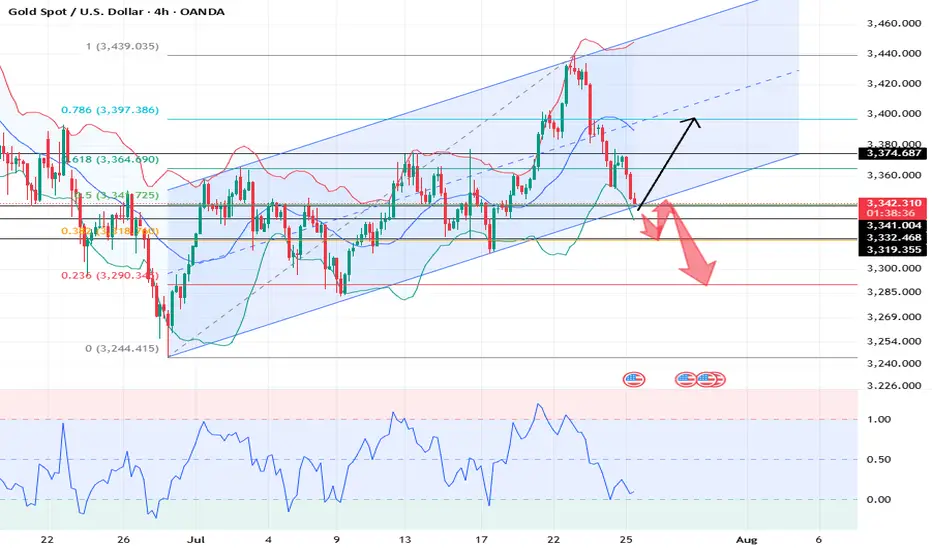
Technical Outlook Analysis OANDA:XAUUSD
Gold is heading for its third consecutive day of decline since hitting the bullish target level sent to readers in the weekly edition on Sunday at $3,430.
Despite the sharp decline, gold still has enough technical conditions for an uptrend given its current position and structure.
Specifically, gold is still above the EMA21, which is considered the nearest support at the moment. Along with that, the uptrend price channel is the short-term trend. However, for gold to qualify for a short-term bullish cycle, it needs to be confirmed by price action above the 0.236% Fibonacci retracement level, then the target is $3,400 in the short term, more than $3,430.
On the other hand, RSI is still holding above 50, and 50 in this case acts as momentum support. Therefore, gold still has room to rise.
In case gold is sold below EMA21, it may suffer a further decline with the next target around $3,310 in the short term, more than $3,300 and the 0.382% Fibonacci retracement level. And if gold loses the support at the 0.382% Fibonacci level, it will qualify for a bearish cycle.
Intraday, the current position of gold price is still tilted towards the upside, and the notable price points will be listed as follows.
Support: $3,350 – $3,310 – $3,300
Resistance: $3,371 – $3,400 – $3,430
SELL XAUUSD PRICE 3406 - 3404⚡️
↠↠ Stop Loss 3410
→Take Profit 1 3398
↨
→Take Profit 2 3392
BUY XAUUSD PRICE 3329 - 3331⚡️
↠↠ Stop Loss 3326
→Take Profit 1 3337
↨
→Take Profit 2 3343
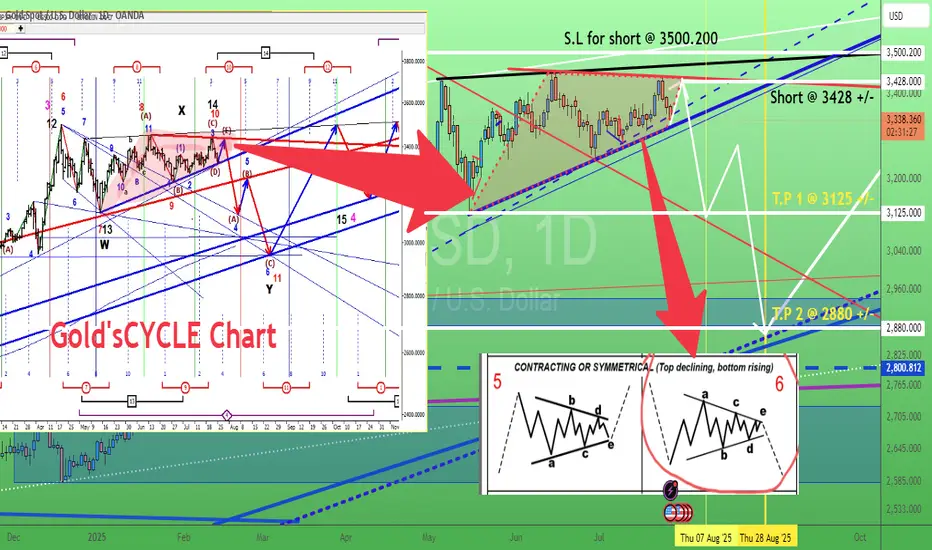
Gold - The clear top formation!🪙Gold ( TVC:GOLD ) just created a top formation:
🔎Analysis summary:
Over the past four months, Gold has overall been moving sideways. Following a previous blow-off rally of about +25%, this cycle is very similar to the 2008 bullish cycle. Bulls are starting to slow down which will most likely result in the creation of at least a short term top formation.
📝Levels to watch:
$3.000
🙏🏻#LONGTERMVISION
Philip - Swing Trader

Gold. Could this be the final "shape" of triangle? 26/July/25XAUUSD. back to previous ideas that we possible having a contracting /symmetrical triangle pattern on gold chart..Probarly a "big surprise" on 31 July FED/FOMC meeting?
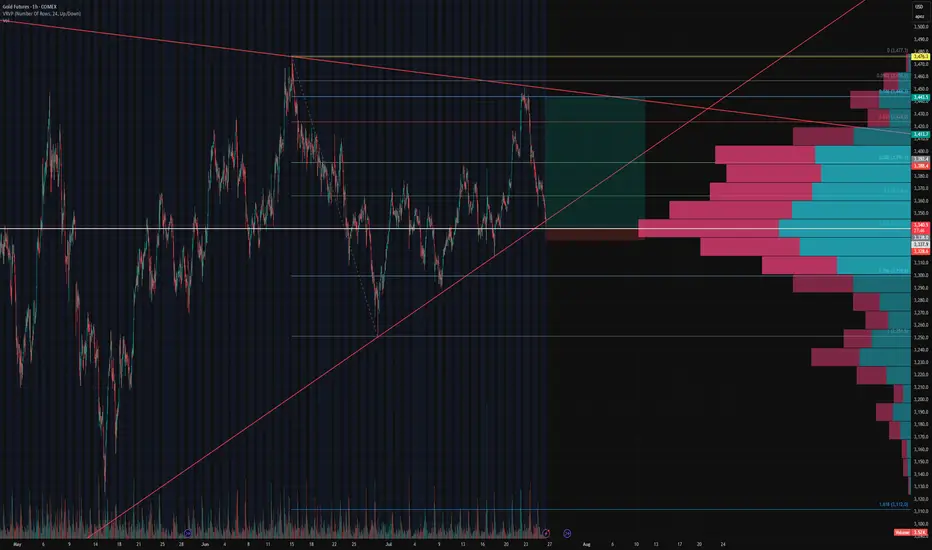
Gold Futures Update – 0.5 Fib Stop Hit, Eyes on 0.618 ConfluenceGold Futures Update – 0.5 Fib Stop Hit, Eyes on 0.618 Confluence
Our initial long setup at the 0.5 Fibonacci retracement level has been stopped out, but the structure remains constructive.
Price is now approaching a key confluence zone at $3,336 , where:
The 0.618 fib retracement from the recent swing low to high aligns perfectly,
The ascending trendline support (respected multiple times since May) intersects, and
The oint of Control (POC) from the visible volume profile shows dominant volume transacted.
This area represents a high-probability support level where bulls may attempt to defend again. We’re monitoring for reaction and potential entry signals around this level. A break below would invalidate the rising wedge structure and shift bias toward lower fib extensions.
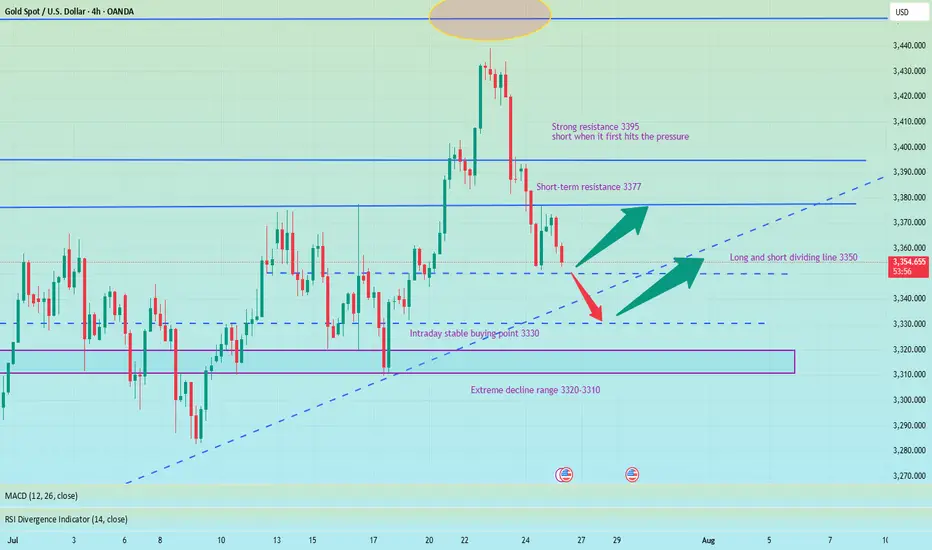
Wait for 3330 to buy the bottom and reduce unnecessary operation#XAUUSD
We have made good profits from short selling yesterday. Currently, gold has fallen to 3350📎. The 4HMACD death cross has increased in volume and is expected to continue to decline. Consider going long near 3330📈. I don’t think it is prudent to bottom out at 3340. Move forward steadily on Friday and reduce unnecessary operations⚖️.
🚀 BUY 3335-3330
🚀 TP 3345-3362
Be alert to new lows, pay attention to 3350 and go long at 3330📰 News information:
1. Tariff issues
2. Next week's NFP data
📈 Technical Analysis:
Last night, gold rebounded to only around 3377 before starting to fall back. Our judgment that the current rebound is weak is completely correct. 3350 is the support point of the bottoming out and rebounding to nearly $20 last night. Whether the European session can go down to 3350 will determine the trend of gold.
From the daily chart, the daily line has fallen for two consecutive days, suggesting that the price may continue to fall today. At present, we need to pay attention to this week's starting point of 3344-3345, and then the 3330 line below. The extreme decline is 3320-3310. At the same time, the narrowing of the daily Bollinger Bands is also paving the way for next week's NFP data.
From the 4H chart, the current MACD indicator crosses and increases in volume, and the middle track of the Bollinger Bands and SMA30 basically overlap near 3388. As for the hourly chart, the upper pressure is mainly concentrated near 3375-3377, which is also the high point of the rebound last night. If gold rebounds directly upward and encounters pressure and resistance at 3375-3385 for the first time, you can consider shorting and strictly implement stop loss.
Overall, if the current market falls to 3350-3345 for the first time and gets effective support, you can consider going long with a light position, defend 3340, and look to 3356-3362; if the decline is strong and continues to fall below 3350, the best stable long point for the day is 3330-3320, defend 3310, and earn $10-20 to leave the market.
🎯 Trading Points:
BUY 3350-3345
TP 3356-3362
BUY 3330-3320
TP 3345-3360
In addition to investment, life also includes poetry, distant places, and Allen. Facing the market is actually facing yourself, correcting your shortcomings, facing your mistakes, and exercising strict self-discipline. I share free trading strategies and analysis ideas every day for reference by brothers. I hope my analysis can help you.
TVC:GOLD PEPPERSTONE:XAUUSD FOREXCOM:XAUUSD FX:XAUUSD OANDA:XAUUSD FXOPEN:XAUUSD
XAUUSD: Market Analysis and Strategy for July 25Gold technical analysis:
Daily chart resistance 3400, support 3300
4-hour chart resistance 3375, support 3342
1-hour chart resistance 3350, support 3333.
Gold, starting from 3438 this Wednesday, has fallen by nearly $100. It rebounded quickly after falling to 3351 yesterday. After sideways fluctuations in the Asian session, the current price is around 3343, and the key support below is around 3333. From a spatial point of view, this wave of adjustment is nearing its end. After waiting for the adjustment to be completed, the market will most likely return to an upward trend.
The short-term top and bottom resistance at the 1-hour level is around 3351. For intraday short-term operations, the current gold price is around 3343. Pay attention to the bearish trend near 3351. If it does not break near 3333, it will be bullish again!
SELL: 3350near
BUY: 3333near
Gold 30Min Engaged ( Bullish & bearish Reversal Entry Detected )————-
➕ Objective: Precision Volume Execution
Time Frame: 30-Minute Warfare
Entry Protocol: Only after volume-verified breakout
🩸 Bullish Reversal : 3354
🩸 Bearish Reversal : 3378
➗ Hanzo Protocol: Volume-Tiered Entry Authority
➕ Zone Activated: Dynamic market pressure detected.
The level isn’t just price — it’s a memory of where they moved size.
Volume is rising beneath the surface — not noise, but preparation.
🔥 Tactical Note:
We wait for the energy signature — when volume betrays intention.
The trap gets set. The weak follow. We execute.
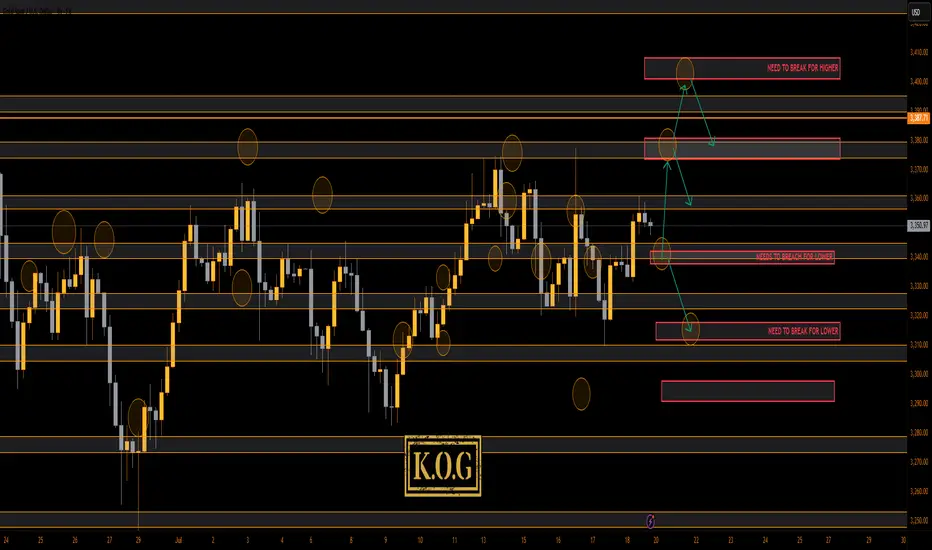
THE KOG REPORT THE KOG REPORT:
In last week’s KOG Report we said we would be looking for a price to attempt the higher level red box sitting around the 3370-75 region and if not breached, we felt an opportunity to short would be available from that region. We said if that failed and the move commenced, we would be looking at a complete correction of the move back down into the 3330-35 region, where we would then monitor price again in anticipation of a long from there or the extension level of 3310 which was also a red box short target (move complete). As you can see from the above, not only did we get that higher red box, we rejected, completed the move downside and then our traders managed to get that long trade all the way back up into the Excalibur target, red box targets and the hotspots shared in Camelot.
A decent week again, not only on Gold but also the numerous other pairs we trade, share targets on and analyse.
So, what can we expect in the week ahead?
For this week we can expect more ranging price action, but due to the previous range from last week being so tight, it looks like we’ll see a breakout coming in the latter part of the week unless there is news to bring us unexpected volume.
We have the key level below 3335-40 support and above that resistance and a red box sitting at 3375-80. This is the region that needs to watched for the break, and if broken we should hit the range high again at 3400-10. However, if rejected, we could again see this dip to attack that lower order region 3310-6 before attempting to recover.
Last week we wanted to see that curveball and although we did see some aggressive price action, I think we will see something extreme for this week. It’s that lower level 3310-6 that is a key region for bulls, if broken we can see a complete flush in gold taking us down into the 3250’s before we start the summer run. That for us would be the ideal scenario going into the month end, but, we’ll play it how we see and as usual, we go level to level and update any changes as we go along.
KOG’s Bias for the week:
Bullish above 3340 with targets above 3355, 3361, 3368, 3372 and above that 3385
Bearish below 3340 with targets below 3335, 3330, 3322, 3316, 3310 and below that 3304
RED BOX TARGETS:
Break above 3350 for 3355, 3361, 3367, 3375 and 3390 in extension of the move
Break below 3340 for 3335, 3330, 3320, 3310 and 3306 in extension of the move
Please do support us by hitting the like button, leaving a comment, and giving us a follow. We’ve been doing this for a long time now providing traders with in-depth free analysis on Gold, so your likes and comments are very much appreciated.
As always, trade safe.
KOG
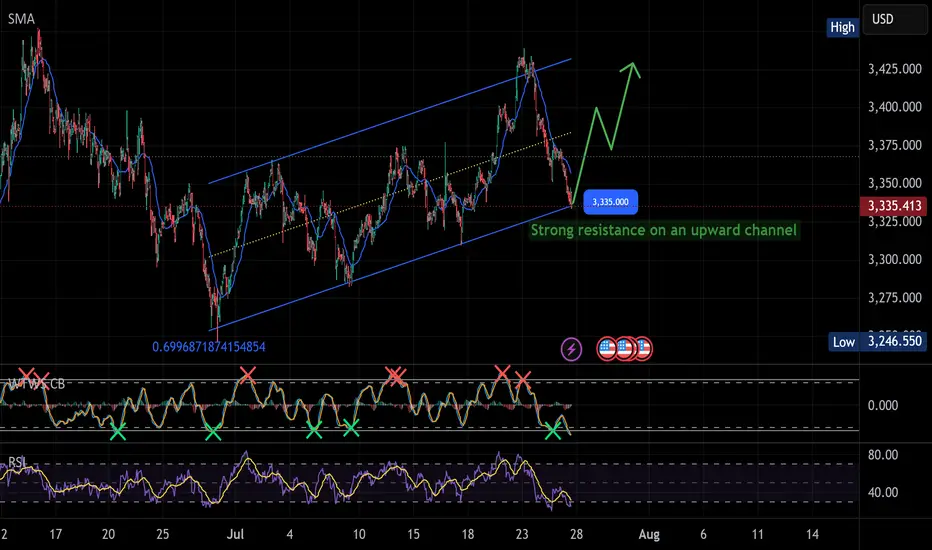
Gold is holding strong at support!GOLD – Bullish Bounce Coming? CAPITALCOM:GOLD
Gold is moving inside an upward channel.
A bounce is likely from $3,335 – eyes on $3,425 📈
Don’t miss the move. Let the market pay you! 💰
📈 If the bounce happens, price may rise toward:
Target 1: $3,375
Target 2: $3,425+
✅ Price just touched the bottom of the channel around $3,335 – a strong support area.
✅ RSI is oversold ➜ This usually means a bounce is coming.
✅ Momentum indicators are showing signs of bullish reversal.
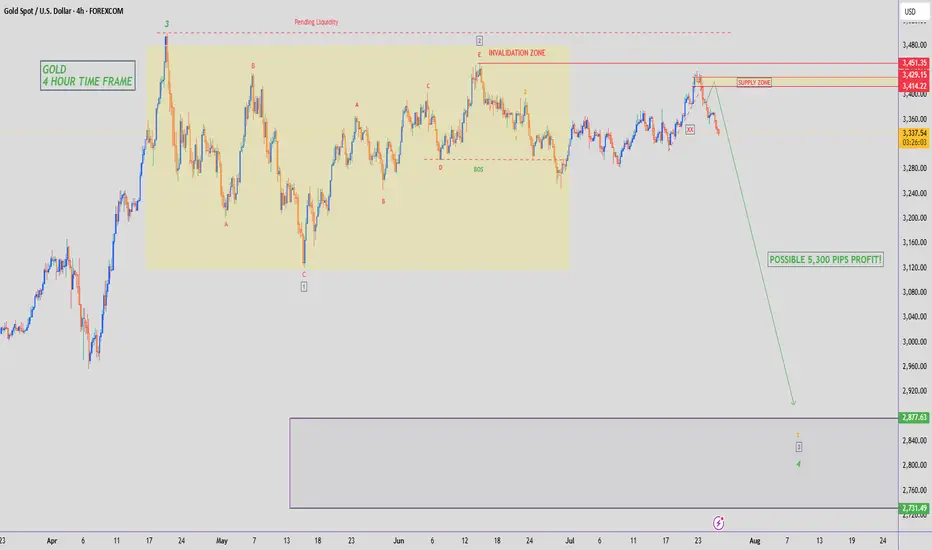
GOLD - SHORT TO $2,880 (UPDATE)Gold sellers have now pushed down to where price opened on Monday, turning the weekly candle bearish. A huge move down, compared to where price was at on Tuesday high!
R.I.P to those who bought the top. But this is what happens when you trade without a strategy or guidance⚰️
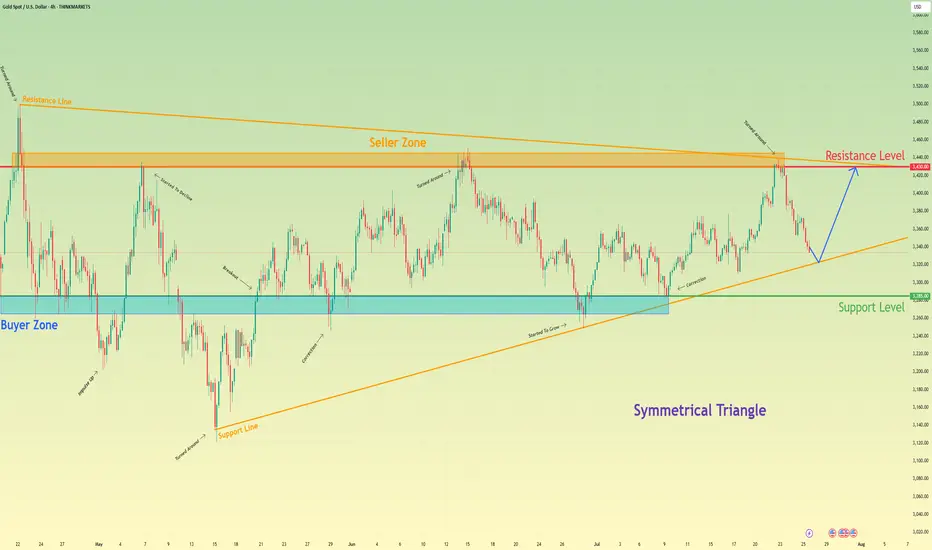
Gold will rebound from support line of triangle and rise to 3430Hello traders, I want share with you my opinion about Gold. Following a sequence of significant upward trends and the subsequent downward corrections that defined its range, gold has entered a broad market zone of consolidation. This battleground is clearly anchored by the historically significant buyer zone around 3285 and a formidable seller zone near 3430. Currently, the asset's price action is coiling and contracting within the confines of a large symmetrical triangle, a classic pattern that signifies a period of equilibrium and energy build-up before a potential high-volatility breakout. After a recent upward rebound was decisively rejected by the upper resistance line, the price is now in a corrective descent, heading towards the crucial ascending support line of the triangle. The primary working hypothesis is a long scenario, which is based on the expectation that this downward move will find strong buying interest on this key trendline, respecting the pattern's integrity. A confirmed and strong bounce from this level would signal another complete upward rotation within the triangle is underway. Therefore, the tp is logically and strategically set at the 3430 resistance level, as it not only aligns with the formation's upper boundary but also represents the major seller zone, a natural magnet for price on such a rebound. Please share this idea with your friends and click Boost 🚀
Disclaimer: As part of ThinkMarkets’ Influencer Program, I am sponsored to share and publish their charts in my analysis.
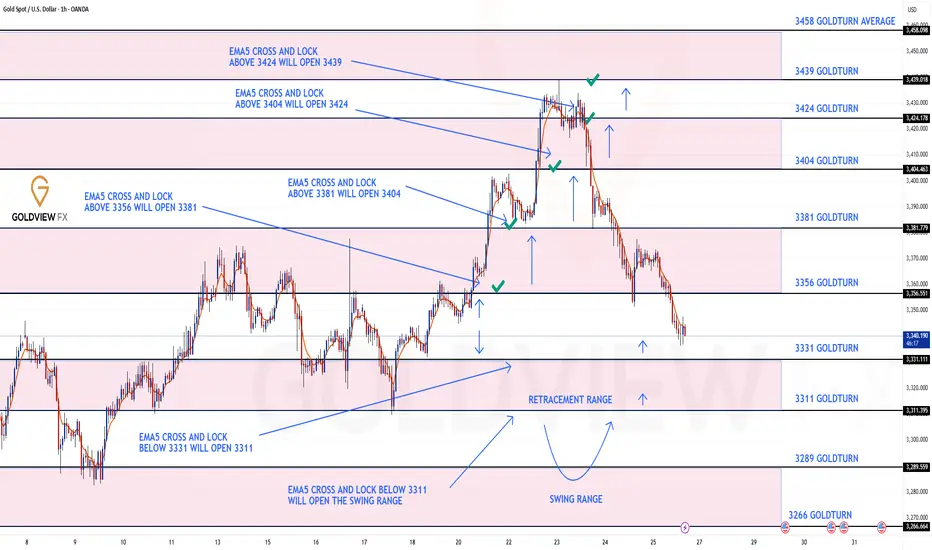
GOLD 1H CHART ROUTE MAP UPDATEHey Everyone,
Great finish to the week with our chart ideas playing out, as analysed.
We completed all our Bullish targets on this chart with ema5 cross and lock confirmation. We were also able to step away today after the final target with no further ema5 cross and lock, confirming the rejection that we are seeing now.
BULLISH TARGET
3356 - DONE
EMA5 CROSS AND LOCK ABOVE 3356 WILL OPEN THE FOLLOWING BULLISH TARGETS
3381 - DONE
EMA5 CROSS AND LOCK ABOVE 3381 WILL OPEN THE FOLLOWING BULLISH TARGET
3404 - DONE
EMA5 CROSS AND LOCK ABOVE 3404 WILL OPEN THE FOLLOWING BULLISH TARGET
3424 - DONE
EMA5 CROSS AND LOCK ABOVE 3424 WILL OPEN THE FOLLOWING BULLISH TARGET
3439 - DONE
We will now come back Sunday with a full multi timeframe analysis to prepare for next week’s setups, including updated views on the higher timeframes, EMA alignments, and structure expectations going forward.
Thanks again for all your likes, comments, and follows.
Wishing you all a fantastic weekend!!
Mr Gold
GoldViewFX