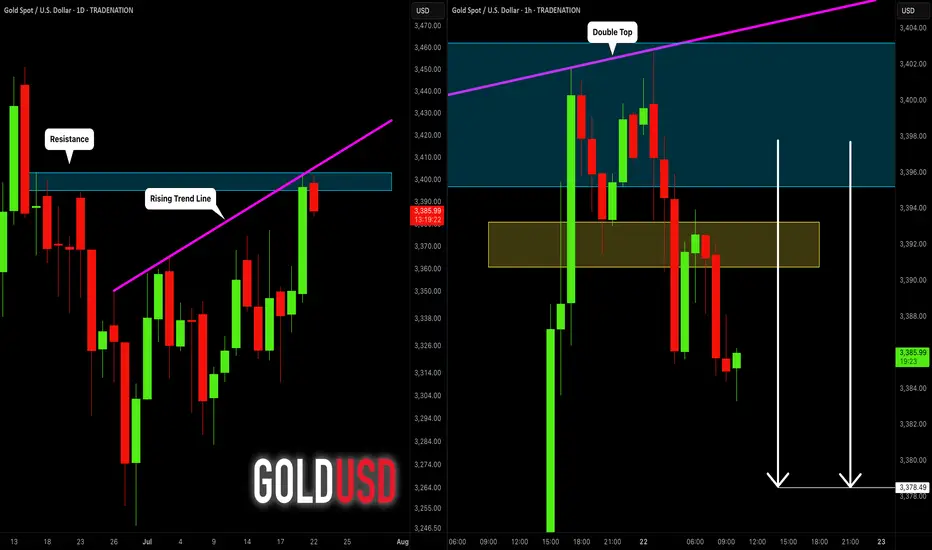
GOLD (XAUUSD): Bearish Move From Resistance Confirmed
Gold tested a significant confluence cluster on a daily time frame
that is based on a rising trend line and a horizontal resistance.
A double top formation on that on an hourly time frame indicates
a highly probable retracement from that.
Goal - 3378.5
❤️Please, support my work with like, thank you!❤️
I am part of Trade Nation's Influencer program and receive a monthly fee for using their TradingView charts in my analysis.
Gold
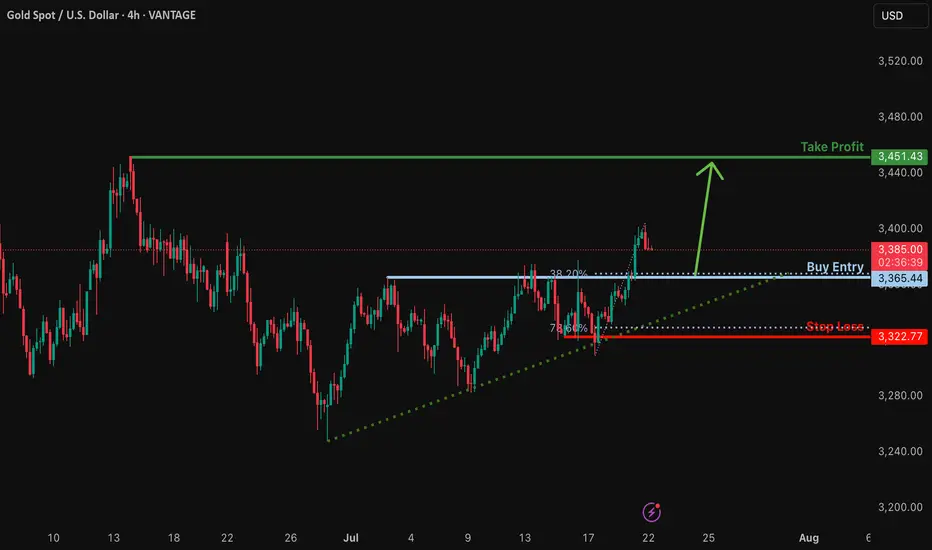
Bullish bounce off major support?The Gold (XAU/USD) is falling towards the support level which is a pullback support and could bounce from this level to our take profit.
Entry: 3,365.44
Why we like it:
There is a pullback support that lines up with the 38.2% Fibonacci retracement.
Stop loss: 3,322.77
Why we like it:
There is a pullback support that is slightly below the 78.6% Fibonacci retracement.
Take profit: 3,451.43
Why we like it:
There is a pullback resistance.
Enjoying your TradingView experience? Review us!
Please be advised that the information presented on TradingView is provided to Vantage (‘Vantage Global Limited’, ‘we’) by a third-party provider (‘Everest Fortune Group’). Please be reminded that you are solely responsible for the trading decisions on your account. There is a very high degree of risk involved in trading. Any information and/or content is intended entirely for research, educational and informational purposes only and does not constitute investment or consultation advice or investment strategy. The information is not tailored to the investment needs of any specific person and therefore does not involve a consideration of any of the investment objectives, financial situation or needs of any viewer that may receive it. Kindly also note that past performance is not a reliable indicator of future results. Actual results may differ materially from those anticipated in forward-looking or past performance statements. We assume no liability as to the accuracy or completeness of any of the information and/or content provided herein and the Company cannot be held responsible for any omission, mistake nor for any loss or damage including without limitation to any loss of profit which may arise from reliance on any information supplied by Everest Fortune Group.
Gold rallies to 4-week high as dollar and yields tumbleHello traders, what are your thoughts on gold today?
Gold prices are heating up again in the global market as the US dollar weakens and Treasury yields drop. At the time of writing, gold has surged by 50 dollars, reaching 3,390 USD per ounce — its highest level in four weeks.
The sharp decline in the US dollar is one of the main drivers behind gold’s impressive rally. The USD Index, which had risen significantly last week, lost momentum and fell sharply in overnight trading. Meanwhile, the yield on 10-year US Treasury bonds has dropped to around 4.3%, down from recent highs, increasing gold's appeal as a non-yielding asset.
Market sentiment is also being shaped by broader macroeconomic factors. Crude oil futures have dipped slightly, trading around 67 USD per barrel, reflecting investor caution amid global economic uncertainty. These combined forces have created a favorable environment for gold's strong upward movement.
If the dollar continues to weaken and bond yields remain low, gold could sustain its bullish trend. However, traders should remain alert to potential volatility driven by upcoming US Federal Reserve policy moves and key economic data releases, such as inflation reports and GDP growth figures, which may impact gold's trajectory.

Gold 22 July 2025 updateGood afternoon, update to last week's post of 21 July on gold, which worked yesterday, new zone to buy, the chart shows everything in detail, so today with the message "brevity is the sister of talent"
#GOLD
BUY LIMIT ZONE 3365-3370
🎯 TP1: 3385
🎯 TP2: 3400
🎯 TP3: 3412
🎯 TP3: 3428
⛔️ Stop loss: 3355
Regards, Totoshka™

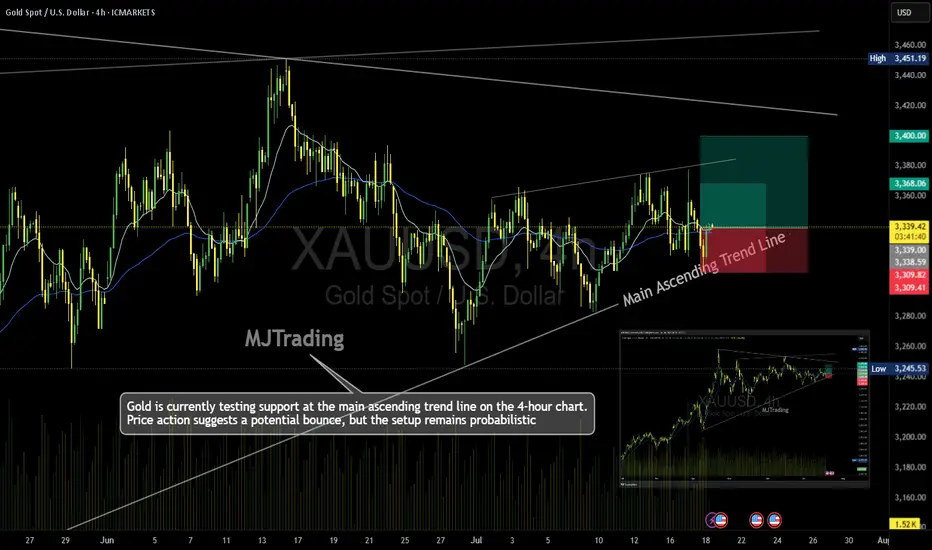
Gold (XAU/USD) – 4H Time Frame Trade Idea📈MJTrading:
Gold is currently testing support at the main ascending trend line on the 4-hour chart. Price action suggests a potential bounce, but the setup remains probabilistic—ideal for traders who operate on higher time frames and manage risk with discipline.
🔹 Trade Setup
Entry: 3340
Stop Loss: 3309
Take Profit 1: 3368
Take Profit 2: 3400
🔍 Technical Context
Price is respecting the long-standing trend line, hinting at bullish continuation.
Risk-reward ratio is favorable, especially for swing traders.
A break below the trend line invalidates the setup—hence the tight SL.
⚠️ Note: While the trend supports upside potential, failure to hold the trend line could trigger deeper retracement. Trade the probabilities, not the certainties.
In case it's not shown properly on your monitor because of different resolutions:
Psychology Always Maters:
#MJTrading #Gold #XAUUSD #Trend #Trendline #Forex #Chart #ChartAnalysis #Buy #Long
Gold Approaches 3,370 Resistance – Watch for Short-Term PullbackIn the July 21st trading session, gold (XAUUSD) on the H1 timeframe continues to push higher and is now testing a key resistance zone around 3,370 USD, which aligns with the 3.618 Fibonacci extension level. This zone is considered a high-probability area for profit-taking after a strong rally from the 3,308–3,310 USD support zone (aligned with the 0.5 and 0.618 Fibonacci retracement levels). The short-term bullish structure remains intact as long as price stays above the rising trendline from July 18th, with dynamic support currently sitting near 3,350 USD.
From a price action perspective, the latest candles are showing upper wicks near the 3,370 resistance, suggesting early signs of selling pressure. If combined with an overbought RSI condition (often seen in such extended moves), this increases the probability of a short-term retracement.
Key intraday levels to watch:
– Resistance: 3,370.43 (Fibonacci 3.618 extension)
– Dynamic Support: 3,350 (ascending trendline)
– Major Support: 3,310 – 3,308 (Fibonacci 0.618 – 0.5)
– Trend Reversal Level: 3,298.21 (recent swing low)
XAUUSD Trading Strategy for Today:
Primary Scenario – Short Setup near 3,370 if bearish confirmation appears:
Entry: 3,370 – 3,372
Stop Loss: 3,378
Take Profit: 3,350 → 3,330 → 3,310
Alternative Scenario – Buy the dip at trendline support if bullish price action confirms:
Entry: 3,350
Stop Loss: 3,340
Take Profit: 3,370 → 3,380+
In summary, gold is trading at a critical short-term resistance zone. A rejection from 3,370 could trigger a healthy correction toward support zones, while a clean breakout above it would signal strength and open the path toward 3,380–3,390. Traders should stay alert and wait for clear confirmation before entering positions.
Follow for daily gold strategies and save this post if you found it useful for your trading setup.

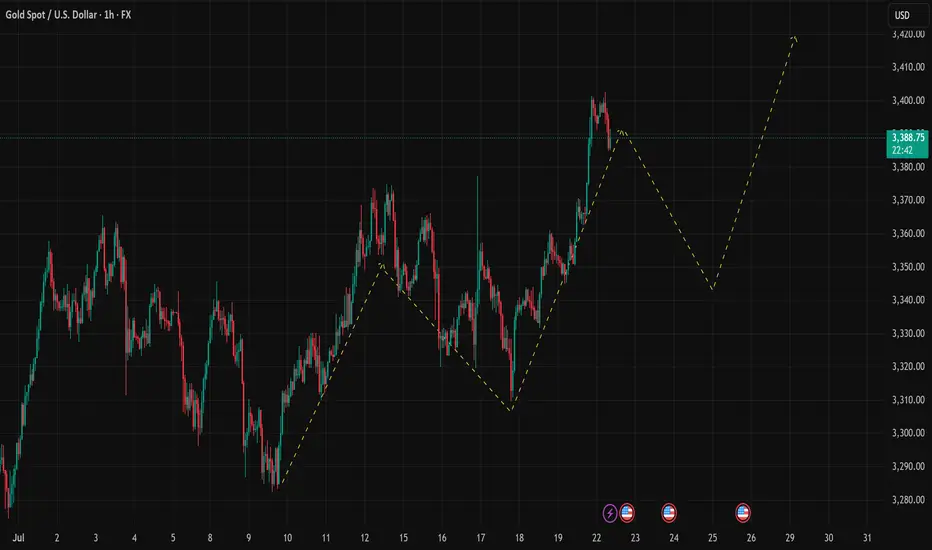
XAUUSD Continues Bullish Structure With Key Retracement OpportunTechnical Outlook – 22/07/2025
On the 1-hour chart, XAUUSD is maintaining a clear bullish market structure with a sequence of higher highs and higher lows. The projected price path drawn on the chart suggests a potential retracement before a continuation toward the 3,420 USD region. Let’s break down the key technical zones and strategies for today:
Key Levels to Watch
Immediate Resistance: 3,390 – 3,400 USD
This is the recent high. A breakout above this area could trigger momentum toward the projected 3,420 USD extension.
Support Zone: 3,345 – 3,350 USD
This zone aligns with the potential pullback as illustrated on the chart, offering a high-probability buy-the-dip opportunity. It coincides with previous structure resistance now turned support.
Trendline Support: The ascending yellow trendline has been respected multiple times and should act as dynamic support on any intraday retracements.
Indicators & Tools Used
EMA: Price is currently trading above the short-term EMA (not shown), suggesting intraday bullish bias remains intact.
RSI (Recommended Use): Look for RSI near 40–50 on the pullback for confluence at support.
Fibonacci Tool (suggested): If measuring from the swing low near 3,320 to the high of 3,390, the 0.618 Fib lies close to 3,345 – an ideal area to look for long entries.
Suggested Trading Strategies
🔹 Buy the Dip Strategy:
Wait for a corrective move into the 3,345–3,350 area. Confirm with bullish reversal candles or RSI support, then enter long targeting 3,400–3,420. Stop-loss ideally below 3,335 (structure break).
🔹 Breakout Continuation Strategy:
If price breaks cleanly above 3,390 with volume, a momentum trade toward 3,410–3,420 is viable. Use tight trailing stops to protect gains.
🔹 Avoid chasing highs – Patience at support zones or confirmation above resistance will offer better reward/risk setups.
Conclusion
Gold is respecting bullish market behavior on the 1H chart, and while a short-term correction is expected, the broader trend favors upside continuation. The 3,345–3,350 area will be critical for today's trading decisions.
Remember to follow for more updates and strategy insights. Save this post if you find it useful.
If you’d like, I can also add a version using RSI or Fib levels directly plotted. Let me know.
Falling towards pullback support?The Gold (XAU/USD) is falling towards the pivot which has been identified as a pullback support and could bounce to the 1st resistance.
Pivot: 3,365.52
1st Support: 3,322.94
1st Resistance: 3,434.64
Risk Warning:
Trading Forex and CFDs carries a high level of risk to your capital and you should only trade with money you can afford to lose. Trading Forex and CFDs may not be suitable for all investors, so please ensure that you fully understand the risks involved and seek independent advice if necessary.
Disclaimer:
The above opinions given constitute general market commentary, and do not constitute the opinion or advice of IC Markets or any form of personal or investment advice.
Any opinions, news, research, analyses, prices, other information, or links to third-party sites contained on this website are provided on an "as-is" basis, are intended only to be informative, is not an advice nor a recommendation, nor research, or a record of our trading prices, or an offer of, or solicitation for a transaction in any financial instrument and thus should not be treated as such. The information provided does not involve any specific investment objectives, financial situation and needs of any specific person who may receive it. Please be aware, that past performance is not a reliable indicator of future performance and/or results. Past Performance or Forward-looking scenarios based upon the reasonable beliefs of the third-party provider are not a guarantee of future performance. Actual results may differ materially from those anticipated in forward-looking or past performance statements. IC Markets makes no representation or warranty and assumes no liability as to the accuracy or completeness of the information provided, nor any loss arising from any investment based on a recommendation, forecast or any information supplied by any third-party.

Latest Gold Price Update TodayHello everyone, what do you think about the price of gold today?
As the new week begins, gold continues the upward trend started at the end of Friday’s session. As of now, the precious metal is trading around 3356 USD, with the uptrend still being supported.
From a carefully analyzed technical perspective, gold successfully broke out of the downward channel, taking advantage of the weakening USD. The price increase is convincing in the short term, especially after testing and confirming the previous breakout as a new support zone (around 3345 USD).
The upward target is expected to continue, with key levels to watch being 3372 USD and the H4 resistance at 3390 USD.
What do you think about the price of gold today? Feel free to share your thoughts in the comments!
Good luck!

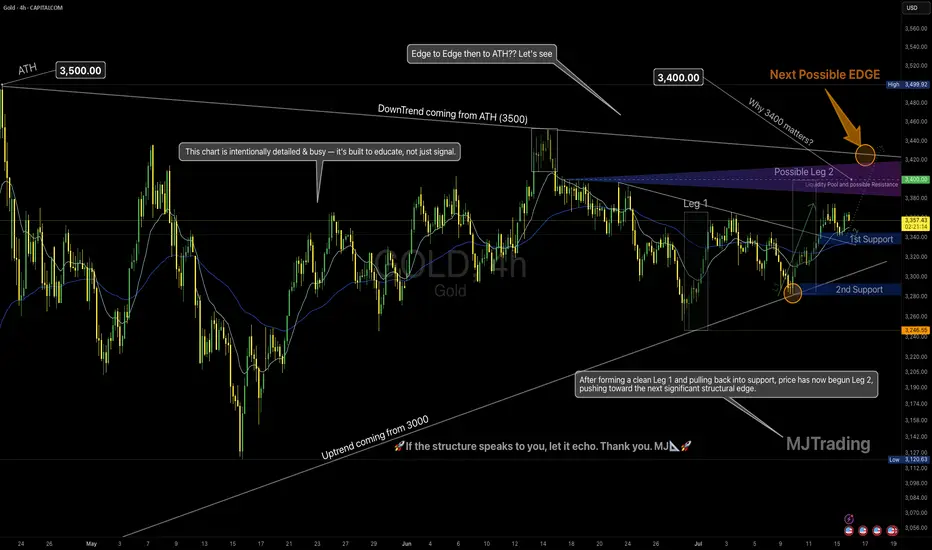
Leg 2 in Progress? | All Eyes on the Possible EDGE around 3400💡 GOLD 4H – MJTrading:
After forming a clean Leg 1 followed by a technical pullback into support, Gold has initiated Leg 2, pushing upward toward the next possible EDGE: 3400.
🟠 Why 3400 Matters
This zone is not just a round number:
It aligns with the long-term downtrend coming from the ATH (3500)
It’s the last reaction high before a deeper correction
There’s likely liquidity resting above — it’s where smart money may make decisions
This is where structure and psychology meet.
And end of 2 possible 2nd leg...
🔄 Possible Scenarios:
🟥 Scenario A – Rejection from the Edge (if could reach):
A reaction from this zone could lead to a pullback toward:
1st Support around 3340-3360
2nd Support near 3250 (also the uptrend line from 3000)
Use these zones to reassess momentum.
🟩 Scenario B – Breakout Above 3400:
A clean break above this structural edge opens the path for:
An “Edge to Edge” move back toward ATH (3500)
Possible higher timeframe trend shift — especially if retest holds
🧠 Our Strategy
We’re long-biased into the edge, not beyond it yet.
Let 3400 show its hand — we stay adaptive, not predictive.
🔍 This chart is intentionally detailed — it's built to educate, not just signal.
Focus on structure, sequence, and behavior — not just levels.
Lets Zoom in around the Breakout area...
And a Zoomout to Daily...
🧭 “If the structure speaks to you, let it echo.”
– MJTrading 🚀
📍#Gold #XAUUSD #TradingView #TechnicalAnalysis #ChartDesigner #MJTrading #MarketStructure #ForexIdeas #Edge
July 21 Special Update : Metals, SPY & More. What's Next.This special update is to highlight why I continue to believe traders should stay very cautious of this rally in the SPY/QQQ/BTCUSD.
Underlying economic data suggest that this is one big speculative rally following the April Tariff collapse.
And, the economic data I see from my custom indexes suggests the markets are moving into a very volatile and potentially dangerous topping pattern.
As I've stated many times in this video. I'm not saying the markets have topped and you should SELL EVERYTHING. I'm suggesting this market is extremely over-valued in terms of the underlying risk factors at play and the very clear data that suggests the markets are already in a recessionary price trend.
You may ask, "How can the markets continue to rally like this in a moderate recession?".
The answer is simple.
All bubbles end with a super-speculative phase. This phase is where everyone piles into a euphoric attempt to ride the rally higher.
It happened in the late 1990s. It has happened again through the 2000-2005+ housing bubble. Heck, it has occurred in the collectors market over the past few decades where people spent fortunes on the "hottest items" (think Beanie-Babies) only to find out they bought at the height of the bubble.
That is why I continue to urge traders to remain cautious and to withdraw profits from this speculative rally phase. Protect your investment capital immediately and consider the risks associated with the information I share in this video.
I'm not trying to scare anyone. I'm just trying to be realistic in terms of what I see in my data and why I believe now is the best time to MOVE TO SAFETY.
My data suggests that the markets are about to enter a fragile and potentially dangerous pullback phase. If you want to ride it out - go for it.
Otherwise, prepare for significant volatility over the next six months or more.
Get some.
#trading #research #investing #tradingalgos #tradingsignals #cycles #fibonacci #elliotwave #modelingsystems #stocks #bitcoin #btcusd #cryptos #spy #gold #nq #investing #trading #spytrading #spymarket #tradingmarket #stockmarket #silver

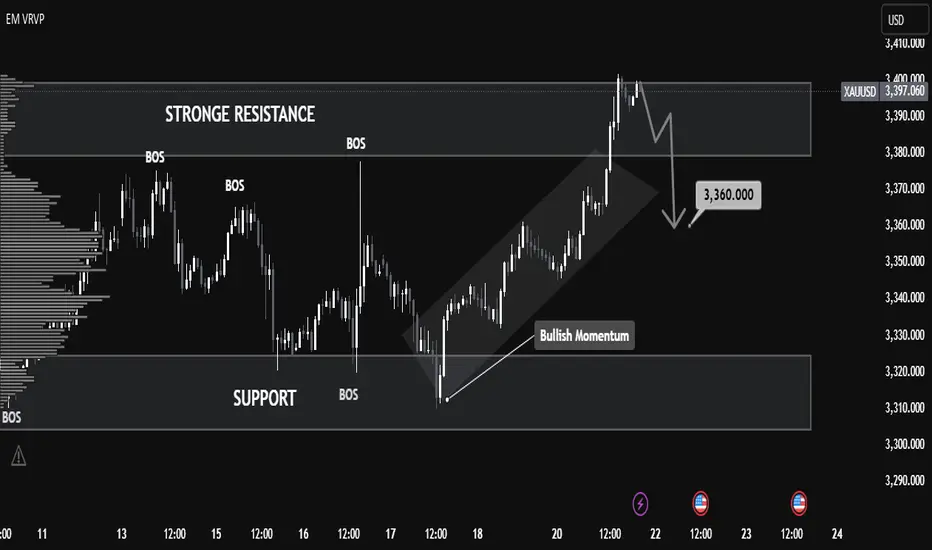
XAUUSD Analysis – Smart Money Perspective XAUUSD Analysis – Smart Money Perspective
🧠 Market Structure & BOS (Break of Structure):
The chart clearly shows multiple Break of Structure (BOS), confirming bullish intent.
After the final BOS around 3,370, price aggressively broke above resistance, forming a new high at 3,397.
This indicates bullish market momentum backed by strong demand.
🔎 Key Zones Identified:
🔼 Strong Resistance (3,390 – 3,400 Zone)
This level has been tested and now shows potential exhaustion, possibly trapping late buyers.
Price currently rejecting this zone with a bearish reaction.
🔽 Support Zone (3,300 – 3,320)
Prior consolidation and BOS originate from here.
Strong bullish OB and demand lie here—key area for future long setups.
📉 Expected Short-Term Move:
The projection arrow indicates a potential retracement toward 3,360, a previous BOS + potential FVG area.
This aligns with Smart Money's tendency to rebalance inefficiencies before continuation.
🔺 Volume Analysis (VRVP - Volume Profile):
Notice how high volume nodes align with the support and resistance zones.
Price is currently sitting in a low-volume gap, supporting the idea of a retracement to a more balanced area.
⚡ Momentum Shift Signal:
The steep angle of the last move up suggests possible liquidity grab above resistance.
Expectation: Price may dip to mitigate demand or OB before resuming the uptrend.
✅ Conclusion:
This chart illustrates a textbook SMC scenario:
Bullish BOS confirms structure shift.
Liquidity sweep above resistance may lead to a retracement.
3,360 is a key price point to watch for FVG fills or bullish continuation.
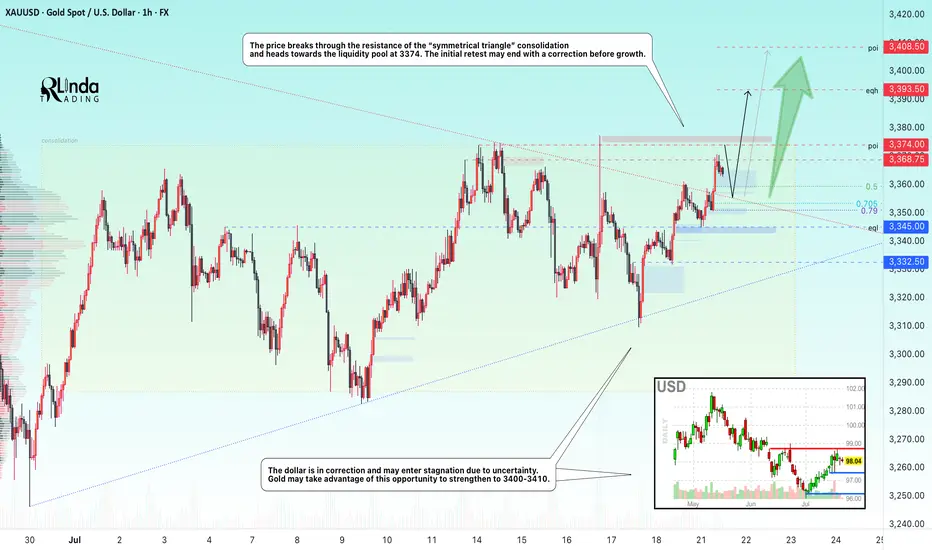
GOLD → Breakthrough accumulation. Correction before growthFX:XAUUSD has been strengthening since the session opened and is heading towards the 3374 zone of interest. The price has previously broken through the consolidation resistance and may test this boundary before moving further.
Gold is rising amid trade risks and dollar weakness. After falling to $3310, gold resumed its growth, seeking to break through the $3368 level. Support for prices was provided by uncertainty surrounding Trump's tariff policy and expectations for Fed Chairman Powell's speech. The US dollar weakened temporarily as investors sought refuge in gold amid trade disputes with the EU, political instability in Japan, and criticism of the Fed from the White House.
Technically, the price is in a realization phase after breaking out of consolidation, but it has encountered resistance at 3368, which could lead to a correction. The focus is on the 3350-3355 zone. If the bulls hold their ground above this zone, the market may return to the realization phase.
Resistance levels: 3368, 3374
Support levels: 3345, 3332
The market is bullish and feels support, especially against the backdrop of a weak dollar. Traders are watching Trump and Powell. If the latter decides to cut rates, for example tomorrow at 12:30 GMT, gold could rally...
Technically, gold could test 3350 before rising.
Best regards, R. Linda!
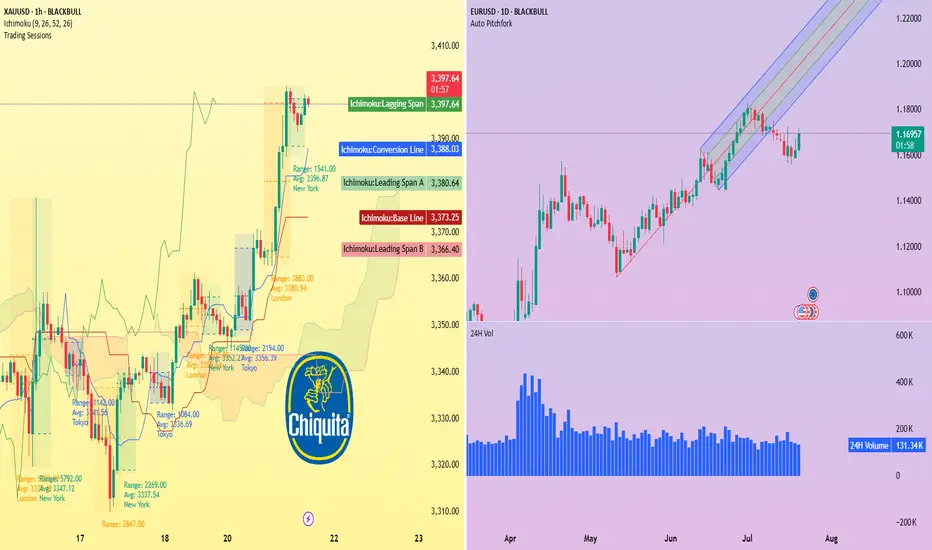
Banana republic fears, gold tests $3,400Traders now price in a 60% chance of a Fed rate cut in September, as political pressure on the central bank intensifies.
Republican Rep. Anna Paulina Luna has officially accused Fed Chair Powell of perjury, while Treasury Secretary Scott Bessent has called for a full inquiry into the institution.
Earlier this month, former Fed Chair Janet Yellen told The New Yorker that these actions “...are the ones one expects from the head of a banana republic that is about to start printing money to fund fiscal deficits.”
Amid this backdrop, gold surged past $3,390 per ounce. The 1-hour XAU/USD chart shows strong bullish momentum supported by the Ichimoku cloud: price is well above the cloud with a clean breakout and lagging span confirmation. Immediate resistance sits at $3,400, with a potential extension toward $3,440–$3,450 if bullish pressure holds.
Meanwhile, EUR/USD remains in an uptrend on the daily chart, bouncing from pitchfork support. A sustained move above 1.1700 could reopen the path toward 1.1800+.
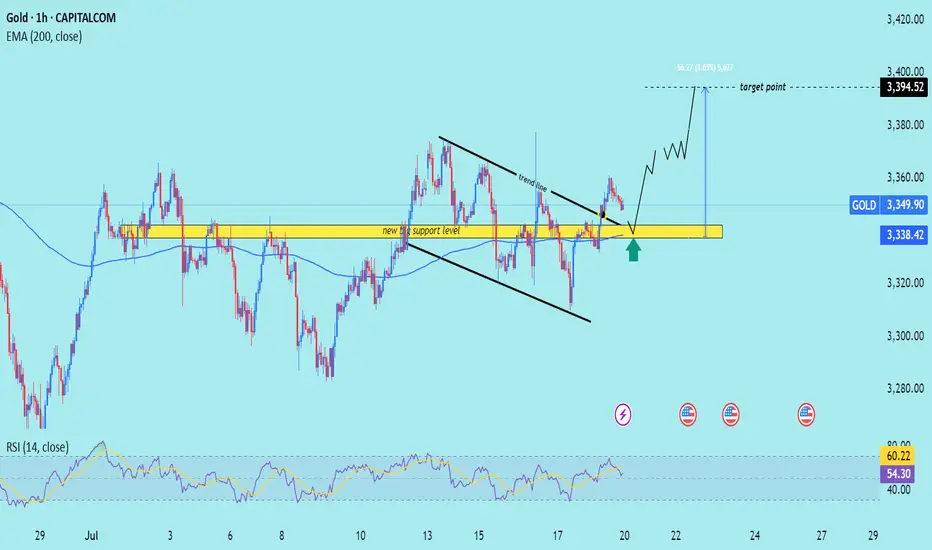
XAU/USD) Bullish trend analysis Read The captionSMC Trading point update
Technical analysis of XAU/USD (Gold) on the 1-hour timeframe. Here’s a breakdown
---
Technical Analysis Summary
Descending Channel Breakout
Price action previously formed a descending wedge/channel, shown by the two black trendlines.
A bullish breakout occurred above the trendline, signaling a shift in momentum from bearish to bullish.
Key Support Zone
The yellow highlighted zone (around $3,338–$3,340) is marked as the “new key support level”.
Price is expected to retest this area (confluence with 200 EMA), which aligns with standard bullish breakout behavior.
The green arrow indicates potential bounce confirmation.
Bullish Projection
After the retest, price is projected to climb steadily toward the target point at $3,394.52.
The setup anticipates around 56.27 points upside, or roughly +1.69% gain from the support zone.
---
Target
$3,394.52 – defined using the previous range breakout height and horizontal resistance.
---
Trade Idea
Entry: On bullish confirmation near $3,338 support zone.
Stop Loss: Just below the yellow zone (e.g., under $3,330).
Take Profit: Near $3,394.
Mr SMC Trading point
---
Conclusion
This is a classic breakout-retest-play, supported by trendline structure, a key horizontal support zone, and RSI strength. As long as price respects the highlighted support, the bullish outlook remains valid.
Please support boost 🚀 this analysis)
Accurate prediction, continue to buy after retracement to 3353📰 News information:
1. The Trump administration puts pressure on the Federal Reserve to cut interest rates
2. The continued impact of tariffs and the responses of various countries
📈 Technical Analysis:
Gold is currently rising rapidly, reaching a high near 3368, and the overall bullish trend has not changed yet. It is not recommended to continue chasing the highs at present. Those who are long at 3345 can consider exiting the market with profits. The technical indicators are close to the overbought area and there is a certain risk of a correction. Be patient and wait for the pullback to provide an opportunity. At the same time, 3353 has become the position with relatively large trading volume at present, and the top and bottom conversion in the short term provides certain support for gold longs. If it retreats to 3355-3345, you can consider going long again, with the target at 3375-3385. If it falls below 3345, look to 3333, a second trading opportunity within the day. If it falls below again, it means that the market has changed, and you can no longer easily chase long positions.
🎯 Trading Points:
BUY 3355-3345
TP 3375-3385
In addition to investment, life also includes poetry, distant places, and Allen. Facing the market is actually facing yourself, correcting your shortcomings, facing your mistakes, and exercising strict self-discipline. I share free trading strategies and analysis ideas every day for reference by brothers. I hope my analysis can help you.
FXOPEN:XAUUSD OANDA:XAUUSD FX:XAUUSD FOREXCOM:XAUUSD PEPPERSTONE:XAUUSD TVC:GOLD

XAUUSD 15m trade possibilitty 7/21/25This is what I'm looking at for the short term after the recent rally.
I'm targeting the green area for buys because that was the last consolidation and breakout zone.

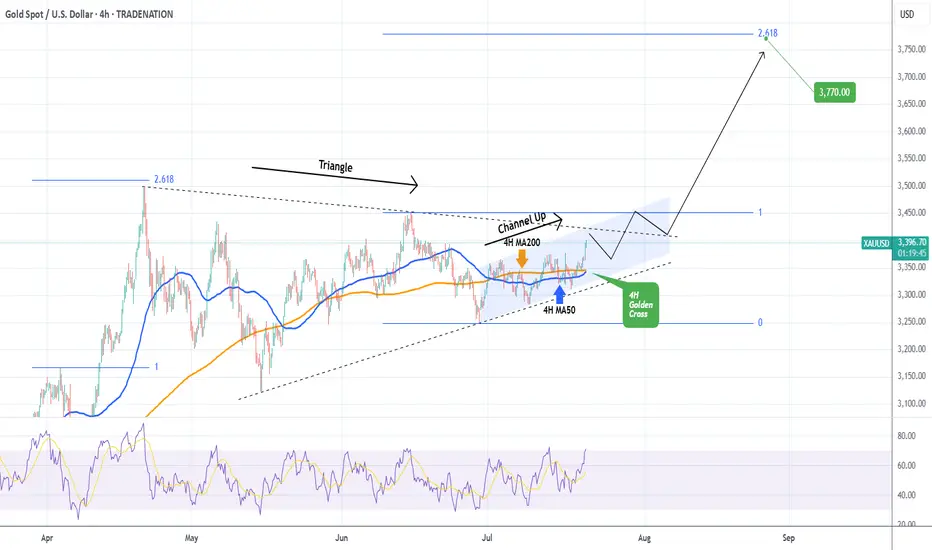
XAUUSD 4H Golden Cross preparing a massive break-out.Gold (XAUUSD) has been trading on a 3-week Channel Up, which is approaching its top but at the same time, it's been trading within a 3-month Triangle, which is also approaching its top.
The key here is the formation today of a Golden Cross on the 4H time-frame, the first since May 28. Being at the end of the long-term Triangle pattern is technically translated to the structure's tendency to look for a decisive break-out above its top that attracts volume (buyers).
It is possible to see an initial rejection followed by a break-out that will re-test the top of the Triangle as Support and then follow the long-term trend dynamics. Those are technically bullish and previous break-out in April targeted the 2.618 Fibonacci extension. Our Target remains a little below it at $3770.
-------------------------------------------------------------------------------
** Please LIKE 👍, FOLLOW ✅, SHARE 🙌 and COMMENT ✍ if you enjoy this idea! Also share your ideas and charts in the comments section below! This is best way to keep it relevant, support us, keep the content here free and allow the idea to reach as many people as possible. **
-------------------------------------------------------------------------------
Disclosure: I am part of Trade Nation's Influencer program and receive a monthly fee for using their TradingView charts in my analysis.
💸💸💸💸💸💸
👇 👇 👇 👇 👇 👇
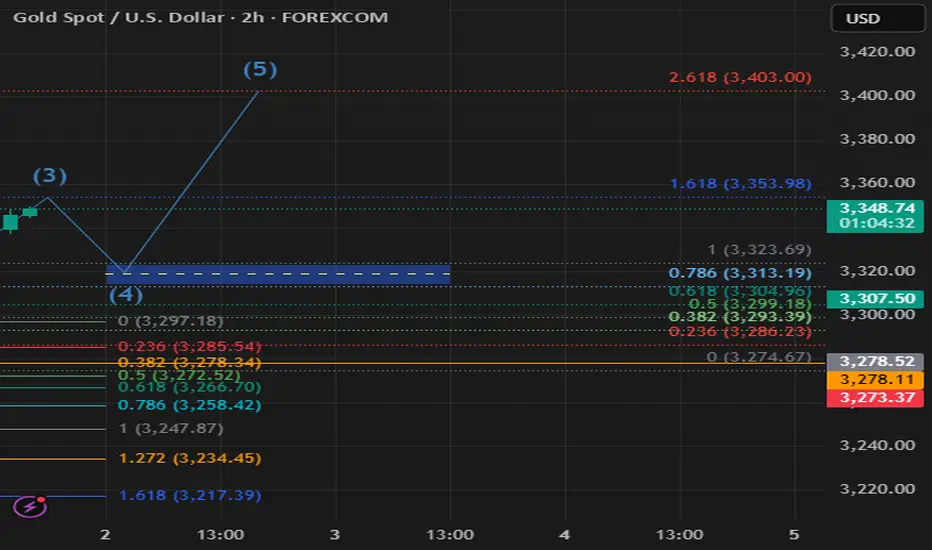
XAU/USD Start July 20251. i start after XAU/USD break previous High and correction (fibbo 32.0) respected. based on elliot wave strategy we can targeting end of wave 3 at 3353 area and than correction wave 4 (target at fibbo 32.0 - 50.0). after target correction, continue wave 5 at target 3403 area.
2. fundamentally speaking, new months new quarter. there ins't new catalist and sentiment. Macro Economic this week focus on labour market at US and FED projection to cut rate.
3. War at Iran and Israel, Russia and Ukraine, India and Pakistan, Trade War case, etc,.
4. Will be update
GOLD - Price can rise to resistance line of wedgeHi guys, this is my overview for XAUUSD, feel free to check it and write your feedback in comments👊
The price has been trading within a large ascending wedge for an extended period.
The asset found significant support near the lower trendline of this formation, specifically in the 3205 - 3187 price area.
From that support, the price initiated a sustained upward movement back towards the upper parts of the structure.
Currently, XAU is facing a key horizontal resistance zone located between 3375 and 3390 points.
The price is actively attempting to break through this area, which has historically served as a critical pivot point.
I expect that once the price firmly breaks and consolidates above this resistance, it will continue its growth towards the upper boundary of the wedge, targeting the $3475 level.
If this post is useful to you, you can support me with like/boost and advice in comments❤️
Disclaimer: As part of ThinkMarkets’ Influencer Program, I am sponsored to share and publish their charts in my analysis.

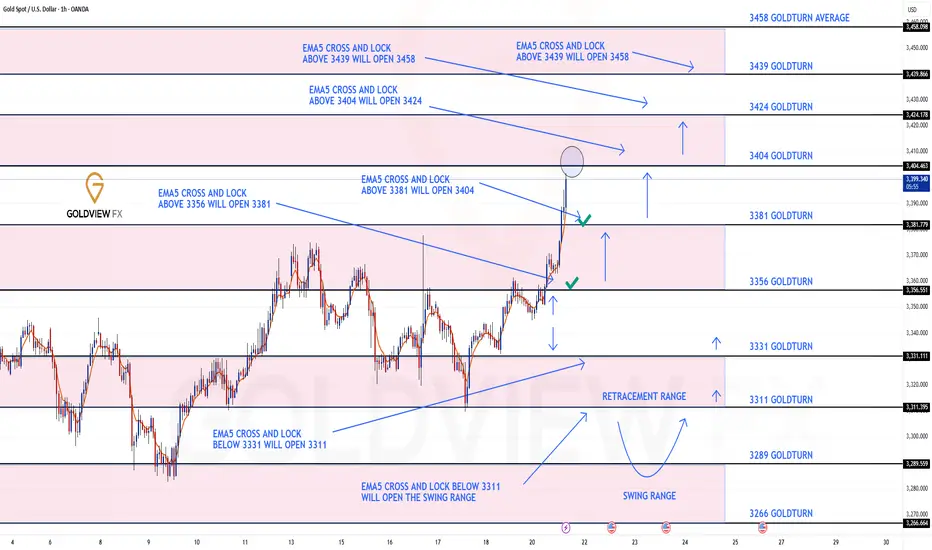
GOLD ROUTE MAP UPDATEHey Everyone,
Great start to the week with our chart idea playing out, as analysed.
We started with our Bullish target 3356 hit, followed with ema5 cross and lock above 3356 opening 3381. This was also hit perfectly completing this target. We now have a further ema5 cross and lock above 3381 leaving 3404 open with already a nice push up, just short of the full gap.
We will keep the above in mind when taking buys from dips. Our updated levels and weighted levels will allow us to track the movement down and then catch bounces up.
We will continue to buy dips using our support levels taking 20 to 40 pips. As stated before each of our level structures give 20 to 40 pip bounces, which is enough for a nice entry and exit. If you back test the levels we shared every week for the past 24 months, you can see how effectively they were used to trade with or against short/mid term swings and trends.
The swing range give bigger bounces then our weighted levels that's the difference between weighted levels and swing ranges.
BULLISH TARGET
3356 - DONE
EMA5 CROSS AND LOCK ABOVE 3356 WILL OPEN THE FOLLOWING BULLISH TARGETS
3381 - DONE
EMA5 CROSS AND LOCK ABOVE 3381 WILL OPEN THE FOLLOWING BULLISH TARGET
3404
EMA5 CROSS AND LOCK ABOVE 3404 WILL OPEN THE FOLLOWING BULLISH TARGET
3424
EMA5 CROSS AND LOCK ABOVE 3424 WILL OPEN THE FOLLOWING BULLISH TARGET
3458
BEARISH TARGETS
3331
EMA5 CROSS AND LOCK BELOW 3331 WILL OPEN THE FOLLOWING BEARISH TARGET
3311
EMA5 CROSS AND LOCK BELOW 3311 WILL OPEN THE SWING RANGE
3289
3266
As always, we will keep you all updated with regular updates throughout the week and how we manage the active ideas and setups. Thank you all for your likes, comments and follows, we really appreciate it!
Mr Gold
GoldViewFX
Time to invest in JPY and TN/bond? Hello FX/futures traders!
Market is at a pivotal point. Not in a bad way, but in a good way!
Chart 2: TVC:DXY
Let's start with the US Dollar . A declining USD was just well defended the last few days. If this is true, then the stock up, dollar down scenario is likely to continue. This is good for equities.
Chart 4: COMEX:GC1!
Gold defends its trendline as well. It seems like gold wants to go up more. A raising gold in the current scenario suggests declining USD TVC:DXY . This isn't always true, but we have to look at the current correlation and makes the best educated guess on this.
Logical Deduction 1:
Chart 1: CBOT:TN1!
A consolidation phase has been going on for almost 2 years now. This is definitely
a good sign to long bond, as at least we know the likely bottom for stoploss. With dollar leaning down and gold up, I think TN will defend its current level around 110-113.
Logical Deduction 2:
Chart 3: CME:6J1!
JPY is defending its first key level since May 2025. A wedge is forming, and the breakout is about to take place later this year. Likely the consolidation phase will take more time (with likelihood to breakout to either side). But with a declining USD side by side, I consider now a good entry point to long JPY with controllable risk.
Let me know what you think!

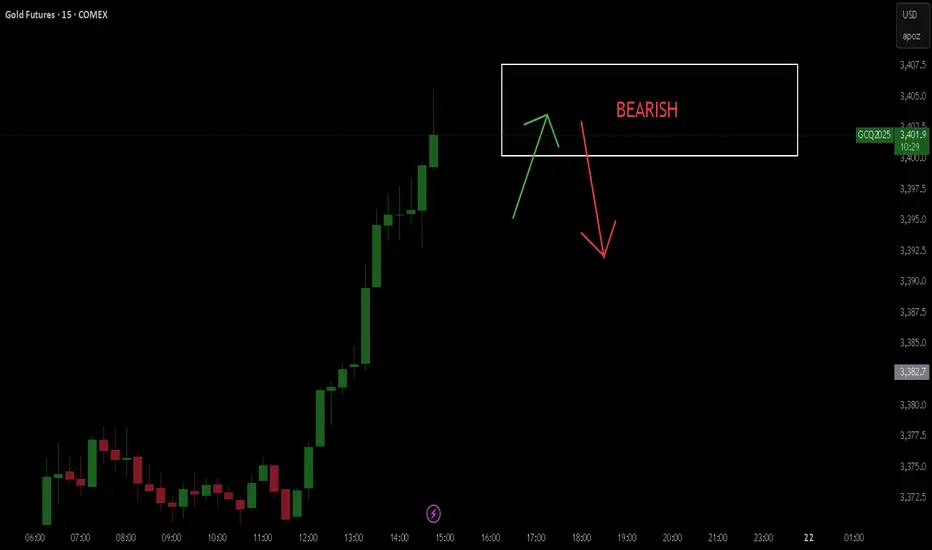
High probability that gold will fallHello,
I hope you're doing well. Here, I'm sharing my analysis of the gold futures market.
Now I see that there's a good chance, about 80%, that it will fall.