XAUUSD Daily Outlook – July 21, 2025Hey traders 💙
Gold continues to move inside a high timeframe range, with both bulls and bears defending structure at the edges. Price remains stuck between supply and demand — and only the strongest levels matter now. Here’s how the chart truly looks:
🔸 Key Supply Zones
1. 3380–3405: Main Daily Supply / Liquidity Pool Above
This is the top wall of the current range and the zone with the highest supply. Multiple failed breakouts, long upper wicks, and a clear cluster of liquidity just above. Unless we get a solid daily close above 3405, this area remains a trap for late buyers and a magnet for liquidity grabs.
2. 3355–3375: Internal Supply / Inducement Block
This zone has acted as an internal ceiling since the last CPI event. Here, price repeatedly failed to close above, and every return has produced quick rejections or fake breakouts. It often works as an inducement, catching breakout buyers and flipping the market lower.
🔹 Key Demand Zones
1. 3312–3300: Internal Demand / Mid-range Reaction
Here we see a clear reaction point where buyers have defended aggressively after CPI and NY session moves. It’s an internal demand area, often working as a temporary bounce or a place for stop hunts before larger moves.
2. 3275–3250: Main Daily Demand / Liquidity Pool Below
This is the base of the range, holding as support multiple times this month. Every dip into this zone has triggered large bounces, but the liquidity sitting below is also a key magnet for potential sweeps. Only a full daily breakdown here would flip the higher timeframe bias bearish.
📊 Technical Structure & Strategy
We are stuck between Main Supply (3380–3405) and Main Demand (3275–3250).
Every “middle” move is either inducement or a set-up for liquidity collection — not a real trend.
No daily close above 3405 → no bullish continuation.
No breakdown below 3250 → no clean bearish momentum.
Your edge: Only act when price confirms a reaction at a major zone with CHoCH/BOS, strong OB, or a liquidity sweep.
🧠 Takeaway:
This is not the time to guess direction — let the market show its intent at the edges. Use TradingView alerts on your key levels, be ready for volatility from macro news, and don’t get trapped in the mid-range games.
💬 Comment your bias or questions below.
Follow GoldFxMinds for more advanced XAUUSD updates and sniper-level education.
Stay patient, stay precise, and let structure work for you!
Posted using Trade Nation broker feed. As a participant in the Trade Nation Influencer program, I receive a monthly fee for using their TradingView charts in my educational content.
— GoldFxMinds 💙
Gold

Weekly XAUUSD Outlook | July 21–25GoldFxMinds | Structure-Based HTF Plan
Hello traders,
This week we’re back in key HTF territory. Price is compressing inside a premium structure zone, between clean supply and demand areas. Trend is still bullish, but momentum is weakening — so we focus on structure to guide us.
🟨 Weekly Bias: Neutral | Range Structure in Play
We currently have no confirmed bullish or bearish bias on the weekly timeframe.
Gold remains trapped in a macro range between:
🟥 Upper Resistance Zone: 3355–3380
🟦 Lower Demand Zone: 3280–3240
Last week’s movement created a wick grab near 3375 followed by a strong push down, but without a clean break of structure — meaning we’re still inside a distribution–accumulation trap.
📌 Until we see a clear breakout (above 3380 or below 3280), the weekly bias remains neutral.
This is not a time to force directional trades on the weekly.
Instead, we wait for Daily and H4 confirmation, and position ourselves around the edges of this weekly range.
🔹 Last Week Recap
Weekly candle created a wick into 3377, rejecting just under previous week’s high. No BOS, no liquidity sweep with continuation — just a clear rejection inside supply, confirming premium trap.
Weekly candle closed with a top wick and small body — price is compressing under resistance. Still bullish structure, but not impulsive.
🔹 Weekly Key Structure Zones
🔸 3365–3390 (Supply)
→ Reason: Rejection from prior weekly high (3377), aligned with clean OB and FVG left behind from June breakout.
→ Structure context: No bullish BOS above 3375. This is now an unbroken supply zone with strong wick rejections. Liquidity sits above.
→ Use: Wait for price to tap back in → look for M15–H1 reaction for possible sell if no BOS above 3390.
🔸 3430–3450 (Supply - Last Line)
→ Reason: Unmitigated impulsive candle OB from prior macro swing high. This zone marks the final structure before a full continuation toward new highs.
→ Structure context: If this breaks with a strong BOS, macro structure flips bullish again.
→ Use: Only engage if price clears 3390 with strong volume and closes → watch this for last reaction zone.
🔸 3285–3260 (Demand)
→ Reason: Last bullish OB + FVG combo from early July, unmitigated. Price never retraced to this base since the rally.
→ Structure context: No BOS down yet, so this is still valid bullish origin.
→ Use: If price pulls back aggressively this week, watch this zone for LTF confirmation (CHoCH or BOS bullish). This would be a clean discount buy.
🔸 3210–3180 (Deep Demand)
→ Reason: Higher timeframe CHoCH origin zone, aligns with Fibonacci 61.8% retracement from entire May–July swing.
→ Structure context: Only in play if 3260 fails and we get clean BOS down on Daily.
→ Use: This is your swing buy zone if market breaks structure lower. Strong confluence for reaction.
🔹 HTF Structure Recap
Weekly trend: Still bullish (no BOS down), but compression under resistance
Structure range: Between 3390 and 3260 — price inside premium, no breakout yet
EMA Flow: Bullish but extended. Space for retracement.
RSI: Divergence above 3350 — supporting possible retrace.
🔹 Macro Events This Week
Tuesday: Powell speaks 🗣️ (volatility risk)
Thursday: Flash PMIs (usually directional)
Friday: Durable Goods & Home Sales 🏡
⚠️ Be patient on high-impact days. Let price come into your marked zones — don’t chase inside noise.
🔹 Summary & Plan
We are inside a macro range between 3390 (supply) and 3260 (demand). Structure is not broken — so we play both sides:
Sell Setup: If price taps back into 3365–3390 with no BOS → watch for reaction
Buy Setup: If price retraces into 3285–3260 → look for clean bullish CHoCH to validate
Middle area = chop. Wait for price to get to structure zones — don’t guess.
Thanks for reading 💛
We’ll drop daily and intraday outlooks once price moves closer to one of these structure zones. Until then:
🎯 Trade the reaction, not the prediction.
🔥 If you want these levels and sniper plans every day, follow , like 🚀🚀🚀 and drop a comment if you caught the move!
Stay focused, stay sharp, and never force a trade.
GoldFxMinds

EURJPY Hits Major Weekly Supply | Is the Bull Run Over?EUR/JPY – Institutional Macro Context (COT)
EUR (Euro)
Non-commercials net longs increased by +16,146 → strong buying.
Commercials added +25,799 long positions.
✅ Bias: Moderately bullish.
JPY (Japanese Yen)
Non-commercials decreased longs by -4,432.
Commercials cut -20,405 long contracts.
❌ Bias: Bearish pressure remains on JPY.
Conclusion (COT): EUR remains fundamentally strong, JPY structurally weak. Institutional flows favor long EUR/JPY, but positioning is stretched.
Seasonality (July)
EURJPY shows strong bullish seasonality in July, especially over the 2Y and 5Y averages (+1.03% and +0.66% respectively).
✅ Seasonality bias: Bullish.
Retail Sentiment
89% of traders are short on EUR/JPY.
Contrarian bias = bullish confirmation.
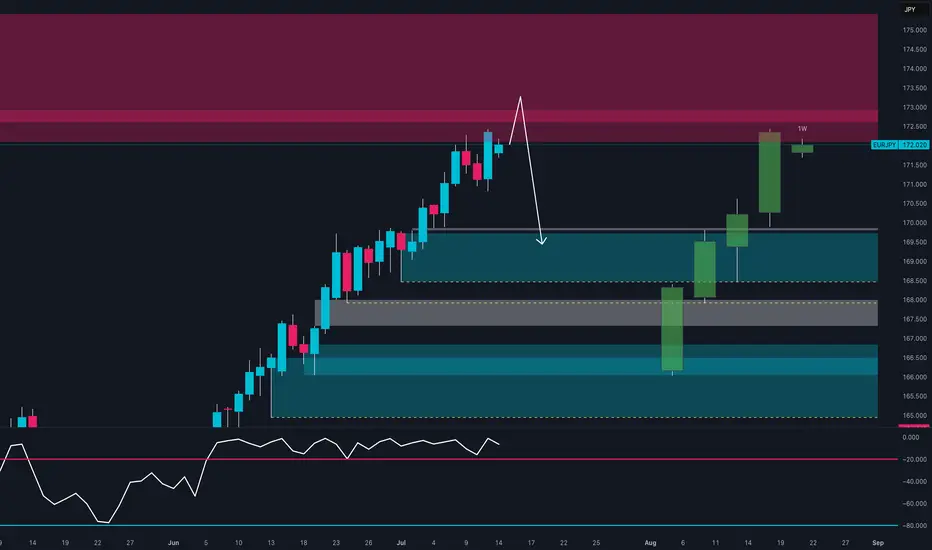
Technical Analysis (Weekly View)
Price is pushing into a major weekly supply zone around 172.50–173.00.
RSI still elevated but showing signs of weakening momentum.
Potential double top structure forming in confluence with liquidity grab.
First downside target sits around 169.50 (daily demand zone).
Awaiting a reaction in supply and confirmation for short.
Trading Plan (Top-Down)
Wait for price to reject the 172.50–173.00 area
Watch for bearish confirmation on Daily (engulfing or lower high)
Target: 169.50 zone
Risk: tight above 173.20 (invalidating supply zone)
Gold may rise a little and then drop to support levelHello traders, I want share with you my opinion about Gold. Initially, gold was trading within a large consolidating pennant, showing both upward and downward impulses as it moved between the converging trend lines. The price eventually saw a breakout from this pattern, followed by a strong impulse up, but this momentum stalled as it approached the major horizontal resistance level at 3390. This level, which corresponds with the upper seller zone, has proven to be a significant barrier for buyers, rejecting the price and confirming a strong seller presence in that area. Currently, the market is in a corrective phase after being rejected from the highs. The price is drifting upwards once again in what appears to be a final retest of the aforementioned seller zone. This slow upward movement lacks the impulsive strength of the previous trend, suggesting that buyers are losing control and sellers are preparing to defend the 3390 resistance level once more. I expect this corrective move to fail upon reaching the seller zone around 3390. After this retest, I anticipate a sharp reversal and the beginning of a new downward trend. The logical target for this move is the major support level at 3310, an area that has historically acted as a strong buyer zone. That is why my TP is set at 3310. Please share this idea with your friends and click Boost 🚀
Disclaimer: As part of ThinkMarkets’ Influencer Program, I am sponsored to share and publish their charts in my analysis.

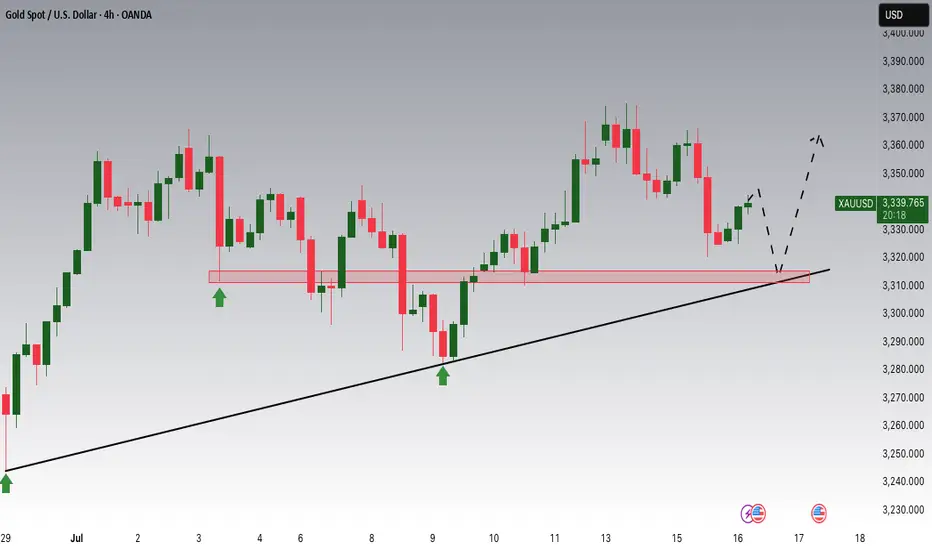
GOLD - Price may bounce up to $3375 level from support lineHi guys, this is my overview for XAUUSD, feel free to check it and write your feedback in comments👊
Initially, the price action was confined within a descending channel before a decisive bullish breakout occurred.
This first breakout triggered a strong upward impulse, setting the stage for the current market structure.
The price is now consolidating in a wide flat range, bounded by support near the $3285 level and resistance at $3375.
An ascending support line is providing dynamic support within this consolidation pattern, indicating underlying buying pressure.
I expect a brief retest of this support line, which should act as a launchpad for the price to move higher.
The primary target for this long setup is the $3375 resistance level, marking the top of the current flat range.
If this post is useful to you, you can support me with like/boost and advice in comments❤️
Disclaimer: As part of ThinkMarkets’ Influencer Program, I am sponsored to share and publish their charts in my analysis.

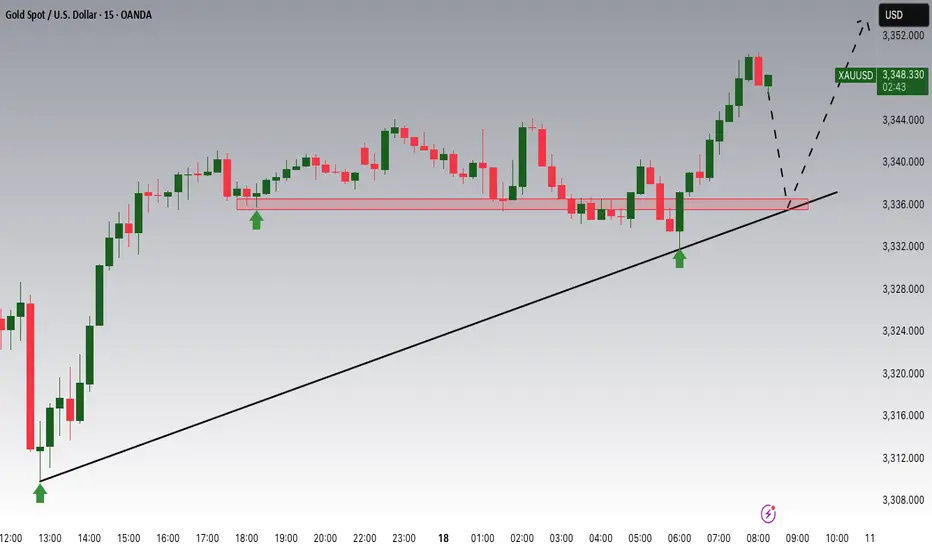
Gold breaks trendline and returns to uptrend. BUY NOW!✏️ OANDA:XAUUSD A deep sweep to 3310 and bounce back to the trading range. Gold is reacting at the Trendline around the price zone of 3344. This is an important price zone that if broken will return to the uptrend and head towards 3373 soon. 3332 plays an important role in the current bullish wave structure, which is a suitable SL placement point for BUY signals.
📉 Key Levels
Support: 3332-3312
Resistance: 3344-3357-3373-3389
BUY trigger: Break and trading above Resistance 3344 (trendline, top uptrend wave 1)
BUY DCA trigger: Break Resistance 3353
Target 3373
Leave your comments on the idea. I am happy to read your views.

Gold Potential UpsidesHey Traders, in today's trading session we are monitoring XAUUSD for a buying opportunity around 3,310 zone, Gold is trading in an uptrend and currently is in a correction phase in which it is approaching the trend at 3,310 support and resistance area.
Trade safe, Joe.
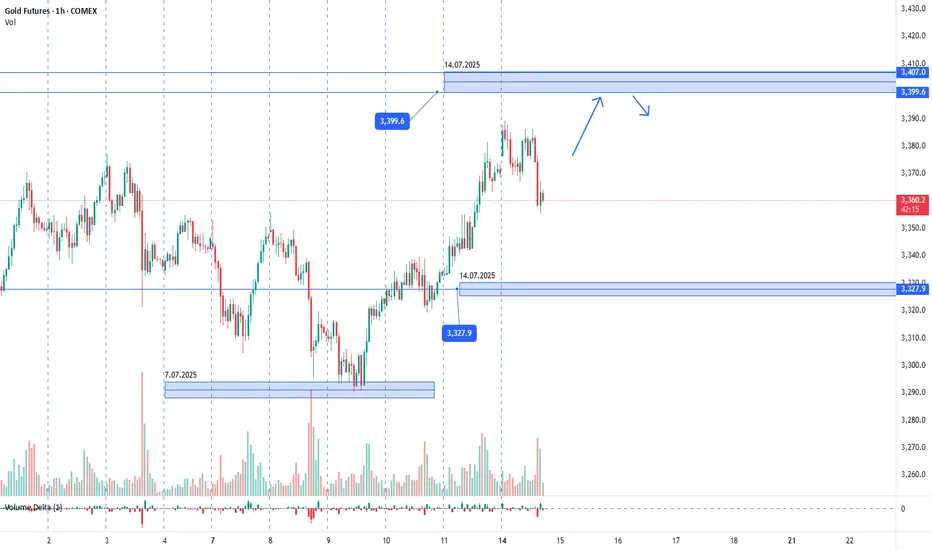
Gold. 14.07.2025. The plan for the next few days.The nearest resistance zones are where it's interesting to look for sales. It's not certain that there will be a big reversal, but I think we'll see a correction. We're waiting for a reaction and looking for an entry point.
The post will be adjusted based on any changes.
Don't forget to click on the Rocket! =)
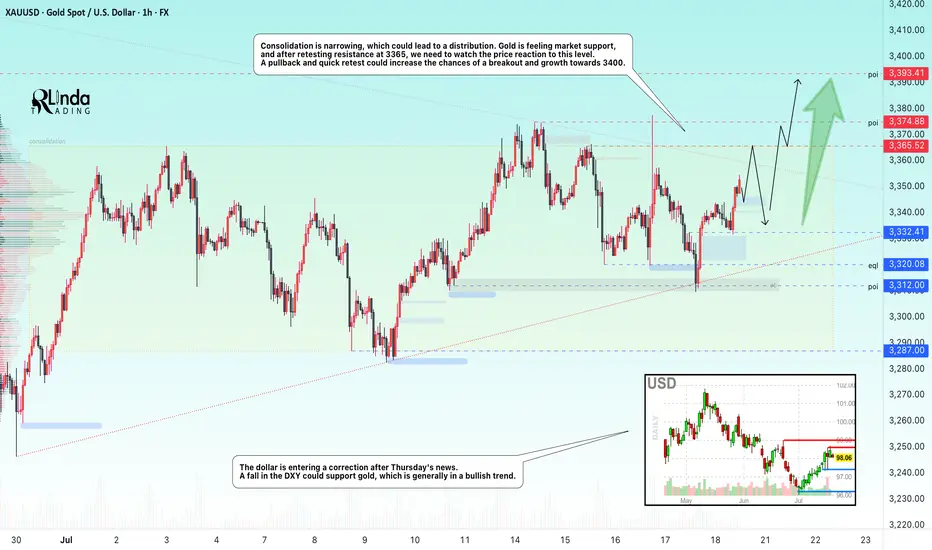
GOLD → Retest of consolidation resistance. Chances of a breakoutFX:XAUUSD bounces off support at 3312, forming a false breakdown at 3320. The price is heading towards consolidation resistance. The chances of continued growth are increasing...
Gold rebounded from its low amid statements by Fed member Waller about a possible rate cut in July. However, strong US sales and labor market data strengthened the dollar and held back XAU/USD growth. Despite statements by some Fed members about maintaining a tight policy, traders continue to expect rate cuts before the end of the year. The focus is on new economic data that could affect the dollar and gold prices.
Technically, consolidation is narrowing, which could lead to distribution. Gold is feeling market support, and after retesting resistance at 3365, we need to watch the price reaction to the level. A pullback and quick retest could increase the chances of a breakout and growth to 3400.
Resistance levels: 3365, 3375
Support levels: 3332, 3320, 3312
There is a high probability that there will be an attempt to break through the consolidation resistance amid expectations of a rate cut. This phase may be accompanied by either a correction to retest and return for a breakout, or a breakout and consolidation of the price above the level. Today, Friday, I expect a retest and correction, as there may not be enough local potential for a breakout of this level, and the price has already lost some of its momentum since the opening of the session...
Best regards, Linda!
Trapped orderflow. Gold Weekly Outlook. 19.07.2025,SaturdayExpecting a range bound market condition until any one of the VI on the weekly inverse. Trapped Orderflow

18/07 Gold Outlook Market Tensions Mount Liquidity Zones in Play Gold Outlook – Market Tensions Mount, Liquidity Zones in Play
Price action heats up as we enter the final trading day of the week. Are you ready to ride the wave or get caught in the liquidity sweep?
🔍 Market Sentiment & Global Highlights
Gold rebounded strongly after dropping on better-than-expected US data. However, several macro risks are keeping gold buyers in the game:
Buy-the-dip activity emerged amid concerns that Trump’s tariff policies may fuel inflation.
Rate cut expectations remain strong as US core inflation shows no signs of cooling.
Geopolitical risks intensified as Israel conducted fresh airstrikes on Syria.
EU threatens $84B in tariffs on US goods should trade talks break down.
💡 These tensions are giving gold strong support — especially as traders prepare for potential volatility into the weekend.
📈 Technical Overview – Liquidity Zones at Play
Yesterday's bounce from FLZ H2 (3310) — a critical demand and liquidity zone — triggered a clean reversal. Sellers took profit, volume shifted, and buyers regained control. Price has since pushed up to retest the OBS SELL ZONE + CP Pattern near the 334x area with a sharp reaction.
For today, price is likely to revisit lower liquidity pockets (M30–H2) before making the next directional move.
🔑 Key Levels to Watch
🟢 BUY ZONE: 3318 – 3316
Stop Loss: 3312
Take Profits: 3322 – 3326 – 3330 – 3335 – 3340 – 3345 – 3350 – 3360+
⚡ BUY SCALP ZONE: 3326 – 3324
Stop Loss: 3320
Take Profits: 3330 – 3335 – 3340 – 3345 – 3350 – 3360
🔴 SELL ZONE: 3363 – 3365
Stop Loss: 3370
Take Profits: 3360 – 3355 – 3350 – 3346 – 3342 – 3338 – 3335 – 3330
⚠️ Final Notes
Today’s session has no major news releases, but as it’s the end of the week, we may see liquidity grabs and unexpected volatility. Stay disciplined, stick to your plan, and always respect TP/SL.
🔔 Follow the key zones carefully – volatility loves indecision.

Gold Potential UpsidesHey Traders, in today's trading session we are monitoring XAUUSD for a buying opportunity around 3,336 zone, Gold is trading in an uptrend and currently is in a correction phase in which it is approaching the trend at 3,336 support and resistance area.
Trade safe, Joe.
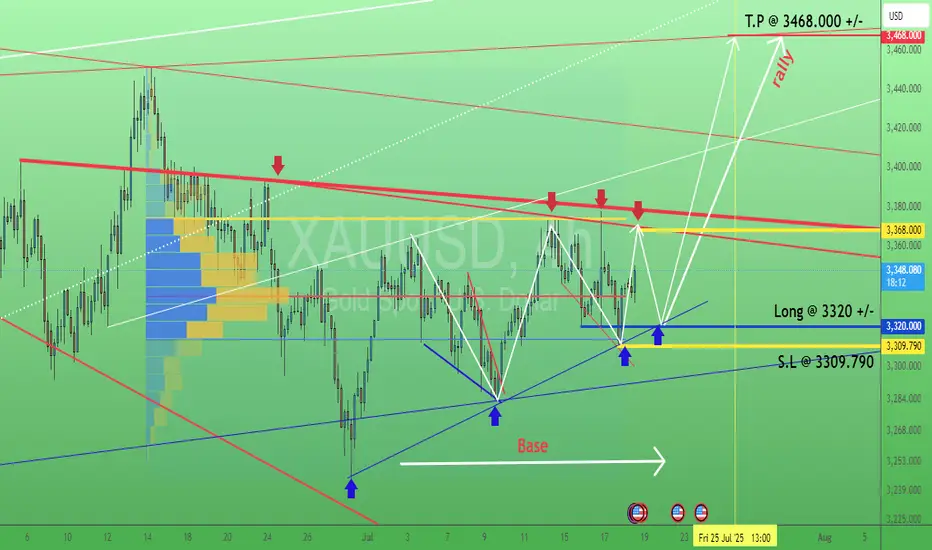
Gold. Swing trading signal. 18/July/25XAUUSD probably still ranging within 3309 - 3368 before breakout to the upside...targeting still around 3460 +/-
Double Top + Zigzag Complete: Are Bears About to Take Over Gold?Yesterday, the financial markets in general, including Gold ( OANDA:XAUUSD ) , acted like a roller coaster after the news of Powell's dismissal . After this news was denied , Gold returned to its main trend, which I published in my previous idea .
Gold is currently re-attacking the Support line , Support zone($3,326-$3,325) and 50_SMA(Daily) .
In terms of classic technical analysis , it seems that gold has formed a Double Top Pattern for support breakdowns, where a Support line breakdown can also be accompanied by a neckline breakdown .
From the perspective of Elliott Wave theory , it seems that Gold has managed to complete the Zigzag Correction(ABC/5-3-5) , and we should wait for the next bearish waves .
I expect Gold to break its supports and move towards $3,290 ; support breaks are best done with high momentum . An important price that can change the direction of Gold's downside is $3,350 .
Note: If Gold breaks the Resistance lines and forms an hourly candle above $3,351(Stop Loss (SL)), we can expect further Gold gains.
Gold Analyze (XAUUSD), 2-hour time frame.
Be sure to follow the updated ideas.
Do not forget to put a Stop loss for your positions (For every position you want to open).
Please follow your strategy; this is just my idea, and I will gladly see your ideas in this post.
Please do not forget the ✅ ' like ' ✅ button 🙏😊 & Share it with your friends; thanks, and Trade safe.

Long and short fluctuations, the market is waiting for a break📰 News information:
1. Powell responds to White House issues
2. Will other countries impose reciprocal sanctions on tariffs?
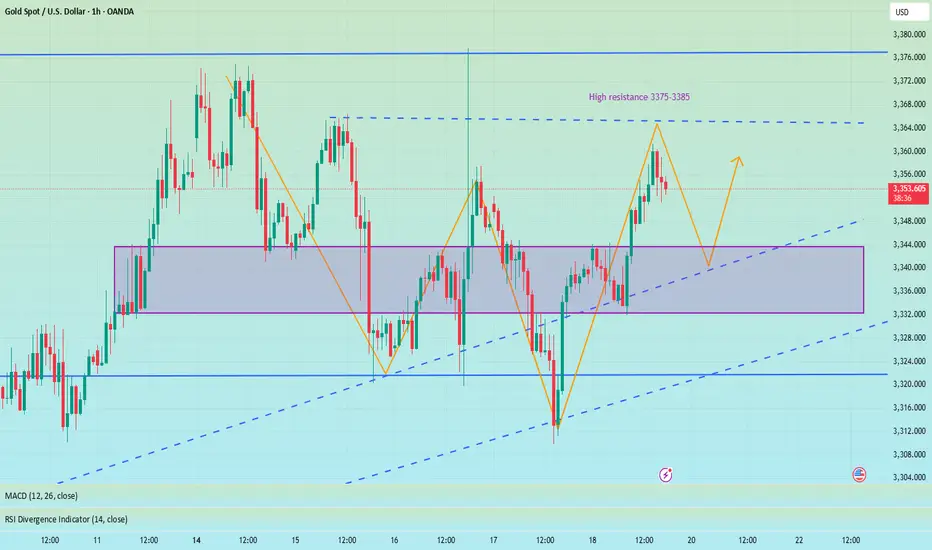
📈 Technical Analysis:
Although the MACD indicator of the gold hourly line formed a golden cross, the market reached a high of around 3361, and the RSI indicator was close to the overbought area, so we need to be cautious about corrections. From the 4H chart, the MACD second golden cross is on the zero axis. Currently, we are paying attention to the moving average SMA5 near 3343, and the SMA60 support line 3332. If the 4H upward trend falls back, we need to go long. At present, gold is still running above, and there is no good participation point in the short term, but on the whole, we should pay attention to the support of 3345-3332 below, and we can consider going long if it retreats and stabilizes. We continue to pay attention to the resistance pressure of 3375-3385 above, and we can try to go short if it does not break.
🎯 Trading Points:
SELL 3375-3385
TP 3365-3355
BUY 3345-3332
TP 3365-3375-3385
In addition to investment, life also includes poetry, distant places, and Allen. Facing the market is actually facing yourself, correcting your shortcomings, facing your mistakes, and exercising strict self-discipline. I share free trading strategies and analysis ideas every day for reference by brothers. I hope my analysis can help you.
FXOPEN:XAUUSD OANDA:XAUUSD FX:XAUUSD FOREXCOM:XAUUSD PEPPERSTONE:XAUUSD TVC:GOLD
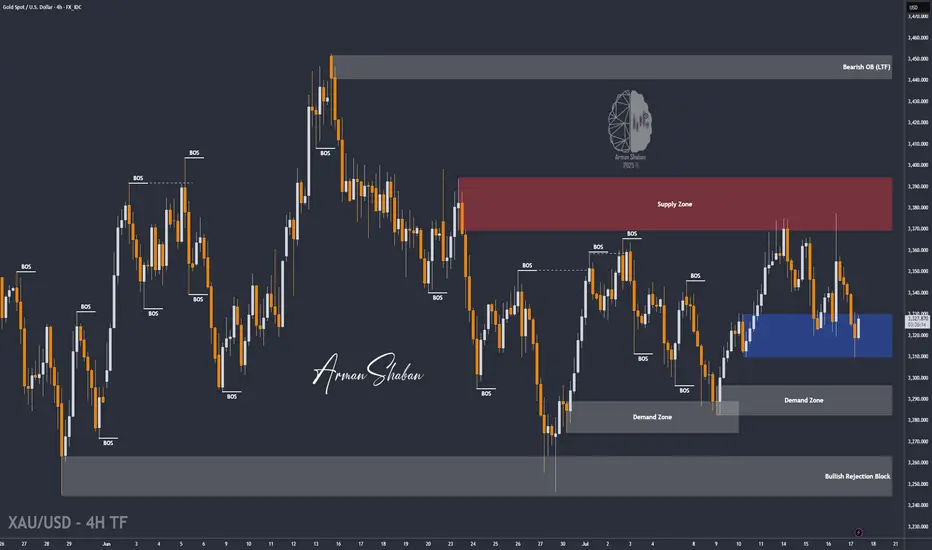
XAU/USD | First LONG to $3345, Then a Potential DROP Below $3300By analyzing the gold chart on the 4-hour timeframe, we can see that last night the price first tapped into the $3340 level, showing an initial push up to $3352. However, the drop intensified soon after, breaking the $3340 resistance and, according to the second scenario, falling to $3310. Upon reaching this key demand level, buying pressure kicked in, pushing the price back up to $3325. Now, the key question is whether gold can hold the $3310 support. If this level holds, we can expect a rise toward $3331 as the first target and $3345 as the second. After this move, a rejection from the $3345 area could trigger another drop, possibly pushing gold below $3300. So, first LONG, then SHORT!
THE LATEST VIDEO ANALYSIS :
Please support me with your likes and comments to motivate me to share more analysis with you and share your opinion about the possible trend of this chart with me !
Best Regards , Arman Shaban
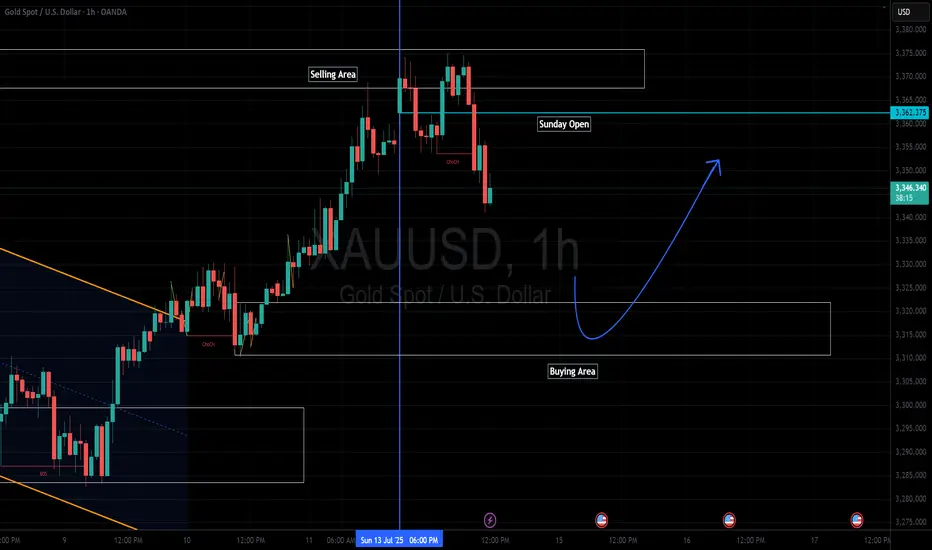
Gold Analysis 7/14/25This week's analysis so far. Keep in mind the Sunday open as price tends to come back to this point sometimes.
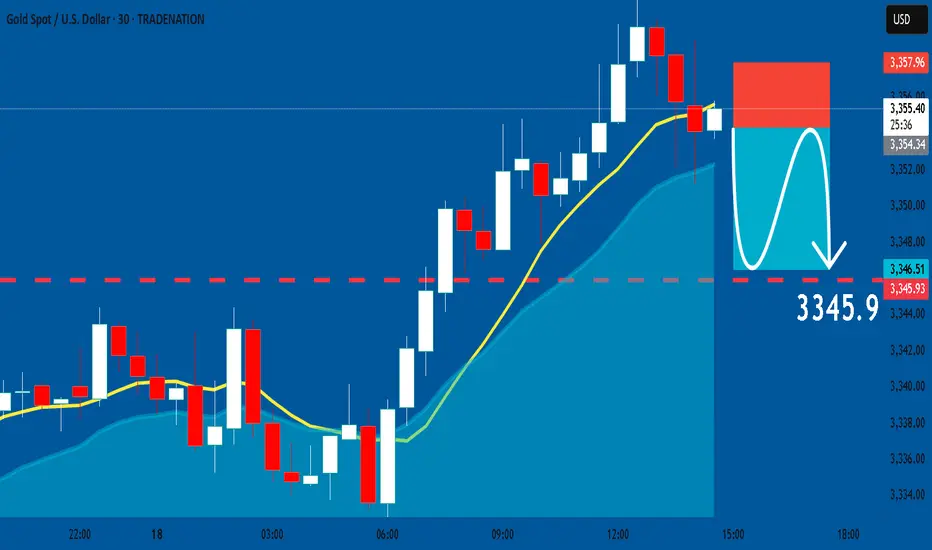
GOLD: Short Trade Explained
GOLD
- Classic bearish pattern
- Our team expects retracement
SUGGESTED TRADE:
Swing Trade
Sell GOLD
Entry - 3354.53
Stop - 3357.9
Take - 3345.9
Our Risk - 1%
Start protection of your profits from lower levels
Disclosure: I am part of Trade Nation's Influencer program and receive a monthly fee for using their TradingView charts in my analysis.
❤️ Please, support our work with like & comment! ❤️
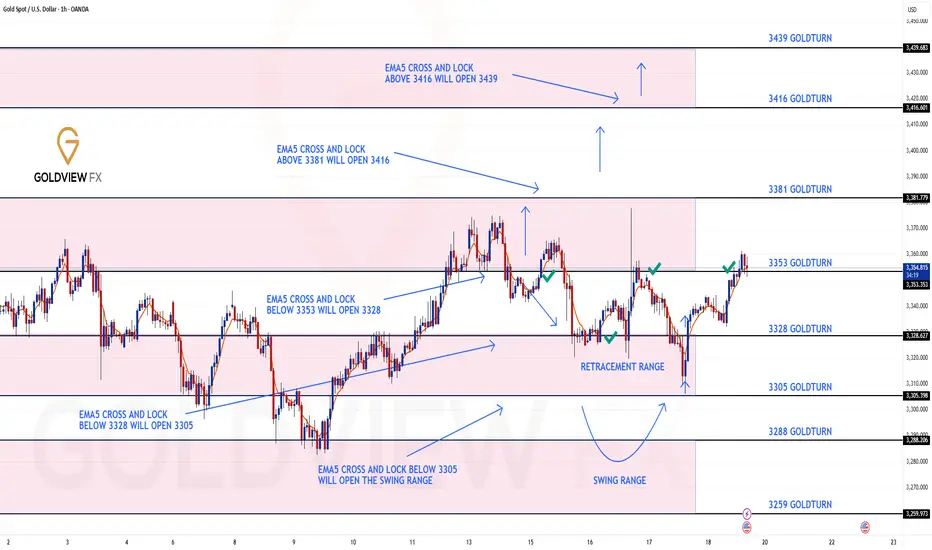
GOLD ROUTE MAP UPDATEHey Everyone,
End of week update following up on yesterday’s 1H chart outlook.
✅ 3353 was hit and respected to the pip, just as we mapped out and highlighted yesterday.
We saw the EMA5 cross and lock above 3328, confirming continuation.
The market respected structure beautifully
Rejections gave us clean dip buying entries
EMA5 methodology guided our execution
High probability Goldturn levels played out exactly as planned
Our discipline and patience were rewarded, yet again. Another strong end to the week.
We will now come back Sunday with a full multi timeframe analysis to prepare for next week’s setups, including updated views on the higher timeframes, EMA alignments, and structure expectations going forward.
Thanks again for all your likes, comments, and follows.
Wishing you all a fantastic weekend!!
Mr Gold
GoldViewFX
Bear-Trap armed: Gold ticks 4 / 5 boxes - waiting for the spark1️⃣ Why the 2020 déjà-vu is EVEN louder
2025 (now) 2020 (pre-rally)
TradingView ideas still bearish 💬
> 70 % 60 % bearish
Managed-money net-longs ≈ 115 k
-35 % from Apr. –25 % from peak
+ $741 m PM-ETF inflow Record IN-flows
G/S ratio 87 (< 90) Fell to 95
S&P keeps making highs Ditto
2️⃣ What’s still different
Real 10-y TIPS yield +0.7 % vs -1 % in 2020 → smaller monetary tail-wind.
Gold is already at an infl-adj. record – expect a short & sharp squeeze, not a fresh multi-year super-cycle (yet).
3️⃣ Checklist – updated
Signal Status 18 Jul Comment
———————————————————
Gold DAILY close ≥ $3 200–3 250 YES – $3 354 ✔
G/S ratio < 90 YES – 87 ✔
CFTC net-longs < 150 k YES – ~115 k ✔
ETF flows turn positive. YES – $741 m ✔
Equity stress (VIX > 25 or SPX −5 %) NOT YET – VIX 16.5 ✖
4 / 5 boxes = 99 % primed. One spark missing.
4️⃣ What could light the fuse
Date Potential trigger Why it matters
22 Jul Mega-tech Q2 earnings (NVDA/AMD) Any guidance miss → SPX wobble
30 Jul FOMC Fed holds but sounds dovish USD dump + yield spike risk
1 Aug Trump s “reciprocal” duties Imported-inflation scare → VIX pop
Early Aug. DXY crashes < 96 in < 5 days. Disorderly USD slide = funding stress
Hit ≥ 2 of: DXY < 96, VIX > 25, SPX -5 % or HY-spread +75 bp → final ✔.
Bottom line
The bear-trap thesis aged well: sentiment, positioning, ETFs, and G/S ratio have already clicked bullish.
Only equity-market stress is missing. A fast USD slide or a tariff shock right after a neutral Fed is the most likely detonator.
Stay nimble: Collect premium inside $3 250-3 400 while volatility sleeps – but keep alarms on VIX 25 and DXY 96. One red headline could still launch the squeeze.
Disclaimer: Educational opinion, not investment advice. Futures & CFD trading is risky – do your own research and consult a professional.
1 minute ago

GOLD: Local Bearish Bias! Short!
My dear friends,
Today we will analyse GOLD together☺️
The recent price action suggests a shift in mid-term momentum. A break below the current local range around 3,358.13 will confirm the new direction downwards with the target being the next key level of 3,349.76.and a reconvened placement of a stop-loss beyond the range.
❤️Sending you lots of Love and Hugs❤️

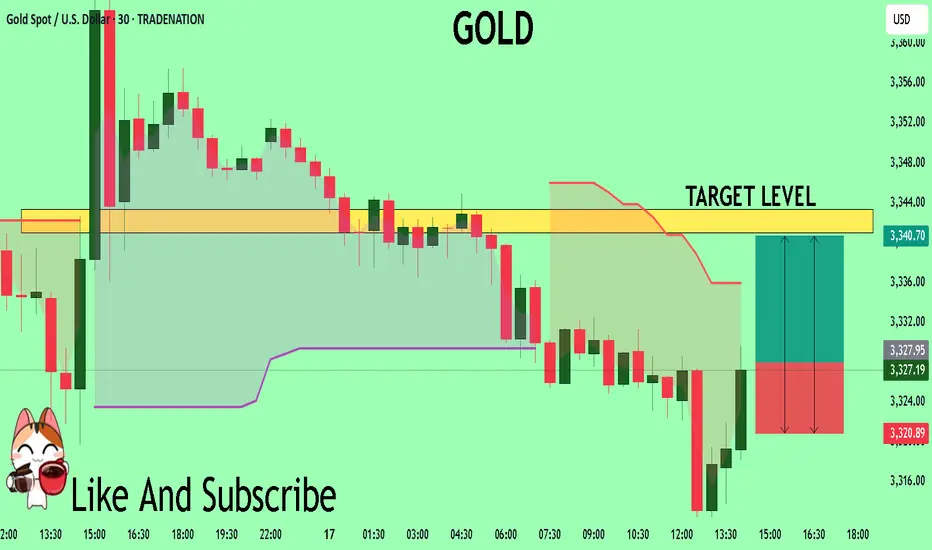
GOLD What Next? BUY!
My dear friends,
GOLD looks like it will make a good move, and here are the details:
The market is trading on 3328.1 pivot level.
Bias - Bullish
Technical Indicators: Supper Trend generates a clear long signal while Pivot Point HL is currently determining the overall Bullish trend of the market.
Goal - 3340.9
Recommended Stop Loss - 3320.8
About Used Indicators:
Pivot points are a great way to identify areas of support and resistance, but they work best when combined with other kinds of technical analysis
Disclosure: I am part of Trade Nation's Influencer program and receive a monthly fee for using their TradingView charts in my analysis.
———————————
WISH YOU ALL LUCK
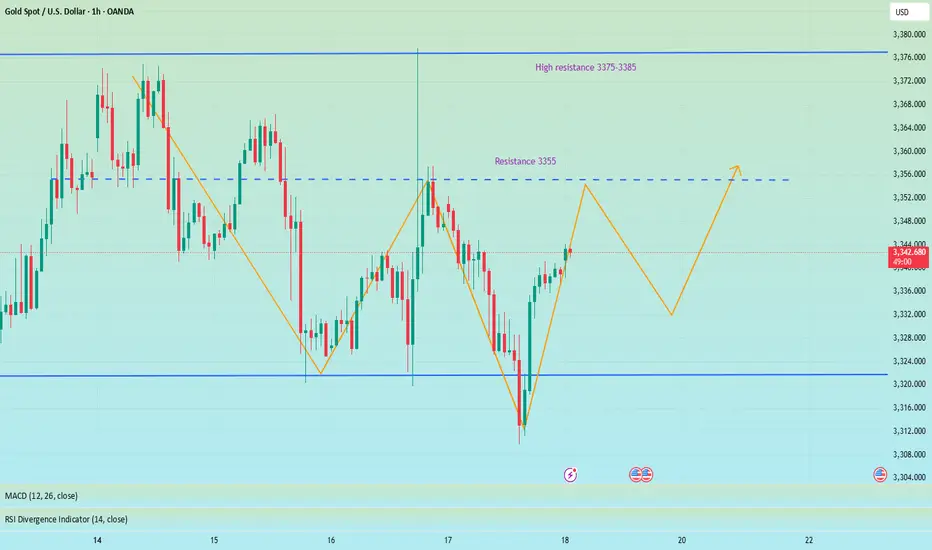
The short-selling idea remains unchanged, defend 3355📰 News information:
1. Powell responds to White House issues
2. Will other countries impose reciprocal sanctions on tariffs?
📈 Technical Analysis:
Gold closed with a long lower shadow on the daily line yesterday and closed with a doji on the hourly line. In the short term, gold may continue to rise and is expected to touch the 3355 line. If gold cannot break through and stabilize above 3355, then gold may fall back. We can still consider shorting, and the target can be 3330. If the trend is as expected, it may form the embryonic form of a head and shoulders bottom. On the contrary, if the gold price breaks through 3355, stop loss on short positions and pay attention to the high resistance of 3375-3385.
🎯 Trading Points:
SELL 3340-3355
TP 3330-3320
In addition to investment, life also includes poetry, distant places, and Allen. Facing the market is actually facing yourself, correcting your shortcomings, facing your mistakes, and exercising strict self-discipline. I share free trading strategies and analysis ideas every day for reference by brothers. I hope my analysis can help you.
TVC:GOLD PEPPERSTONE:XAUUSD FOREXCOM:XAUUSD FX:XAUUSD OANDA:XAUUSD FXOPEN:XAUUSD