Gold Next Move (Read description). Hello, Traders.
As you saw we have achieved our target at last ideas.
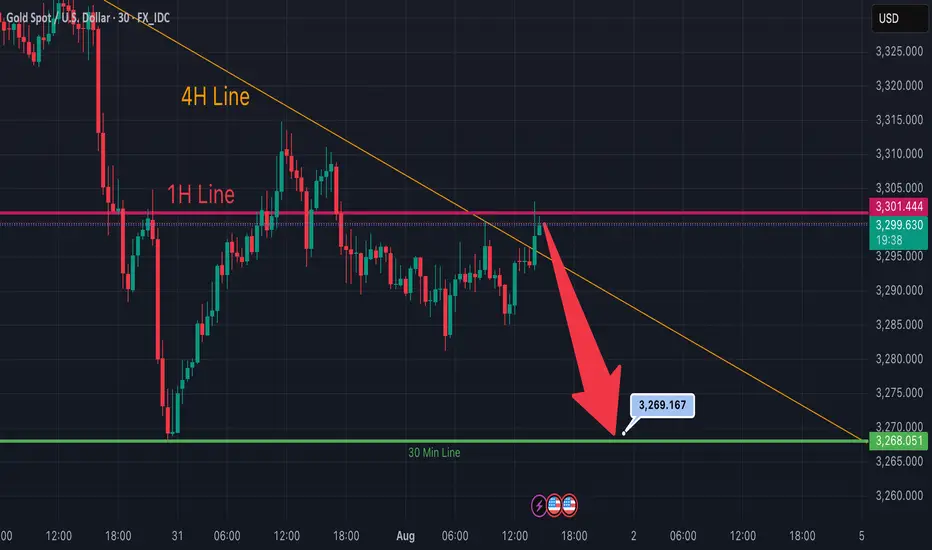
This week gold is running in down trend, today it has touched the price 3268 and then gold pumped.
As you see guys, gold has breakout the last support area and its support became resistance.
Gold has changed the character according to H1 and there is break of structure (BOS).
The trend is bearish, so gold needs to fall, it can fall till 3351.
Comment positive feedbacks, Thanks.
Gold

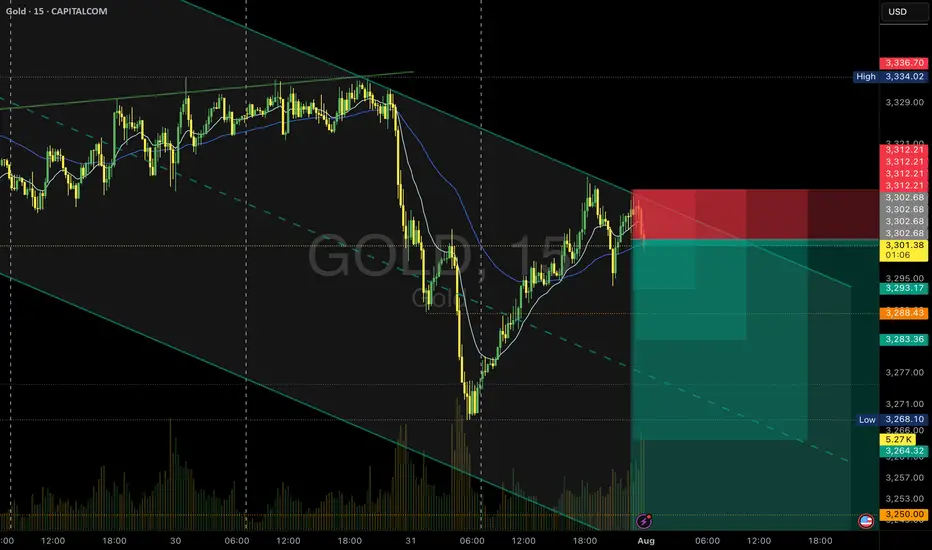
Gold Sell Setup - M15PEPPERSTONE:XAUUSD
Timeframe: m15
Risk Level: Medium
🔹 Setup:
Price is testing the upper boundary of the descending channel.
📈 Entry:
Current price zone: 3302.5
🎯 Targets (TP):
TP1: 3393
TP2: 3283
TP4: 3264
TP6: 3244
⛔ Stop Loss (SL):
3312.2
#XAUUSD #GOLD #SELL #Signal #MJTrading
Psychology Always Matters:
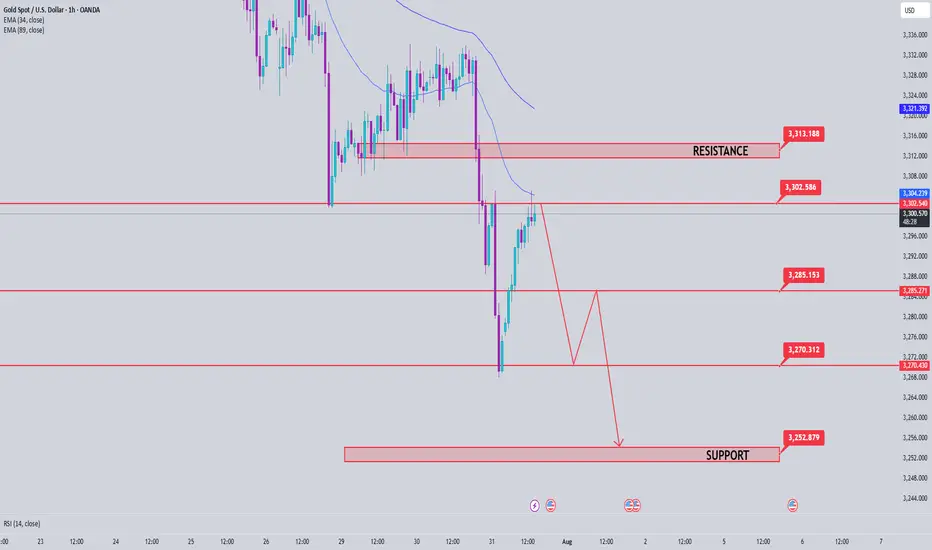
Gold price analysis July 31XAUUSD – Bearish pressure still prevails, watch for SELL in the direction of the trend
Yesterday's session witnessed a strong decline when the D1 candle closed with selling pressure up to 60 prices, forming a key candle that shapes the trend. When the market forms a main candle, the 25% and 50% candle body areas are often important price areas to continue trading in the direction of the main trend.
In the current context, the priority strategy will be to sell in the direction of the downtrend when the price rebounds to the resistance areas and there is a rejection signal.
🔹 Important resistance areas:
3301 – 3312 – 3333
🔸 Target support areas:
3285 – 3270 – 3250
🎯 Trading strategy:
Prioritize SELLing at the resistance area of 3301–3312 when there is a price reaction (rejection).
Target: 3250
BUY only considered when 3313 area is broken decisively.
Staying disciplined and sticking to the reaction price zone will be key in the context of the market moving in a clear trend.
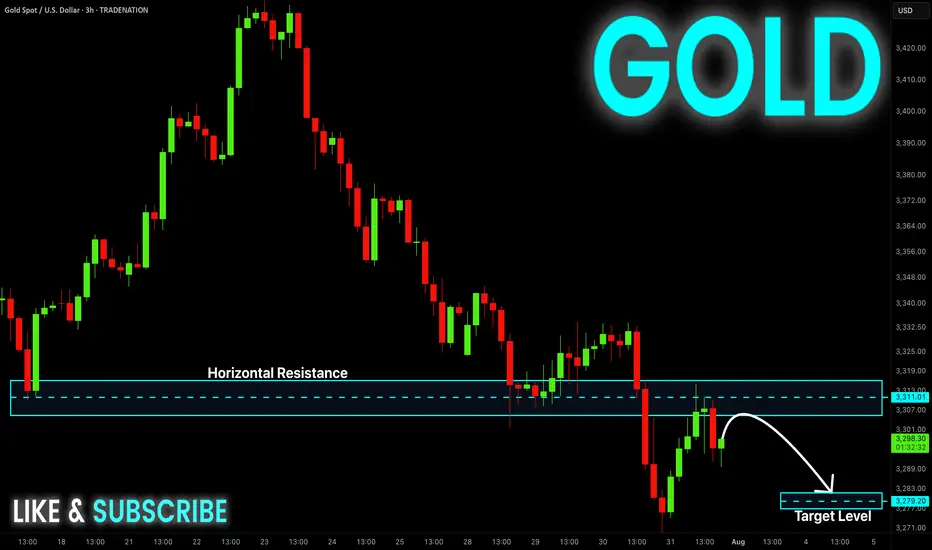
GOLD Local Short! Sell!
Hello,Traders!
GOLD made a retest
Of the horizontal resistance
Of 3313$ and we are already
Seeing a bearish reaction and
We will be expecting a further
Bearish move down
Sell!
Comment and subscribe to help us grow!
Check out other forecasts below too!
Disclosure: I am part of Trade Nation's Influencer program and receive a monthly fee for using their TradingView charts in my analysis.
Do you think gold is on a correction?
Hi my dears
Gold looks set to hit lower targets if it breaks the orange dotted line
What do you think?
The weekly timeframe has confirmed the bearish trend.
If you liked my analysis, just like me by liking and commenting.

GOLD: Strong Bullish Sentiment! Long!
My dear friends,
Today we will analyse GOLD together☺️
The recent price action suggests a shift in mid-term momentum. A break above the current local range around 3,296.556 will confirm the new direction upwards with the target being the next key level of 3,310.375 and a reconvened placement of a stop-loss beyond the range.
❤️Sending you lots of Love and Hugs❤️

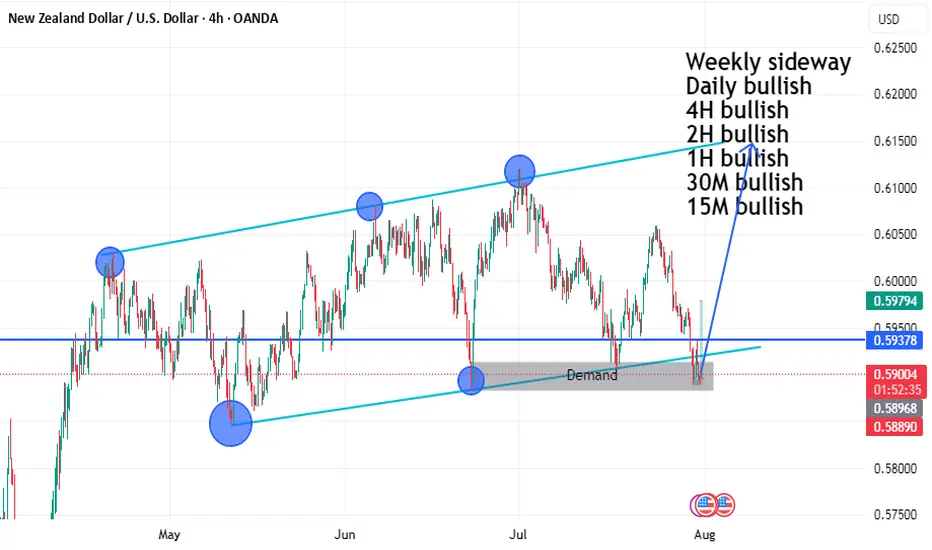
NZDUSD BUY SETUP LOOOOOOOONGHELLO
we have demand and ascending channel 4h
and low time frame the price make engulfing candle on 30m 15m on support zone
and can't make lower low so i will buy it
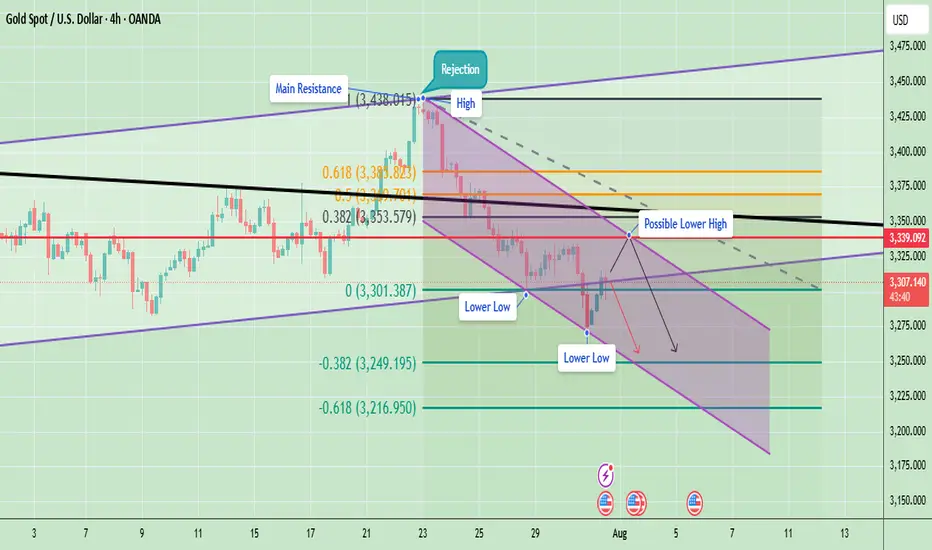
Gold Struggles at Resistance – Indicates Lower Lows AheadGold has been in a clear downtrend after facing a strong rejection around the 3,438 level (main resistance zone). Price is currently moving within a descending channel, confirming the formation of lower highs and lower lows – a classic bearish market structure.
Currently, Gold is trading near 3,306, facing resistance at 3,339 (marked as a possible lower high). If price fails to break above this level and sustain, there is a strong probability of continuation towards 3,249 and even 3,216.
Key Technical Highlights
- Immediate Resistance: 3,339 – 3,353
- Support Levels: 3,301 (short-term), 3,249, and 3,216
A rejection near 3,339 can lead to another leg down targeting 3,249 and 3,216. However, a strong breakout above 3,339–3,353 could temporarily shift momentum towards 3,394.
Note
Please risk management in trading is a Key so use your money accordingly. If you like the idea then please like and boost. Thank you and Good Luck!
Gold Spot / U.S. Dollar Analysis (15-Minute Chart)Key Levels
Support Levels:
Immediate: 3,294.000 (S/L level)
Next: 3,280.000
Resistance Levels:
Immediate: 3,304.000 (Entry level)
Next: 3,308.000, 3,316.250, 3,320.000
Profit Targets:
Tiered levels up to 3,328.000 (highest target).
Price Action & Trends
Current Trend:
The price is bullish (+0.84% today) but hovering near the entry level (3,299.000) and testing 3,302.700.
The presence of multiple profit targets above suggests a bullish bias in the trade setup.
Critical Observations:
Price recently dipped to 3,294.000 (S/L) but rebounded, indicating buying interest at support.
The 3,304.000 level (entry) now acts as resistance. A breakout above could target 3,308.000+.
Volume & Momentum:
Not visible in the screenshot, but the upward movement suggests moderate bullish momentum.
Trade Setup Analysis
Entry: 3,299.000
Stop-Loss: 3,294.000 (5 USD below entry)
Profit Targets:
3,304.000 (Breakeven+)
3,308.000 → 3,328.000 (Scalping opportunities).
Risk-Reward Ratio:
If targeting 3,328.000, the RR is ~5:1 (29 USD profit vs. 5 USD risk).
Actionable Insights
Bullish Scenario:
Hold if price sustains above 3,304.000 (entry resistance).
Next target: 3,308.000.
Bearish Caution:
If price falls below 3,294.000 (S/L), exit to limit losses.
Watch for rejection at 3,304.000 (potential reversal).
Market Context:
Gold is sensitive to USD strength and geopolitical events. Monitor broader trends for confirmation.

Gold The Week Ahead Key Support and Resistance Levels
Resistance Level 1: 3386
Resistance Level 2: 3410
Resistance Level 3: 3438
Support Level 1: 3315
Support Level 2: 3295
Support Level 3: 3268
This communication is for informational purposes only and should not be viewed as any form of recommendation as to a particular course of action or as investment advice. It is not intended as an offer or solicitation for the purchase or sale of any financial instrument or as an official confirmation of any transaction. Opinions, estimates and assumptions expressed herein are made as of the date of this communication and are subject to change without notice. This communication has been prepared based upon information, including market prices, data and other information, believed to be reliable; however, Trade Nation does not warrant its completeness or accuracy. All market prices and market data contained in or attached to this communication are indicative and subject to change without notice.

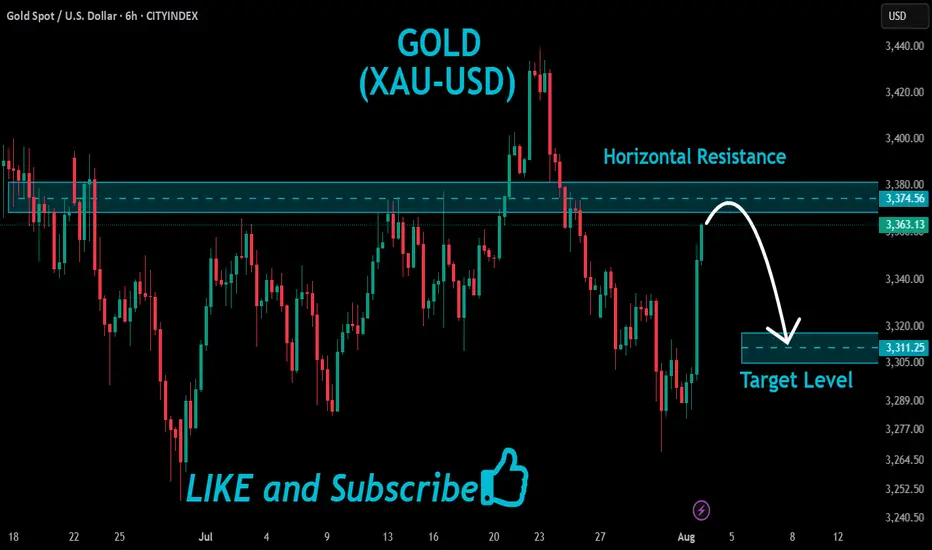
GOLD Correction Ahead!
HI,Traders !
#GOLD is growing strongly
And the pair looks locally
Overbought so after it
Hits the horizontal resistance
Area around 3374.56 we will
Be expecting a local bearish
Correction and a move down !
Comment and subscribe to help us grow !
XAUUSD Daily Sniper Plan – August 4, 2025🧠 Macro & Context
Gold is surging back toward premium structure after sweeping 3287. With no major news today, flow is dictated by structure, liquidity, and the residual strength from July’s closing push. Bulls have reclaimed internal control, but are now pressing into major resistance zones. This is the perfect battleground for sniper entries.
🔥 Bias: Bullish short-term, but hitting premium exhaustion
The current candle is testing prior supply and imbalance. Unless we break 3375–3380 cleanly, price remains vulnerable to rejection from premium. Above that, clean air until external zones. Any pullbacks into discount (under 3310) remain buyable — if the structure holds.
🎯 Daily Sniper Zones
🔷 3360–3375 – Decision Supply
📍 Where we are now
This is the current premium pressure zone. Built from a bearish OB + unmitigated imbalance from late July. First contact is live. If price rejects this level, sellers may regain control short-term. But if buyers break and hold above 3375 → bullish expansion is open. This is our Decision Zone.
🔷 3387–3405 – External Supply Block
📍 Premium target for breakout move
Clean HTF OB + imbalance resting above liquidity. If 3375 gives way, this is the next sniper target. Expect strong reaction — either reversal or inducement wick. Ideal for shorts if price shows exhaustion and BOS on LTF.
🔷 3430–3439 – Final Supply Cap (Weekly)
📍 Extreme supply wick
This is the highest defined zone on the Daily/Weekly chart before unknown territory. Full wick zone, untouched since early May. Reactions from here tend to be sharp. A strong rejection could initiate a new sell cycle.
🔷 3310–3325 – Mid-Demand Support
📍 Pullback buy zone
If price rejects 3375 and pulls back, this is the first area to monitor for higher low formation. Built from bullish OB, Fibonacci 50%, and alignment with internal structure. RSI supports buyers here if retested cleanly.
🔷 3285–3300 – Key Reversal Demand
📍 The origin of the current rally
Strong institutional footprint. Last BOS + OB confluence area. Any retest here is valid for sniper buys as long as no bearish HTF shift appears.
🔷 3240–3260 – Final Daily Demand Base
📍 Only valid if structure breaks down
If we lose 3285, this is the last demand zone holding Daily structure. Deep discount + HTF mitigation block. A visit here would require bearish breakdown first.
🧠 Game Plan Summary
⚠️ Right now, we are in a decision zone (3360–3375). Do not rush. Wait for confirmation.
✅ If we break 3375, next bullish target = 3405, then 3439.
🔻 If we reject 3375, watch for controlled retracement into 3325 or 3300 for buys.
⛔️ Do not sell blindly into current price — we are at equilibrium.
💬 If this sniper breakdown sharpened your vision, show some love ❤️
Comment, follow, and hit that like to stay locked in with GoldFxMinds.
More sniper updates dropping 💥
Powered by Trade Nation – for clear structure and no chart noise.
Bitcoin’s Game Has Changed: Fresh Support Zone, Targets Sky-HighHey Dear Friends,
Until recently, Bitcoin had been stuck in a range between 112,331 and 105,344 for quite some time. But that range has now been clearly broken. So, what does this mean? This zone, which used to act as resistance, is now expected to flip and act as support.
According to my weekly trading model, the long-term target levels I’m tracking for Bitcoin are: 127,818 – 137,000 – 146,000.
Since this is a weekly setup, it might take a while for these targets to play out. Even if we see pullbacks to the 112K, 105K, or even 100K levels, I expect to see strong buying pressure from that zone.
I’ll keep sharing regular updates as this setup develops.
To everyone who’s been supporting and appreciating my work—thank you, truly. Your encouragement means the world to me and keeps me motivated to keep showing up. Much love to all of you—I’m grateful we’re in this journey together.

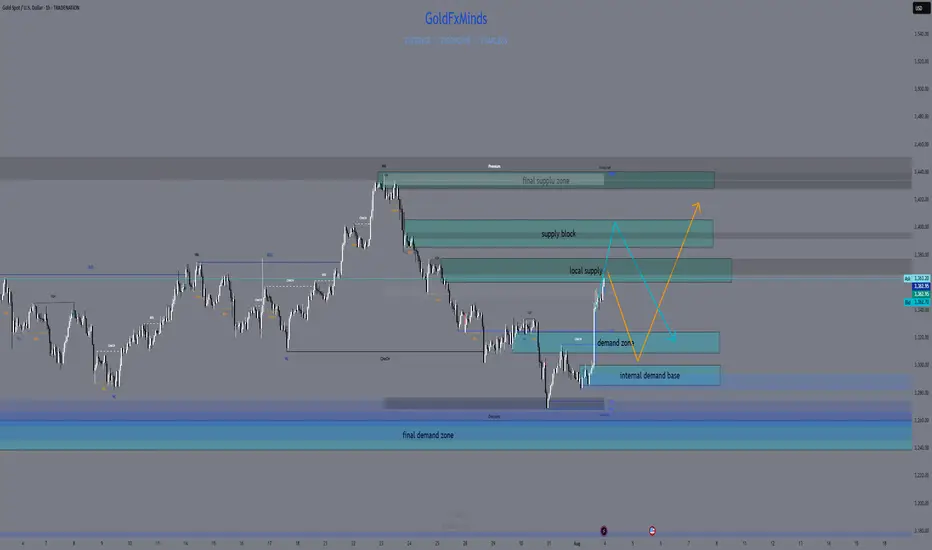
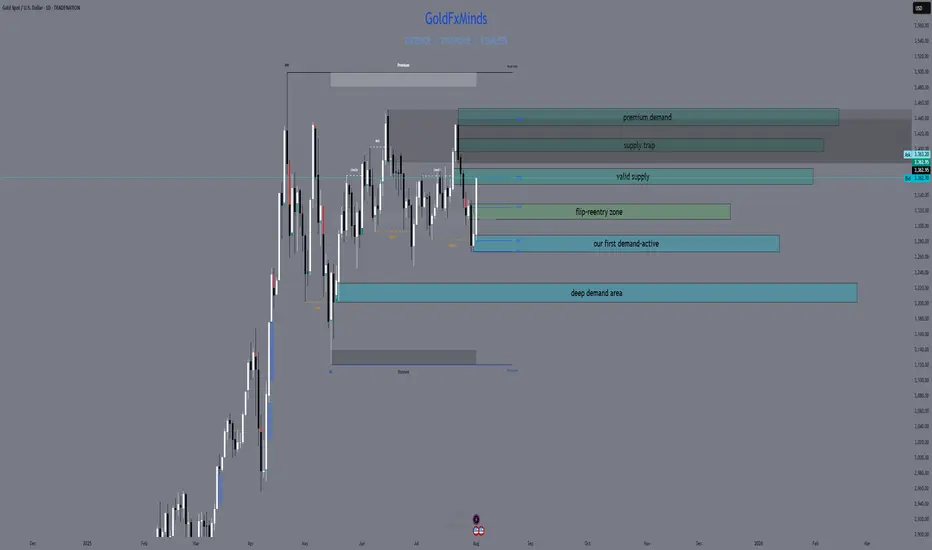
XAUUSD H4 Outlook – August 4, 2025Structure is bullish — but supply is layered. Precision now matters more than bias.
—
Gold is trading at 3362, sitting right inside the heart of a key structural zone. After a strong breakout from 3285–3260, price reclaimed imbalance, broke internal structure, and powered higher into premium. The trend is bullish — but we’ve just stepped into stacked supply.
Let’s break down every zone that matters now, from top to bottom:
🟥 3360–3375 – Valid H4 Supply Zone
This is the first active supply block — the origin of the last bearish leg. It holds a clean OB + imbalance and is currently being tested for mitigation.
We're inside it right now. This zone is critical:
→ If price breaks and holds above it, continuation is likely
→ If we reject here, it confirms sellers are defending their level
🟥 3385–3398 – Internal Supply Trap
A secondary supply zone built from previous order flow.
If bulls push through 3375 without rejection, this is the next area to watch for weakness.
This zone often creates fake breakouts, especially when momentum slows. RSI is already showing signs of exhaustion approaching this level.
🟥 3420–3440 – HTF Supply Trap
This is the top — the last unmitigated supply on the weekly.
It's not in play yet, but if bulls break above 3398 decisively, this is where the bigger trap could form.
Any long into this zone must be backed by strong structure and continuation candles — otherwise, it’s a liquidation magnet.
🟫 3322–3310 – Flip Reentry Zone
If we reject from current supply, this is the first high-probability reentry for bulls.
It’s where the last CHoCH confirmed, and it aligns with EMA confluence and minor imbalance.
Buy setups from here must be confirmed on M15/M30 — no blind longs.
🟦 3285–3260 – Breaker Demand Base
The true origin of the bullish move.
This zone caused the structural flip — clean OB, FVG stack, and liquidity sweep.
If price returns here, it becomes a must-hold for bullish continuation. One of the best sniper zones for longs.
🟦 3222–3205 – Final Demand Layer
Deep structure zone holding imbalance + previous HL base.
Only comes into play if 3260 fails. A break below this would shift bias to neutral or bearish on H4.
🎯 Bias Summary
✔️ H4 bias = bullish
✔️ Price is inside 3360–3375 supply
✔️ EMA 5/21/50 aligned, but RSI is elevated
⚠️ This is not a breakout — it’s a test zone
🔁 Execution Plan
📍 Rejection from 3360–3375 → sell scalp toward 3322
📍 Clean break of 3375 → watch for next short at 3385–3398
📍 Failure of 3398 → HTF draw toward 3430–3439
📍 Pullback toward 3322–3310 → potential long zone
📍 Clean drop to 3285 → high-RR buy area
📍 Break below 3260 → only valid demand left is 3222
—
This is not the time to chase. It’s the time to stalk.
You’re in premium. Supply is active. Let structure decide — you just execute with clarity.
—
Which zone are you watching for your next move?
Comment your bias below 👇🏼 Smash the ❤️ if this brought clarity, and follow GoldFxMinds to trade with precision every day.
Disclosure: Chart based on Trade Nation feed (TradingView).

XAUUSD Daily Outlook – August 4, 2025We’re not in breakout. We’re deep in premium — and supply is stacked.
—
Gold is now trading at 3362, sitting right inside the first valid daily supply zone — the same block between 3355 and 3375 that caused the last rejection. The bullish rally from 3272 was clean: liquidity sweep, CHoCH, imbalance filled, HL confirmed. Bulls did their job. Now they’re walking straight into pressure.
Above this zone, things don’t get easier — they get trickier.
Just a bit higher, we have an internal supply trap between 3398 and 3412. It’s a reaction zone built from imbalance and inducement — not strong enough to hold a reversal on its own, but perfect to fake out breakout buyers. If price pushes through 3375 and enters this pocket, snipers should be watching carefully for early signs of weakness.
And finally, at the top of the current structure sits the HTF supply trap at 3430–3439 — the last weekly wick, the macro reversal zone. That level is sacred. If price makes it there, either we’ll see full-blown expansion… or a violent reversal born from overconfidence.
So what do we do now?
We wait.
If price starts to reject from this 3355–3375 supply with bearish intent, we target the flip reentry zone at 3318–3328 — the previous CHoCH break and dynamic EMA cluster. That’s your first intraday long trigger if bulls want to come back strong.
If that breaks, next is the demand base at 3287–3267, the origin of this entire bullish move. Below that? Imbalance support near 3225 — the final line before structure shifts.
—
🟥 Valid Supply Zone → 3355–3375
🟥 Internal Supply Trap → 3398–3412
🟥 HTF Supply Trap → 3430–3439
🟫 Flip Reentry Zone → 3318–3328
🟦 Demand Base → 3287–3267
🟦 Imbalance Support → 3225–3205
—
This isn’t a breakout. It’s a build-up inside premium.
The smartest move today might be no move — until structure speaks.
—
Are you watching for the rejection? Or the breakout trap?
Let us know your bias below 👇🏼
Tap that ❤️ if this gave clarity, and follow GoldFxMinds to stay ahead of every key level — no noise, just structure.
—
With sniper calm and strategic clarity,
GoldFxMinds 💙
Disclosure: Analysis based on Trade Nation TradingView chart feed.
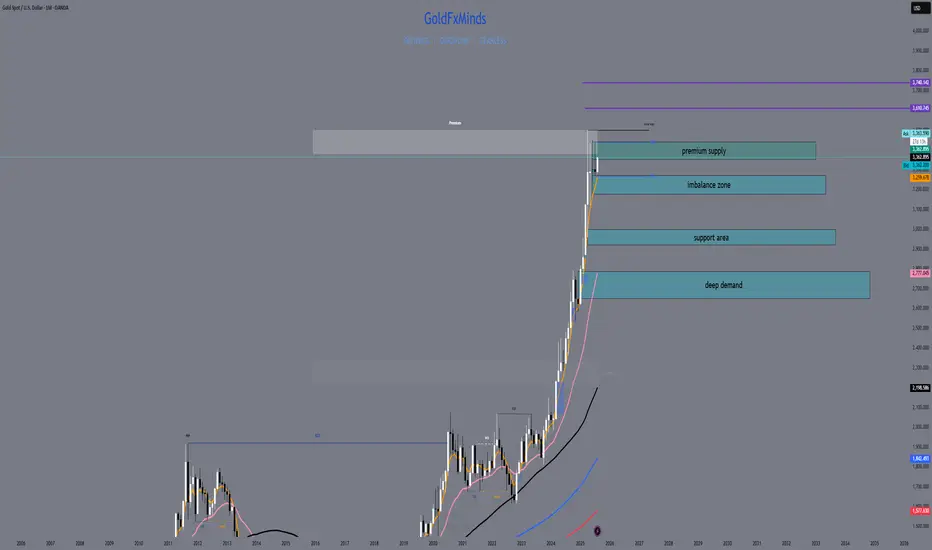
XAUUSD Weekly Outlook – August 4–8, 2025
The question isn’t whether gold is strong. The question is — will price expand, or rebalance?
🔸 Macro Overview
Gold begins the week consolidating just below its final HTF supply zone (3439), while USD weakens amid mixed macro data and growing speculation of future rate cuts. Markets await fresh catalysts, and gold’s recent impulsive rally is now facing the big test: break the wick, or pull back?
🔸 Weekly Structure & Bias
Element Observation
🔹 Trend Bullish continuation — clean structure
🔹 Last BOS March 2025 — impulsive, with imbalance below
🔹 Price Action Top wick rejection forming near 3439
🔹 Bias Still bullish, but entering exhaustion zone
🔹 RSI Above 70 — overheated
🔹 EMAs EMA5 > EMA21 > EMA50 > EMA100 — perfect trend
🔸 Key Weekly Levels (Zones + Confluences)
Zone Type Price Range Confluences
🔴 Supply 3350 – 3439 HTF wick supply + FVG + RSI 70+ + liquidity trap
🔵 Demand 3270 – 3215 Weekly OB + FVG + EMA21 support
🔵 Demand 3120 – 3070 Old BOS + deep FVG + psychological level
🟢 Support 3000 zone EMA50 + historical consolidation
🔸 Fibonacci Extensions (Above 3439)
Extension Level Price Target Confluences
1.0 (Swing Full) 3439 Supply wick high
1.272 3505 Next psychological milestone
1.414 3560 Mid-extension + liquidity
1.618 3610 Golden expansion target
2.0 3740 Full trend extension (max)
🔺 These levels serve as potential breakout targets ONLY if we get a confirmed weekly close above 3439 with clean BOS on LTF.
🔸 Weekly Scenarios
🟢 Scenario 1 – Break and Expand
If gold breaks 3439:
Expect clean continuation to 3505 → 3560 → 3610
Best entries come from new OBs on H4/D1 around 3350–3370
Follow momentum — but don’t chase without retrace confirmation
🔻 Scenario 2 – Rejection + Retracement
If price holds below:
Pullback toward 3270 – 3215 expected
EMA21 acts as dynamic support
If selloff gains strength, next demand = 3120 – 3070
🎯 This zone aligns with macro OB + re-entry for long-term bulls.
🔸 Conclusion & Gameplan
Gold is pressing against its final weekly ceiling.
Structure remains bullish, but every sniper knows — at the edge of premium, timing is everything.
✅ Above 3439 → expansion opens to 3505 → 3560 → 3610
🟦 Below 3439 → retracement into 3270 → 3215 → 3070
The best setups will be born from confirmation, not prediction. Let the market decide.
—
What would you do if 3439 rejects hard this week?
Comment your plan, tag your sniper level, and let’s stay ahead together 💬
—
With clarity, confidence, and perfect timing,
GoldFxMinds 💙
Disclosure: Analysis based on Trade Nation (TradingView) chart feed.

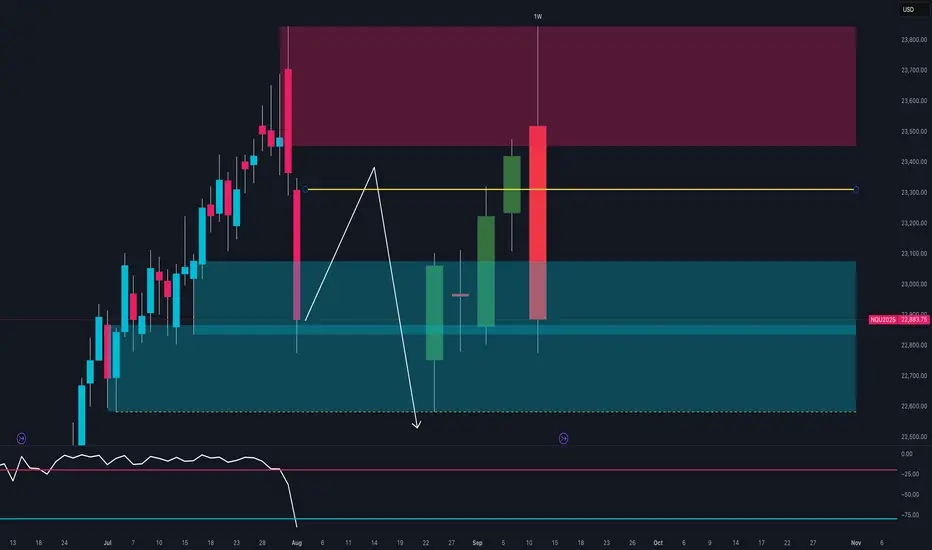
NASDAQ at Key Turning Point 🔍Technical Context
After testing the 23,600–23,800 supply zone, price printed a strong bearish rejection with a weekly engulfing candle.
The RSI broke decisively below the midline, signaling a clear loss of momentum.
Price is now trading back within the weekly demand zone between 22,800 and 22,950.
If a pullback toward 23,200 occurs, it could offer a fresh short opportunity, with downside targets around 22,600.
🪙 COT Report – July 29
Non-Commercials (speculators):
Long: +8,581
Short: +4,355
Commercials (hedging):
Long: +4,955
Short: +8,556
The market remains net long, but commercials are increasingly hedging with shorts.
The current imbalance — 88.6% long vs 11.3% short — suggests excessive bullish positioning, raising the risk of a correction.
🗓️ Seasonality – August
August is historically strong for the NASDAQ:
+222 pts (10Y)
+400 pts (5Y)
+912 pts (2Y)
While the trend is clearly bullish seasonally, caution is warranted:
Tops are often formed during the first half of August, followed by more pronounced corrections in September.
📉 Operational Summary
Primary scenario:
Wait for a retest of the 23,200–23,250 area
Look for rejection signals → enter short
Target 1: 22,800
Target 2: 22,600
Alternatively:
If 22,800 breaks on a strong weekly close, deeper downside scenarios may unfold.
XAUUSD August 2025 Monthly OutlookWelcome to August — and welcome to the top of the macro ladder. Gold is not just rising. It’s rewriting structure.
🔸 Macro & Fundamentals
Gold opens August with a fresh impulsive breakout above $3360, fuelled by a weaker USD, rising global risk sentiment, and continued speculative positioning from institutional buyers. The upcoming Jackson Hole meeting and shifting Federal Reserve expectations create the perfect climate for volatility. All eyes are now on the premium structure top — but will gold expand beyond it or retrace to refill?
🔸 Monthly Trend & Bias (HTF Overview)
🔹 Structure: Clean bullish BOS, continuation leg in progress
🔹 Last CHoCH: April 2023 → Confirmed full trend shift bullish
🔹 Current Monthly Candle: Explosive push into supply with top wick rejection beginning to show
🔹 Bias: Still bullish but in extreme premium — watch for cooling/rebalancing
🔸 EMA Structure
| EMA Type | Status | Signal |
| ----------- | -------------- | ------------------------------------- |
| EMA 5 / 21 | Strong Bullish | Dynamic expansion, steep angle upward
| EMA 50 | Below | Clean breakout from range
| EMA 100/200 | Far below | Long-term uptrend deeply intact
🔸 Key HTF Levels (Wick-to-Wick Mapping)
Zone Type Price Range Confluences
🔴 Premium Supply 3350 – 3439 Monthly FVG + Wick exhaustion + RSI 80+
🔵 Bullish Imbalance 3180 – 3270 Monthly FVG + old BOS + EMA5 baseline
🔵 Mid-Level Support 2920 – 3000 Monthly OB + FVG + structure base
🔵 Deep Demand 2670 – 2780 HTF equilibrium zone + RSI support
✅ The current candle has pierced into the final wick supply, but with clear signs of loss in momentum.
⚠️ If 3439 breaks cleanly, next expansion zone opens toward 3505 → 3610 (Fibonacci projection). Otherwise, expect cooling to 3270–3180 first.
🔸 Fibonacci Context
🔻 Swing Low: 1810
🔺 Swing High: 3439
🎯 Current price ($3363) sits just below the 100% Fibonacci projection, with the 1.272 and 1.618 extensions at 3610 and 3740.
This confirms we are in a macro premium, and any long positions from here forward must be built only on strong LTF confirmation or clean pullbacks into value.
🔸 August Scenarios
🟢 Scenario 1 – Breakout + Price Discovery
If bulls break 3439 with strong volume and close:
New leg toward 3505 → 3610 opens
Watch for LTF continuation on H4–D1 with bullish OB reentry
Only valid if 3350 holds as new support
🔻 Scenario 2 – Rejection + Healthy Pullback
If price holds below 3439 and monthly wick exhausts:
Clean retracement toward 3270 → 3180 expected
EMA5/21 rebalancing will support bullish structure
Deeper rejection could retest 3070 zone if volatility spikes
🔸 Conclusion & Action Plan
We open August fully inside the last monthly supply zone. Trend is still bullish, but RSI, FVGs, and EMA distance warn us: this is not the time to chase — it’s time to wait for structure to speak.
📌 Key pivot = 3439.
Above it → Expansion.
Below it → Retracement.
Let August unfold — but stay sharp. The next big move will be born from this compression.
—
What’s your take — are we just getting started or about to cool off?
Drop your thoughts, chart it out, and stay ready for what August brings. ⚔️
—
❤️ Like if you enjoy clean, actionable updates🚀🚀🚀
🔁 Share with traders who love structure over noise
With clarity, confidence, and control,
GoldFxMinds
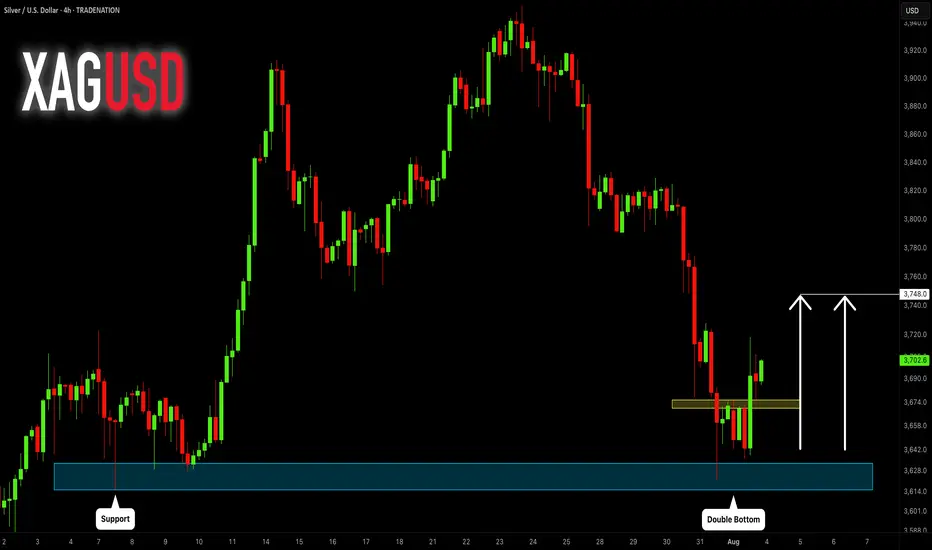
SILVER (XAGUSD): More Growth Ahead
It looks like Silver is going to continue growing next week,
following a strong bullish reaction to a key daily horizontal support.
The next strong resistance is 3748.
It will be the next goal for the buyers.
❤️Please, support my work with like, thank you!❤️
I am part of Trade Nation's Influencer program and receive a monthly fee for using their TradingView charts in my analysis.
GOLD: Target Is Down! Short!
My dear friends,
Today we will analyse GOLD together☺️
The market is at an inflection zone and price has now reached an area around 3,353.10 where previous reversals or breakouts have occurred.And a price reaction that we are seeing on multiple timeframes here could signal the next move down so we can enter on confirmation, and target the next key level of 3,335.20..Stop-loss is recommended beyond the inflection zone.
❤️Sending you lots of Love and Hugs❤️

Possible Gold Reaction Scenarios to Today's Jobs ReportMarket expectations for today's nonfarm payrolls change to be 104k, with the unemployment rate projected to rise to 4.2% from 4.1%. The divergence between payroll growth and the unemployment rate is mainly due to the birth-death model used in payroll calculations and expectations for either a halt or rebound in the labor force participation rate.
Fed Chair Powell recently stated that the "main number to watch" is the unemployment rate, which raises its importance in today’s data release. If the participation rate rises sharply, the unemployment rate could even increase to 4.3%, which may put a cap on the recent rally in the dollar index.
There is also a risk that a very strong payrolls number could be released alongside a rise in the unemployment rate. This combination may trigger a volatile and uncertain market reaction with multiple direction changes.
In similar past scenarios, markets typically reacted first to the payrolls data, then shifted focus to the unemployment rate shortly after.
For gold, look for 3310 and 3288 as pivot levels that could open the door to 3342 on the bullish case and 3270 on the bearish case.

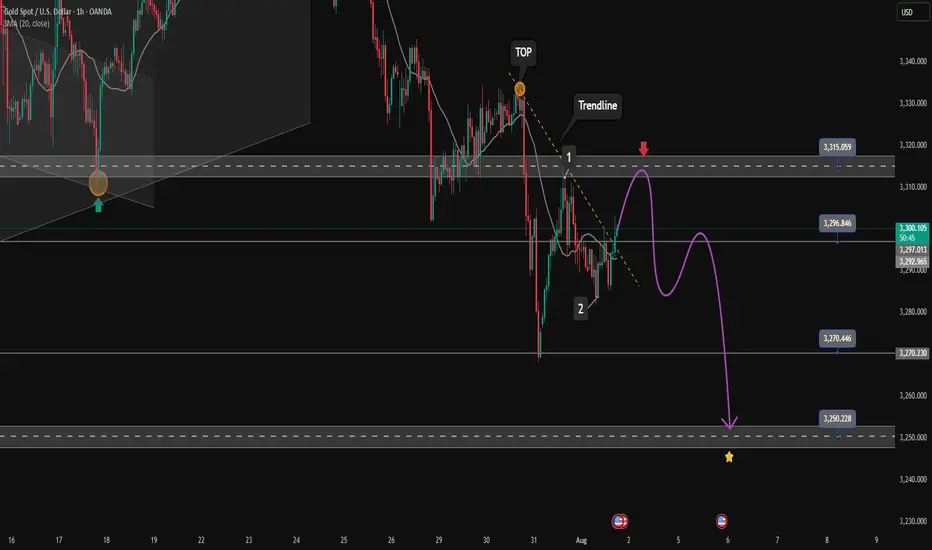
Nonfarm Pay Attention Zone✏️ OANDA:XAUUSD is recovering and increasing towards the resistance zone of yesterday's US session. The 3315 zone is considered a strategic zone for Nonfarm today. A sweep up and then collapse to the liquidity zone of 3250 will be scenario 1 for Nonfarm today. If this important price zone is broken, we will not implement SELL strategies but wait for retests to BUY. It is very possible that when breaking 3315, it will create a DOW wave with the continuation of wave 3 when breaking the peak of wave 1.
📉 Key Levels
SELL trigger: Reject resistance 3315.
Target 3250
BUY Trigger: Break out and retest resistance 3315
Leave your comments on the idea. I am happy to read your views.