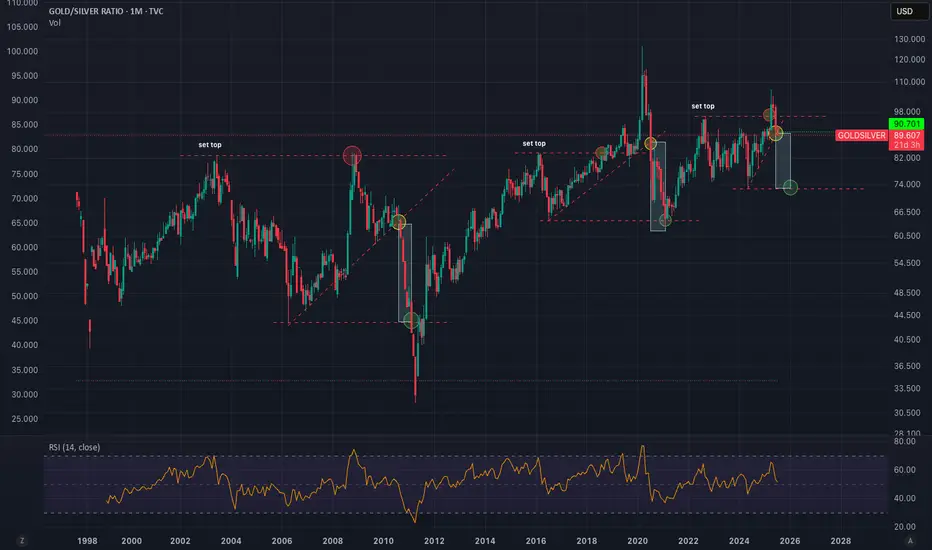
Gold/Silver Ratio to 72 Minimum - Imminent Silver BreakoutGoldSilver Ratio is following a clear pattern of behavior. We can expect a return to mean conservatively hitting 72 at a minimum. This puts silver at $46-58 if Gold doesn't move higher. I think we will see silver 5-10X over the next few years. Easy 25-50% in the short term (6-12 months).
Gold
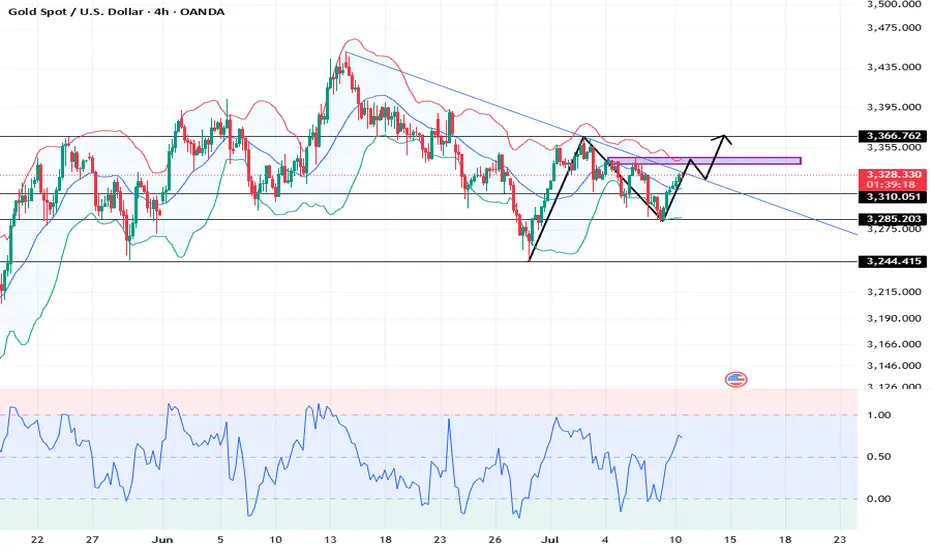
GOLD ROUTE MAP UPDATEHey Everyone,
Another PIPTASTRIC day on the markets with our chart idea and levels playing out and being respected, as analysed.
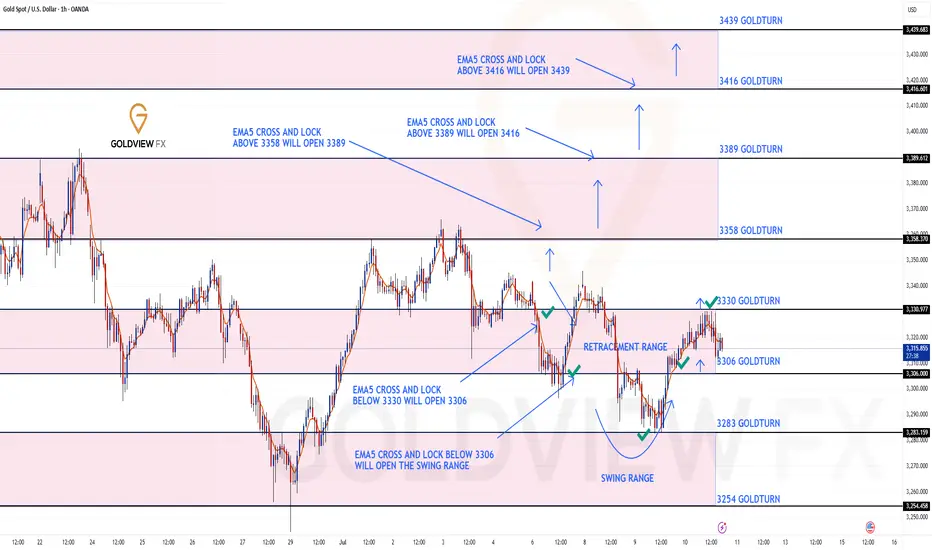
After completing the swing range test and full swing into 3306, we stated yesterday that we will now look for ema5 cross and lock above 3306 to open 3330. This was locked and loaded and completed the 3330 target today.
We will now continue to look for ema5 lock above 3330 for a continuation into the bullish targets above or failure to lock will see rejections into the lower Goldturns for support and bounce inline with our plans to buy dips.
We will keep the above in mind when taking buys from dips. Our updated levels and weighted levels will allow us to track the movement down and then catch bounces up.
We will continue to buy dips using our support levels taking 20 to 40 pips. As stated before each of our level structures give 20 to 40 pip bounces, which is enough for a nice entry and exit. If you back test the levels we shared every week for the past 24 months, you can see how effectively they were used to trade with or against short/mid term swings and trends.
The swing range give bigger bounces then our weighted levels that's the difference between weighted levels and swing ranges.
BULLISH TARGET
3358
EMA5 CROSS AND LOCK ABOVE 3358 WILL OPEN THE FOLLOWING BULLISH TARGETS
3389
EMA5 CROSS AND LOCK ABOVE 3389 WILL OPEN THE FOLLOWING BULLISH TARGET
3416
EMA5 CROSS AND LOCK ABOVE 3416 WILL OPEN THE FOLLOWING BULLISH TARGET
3439
BEARISH TARGETS
3330 - DONE
EMA5 CROSS AND LOCK BELOW 3330 WILL OPEN THE FOLLOWING BEARISH TARGET
3306 - DONE
EMA5 CROSS AND LOCK BELOW 3306 WILL OPEN THE SWING RANGE
3283 - DONE
3254
As always, we will keep you all updated with regular updates throughout the week and how we manage the active ideas and setups. Thank you all for your likes, comments and follows, we really appreciate it!
Mr Gold
GoldViewFX
Night range operation, technical outlook is still bearishGold fell as expected after repeated battles at 3330. Currently, gold has returned to around 3320. This shows that the rebound was mainly driven by short-term risk aversion. As market news calms down and sentiment stabilizes, the market will most likely return to the technical trend. If it unexpectedly breaks through 3330, it is expected to touch the 3345 line I mentioned this morning. The short-term 3310 line currently has certain support. From a technical point of view, I prefer to short. Once it falls below 3310, the subsequent support will move to 3295-3285. Therefore, I think it is a good choice to short again at 3320-3330.
OANDA:XAUUSD
Gold Coils Beneath Resistance – Breakout Setup Brewing Above $3,Gold remains in a consolidation phase after its sharp rally earlier this year, but the broader uptrend remains intact. Price action continues to respect the ascending trendline that has been active since late 2024, as well as the 50-day SMA which currently offers dynamic support around the $3,323 level.
The key horizontal resistance at $3,430 continues to cap upside attempts. Price has formed a series of higher lows while facing rejection at this ceiling, suggesting a potential ascending triangle pattern—a bullish continuation setup.
Indicators:
MACD remains below the zero line and has flattened, reflecting the lack of momentum and confirming the consolidation.
RSI hovers near 47, showing neutral momentum. However, it has started to curl up slightly, which could hint at a developing bullish bias if price breaks higher.
Key Levels to Watch:
A confirmed breakout above $3,430 could open the door to fresh highs.
On the downside, a break below the ascending trendline and 50-day SMA could trigger a deeper correction toward the 200-day SMA near $2,950.
Conclusion:
Gold is currently coiling within a tightening range. While momentum is subdued, the technical structure favors a potential bullish breakout if resistance at $3,430 gives way. Traders should watch for a daily close above this level for confirmation of renewed bullish momentum.
-MW

GOLD: Long Trade with Entry/SL/TP
GOLD
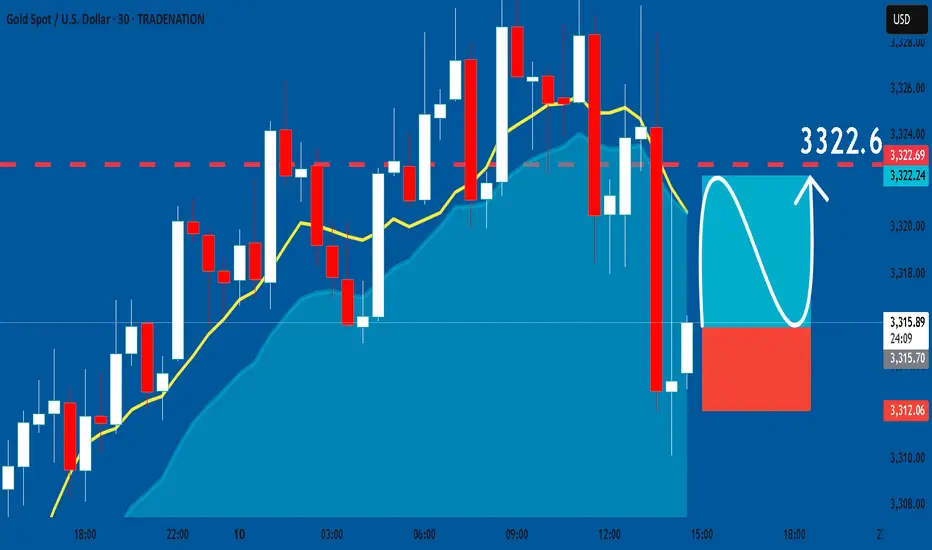
- Classic bullish formation
- Our team expects pullback
SUGGESTED TRADE:
Swing Trade
Long GOLD
Entry - 3315.7
Sl - 3312.0
Tp - 3322.6
Our Risk - 1%
Start protection of your profits from lower levels
Disclosure: I am part of Trade Nation's Influencer program and receive a monthly fee for using their TradingView charts in my analysis.
❤️ Please, support our work with like & comment! ❤️
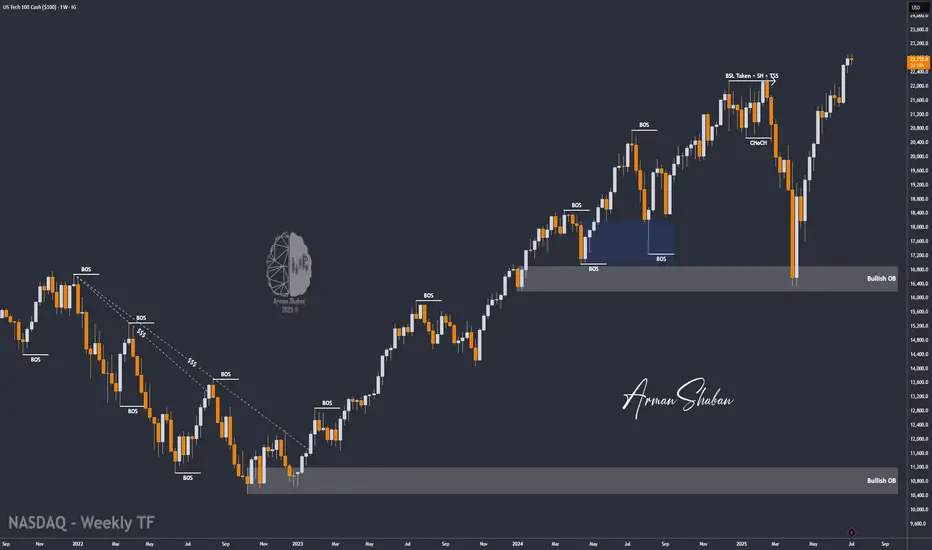
Nasdaq Surges to New Highs – 23,200 and 24,000 in Sight? (READ)By analyzing the Nasdaq chart on the weekly timeframe, we can see that the index is currently trading around the 22,700 zone and has followed the main analysis perfectly so far — continuing to print new all-time highs.
According to the original outlook, as long as the index holds above 22,150, we can expect further bullish continuation toward the next targets at 23,200 and 24,000.
Please support me with your likes and comments to motivate me to share more analysis with you and share your opinion about the possible trend of this chart with me !
Best Regards , Arman Shaban
Bearish is still the main trend, first test 3250 supportYesterday, as the market expected a trade agreement to be reached between the US and its trading partners, risk sentiment was boosted. The strengthening of DXY and the rise in US Treasury yields put some pressure on gold.
On Monday, gold rebounded to 3320, and on Tuesday it touched above 3320 and began to fall sharply. In the short term, 3320 is a key trading position that we need to pay attention to. From the daily chart, the support line of 3320 has been completely broken, and the two major support points below are 3250 and 3200 respectively. Judging from the 4H chart, the decline may have just begun. Next, we may first face a test of the 3250 support line. If the 3250 support can be maintained, gold will maintain a volatile consolidation in the short term. Otherwise, if it falls below 3250, it will test the 3200 mark.
OANDA:XAUUSD
Gold Eyes 3365 as Tariff Tensions Support Bullish MomentumGOLD OVERVIEW
Gold extended gains to around $3,329 amid a weaker dollar and ongoing tariff tensions, with markets reacting to new U.S. trade actions and divided Fed minutes on rate cuts.
Technical Outlook:
Gold remains bullish while above 3320.
A 1H close above 3342 opens the door to 3365.
A 1H close below 3314 will turn sentiment bearish toward 3297 and potentially 3282.
Resistance: 3330, 3342, 3365
Support: 3309, 3297, 3282
Gold fluctuates, continue to short at 3345 during the dayTrump's trade policy continues to stimulate risk aversion. Although the Federal Reserve's meeting minutes are neutral, they can potentially provide support for gold. Yesterday we gave the short positions of 3321 and 3333, which have generated profits so far. At the same time, it should be noted that the 4H MACD indicator has the potential demand to form a golden cross. In the short term, there is a certain suppression force at 3330-3335. If the Asian and European sessions repeatedly test this position but fail to break through effectively, you can go short without hesitation. If you want to go short again during the day, you can consider 3340-3345 and defend 3350. The lower 3310-3305 is a relatively strong support area during the day. If the Asian session retreats to this point, you can consider going long, with the target looking at 3330-3335.
OANDA:XAUUSD
Perfect prediction, pay attention to the high short entry pointTrump extended the tariff agreement to August 1 and began to collect tariffs again. Although it eased market tensions, his remarks will not be extended after the expiration, and he issued a tariff threat, which increased global trade uncertainty and pushed up risk aversion. There was no clear direction coming out of the Fed's meeting minutes last night, but the potential bias was bullish.
At the beginning of the Asian session this morning, I also indicated that gold would rise and then fall. At present, it has reached the highest point near 3325 and then began to retreat, but the 4H golden cross has just been formed. There is still a certain pressure above 3333. If the gold price repeatedly competes for this position, we can continue to short without hesitation. The second short position today is near 3340-3345. There is potential momentum for the bulls in the short term. If the European session continues to fluctuate below 3333, then the entry of short positions will be slightly more stable. Yesterday, short orders were given at the key points of 3321 and 3333, and TP looked at 3310. If the bulls re-emerge below 3310-3305, you can consider short-term long positions and target 3330-3335.
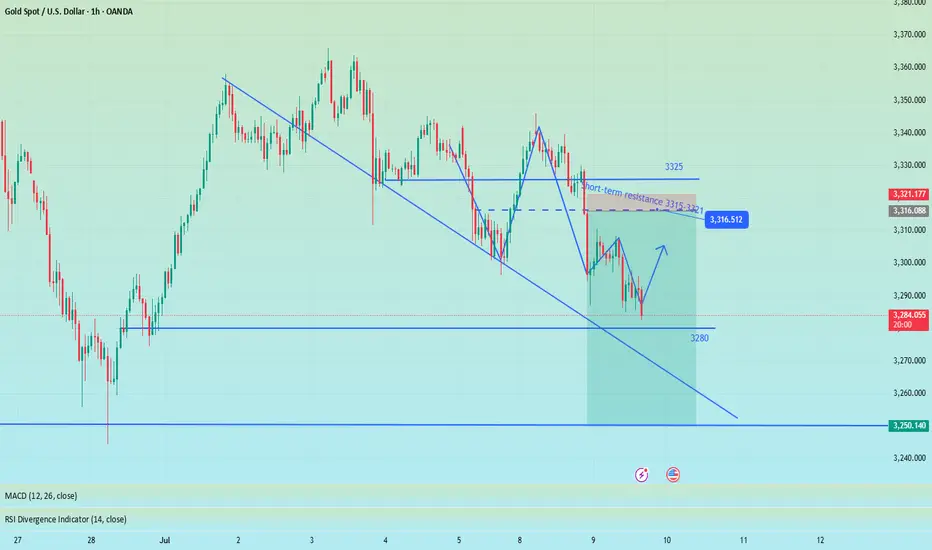
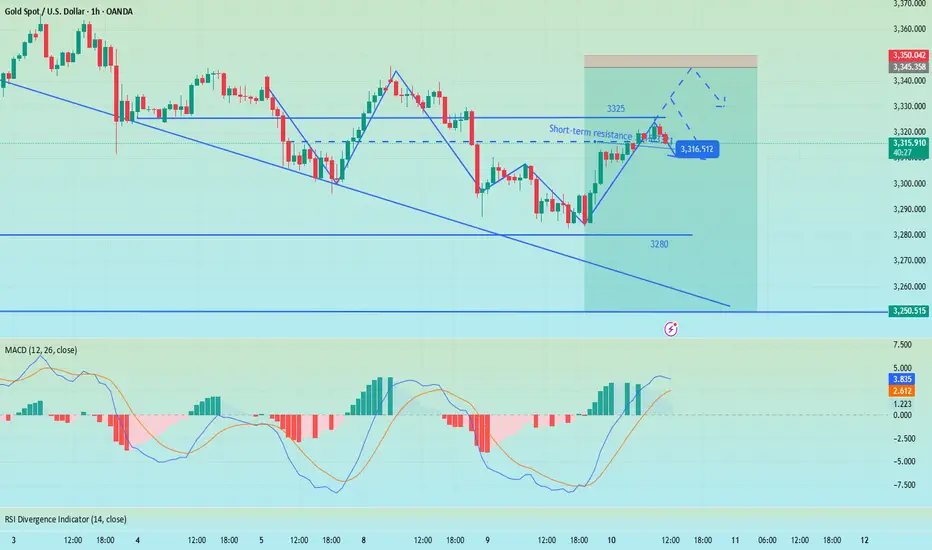
Gold rebounds as expected, NY focuses on the Fed meeting📰 News information:
1. Federal Reserve meeting minutes
📈 Technical Analysis:
Gold fell into a narrow range of fluctuations during the European trading session. As I said this morning, gold is expected to rebound in the short term and the bullish momentum needs to be released. From a technical perspective, the overall market is still in a volatile pattern. The support at the 3280 level below is still a key point that needs attention in the short term. The European session has repeatedly tested this area. If it falls below this support, it is expected to touch the 3250 level as I said. While guarding against gold diving during the NY session, the upper resistance of 3315-3321 cannot be ignored to prevent bullish retaliation.
🎯 Trading Points:
SELL 3315-3321-3333
TP 3300-3290-3280-3250
In addition to investment, life also includes poetry, distant places, and Allen. Facing the market is actually facing yourself, correcting your shortcomings, facing your mistakes, and exercising strict self-discipline. I share free trading strategies and analysis ideas every day for reference by brothers. I hope my analysis can help you.
OANDA:XAUUSD PEPPERSTONE:XAUUSD FOREXCOM:XAUUSD FX:XAUUSD FXOPEN:XAUUSD TVC:GOLD
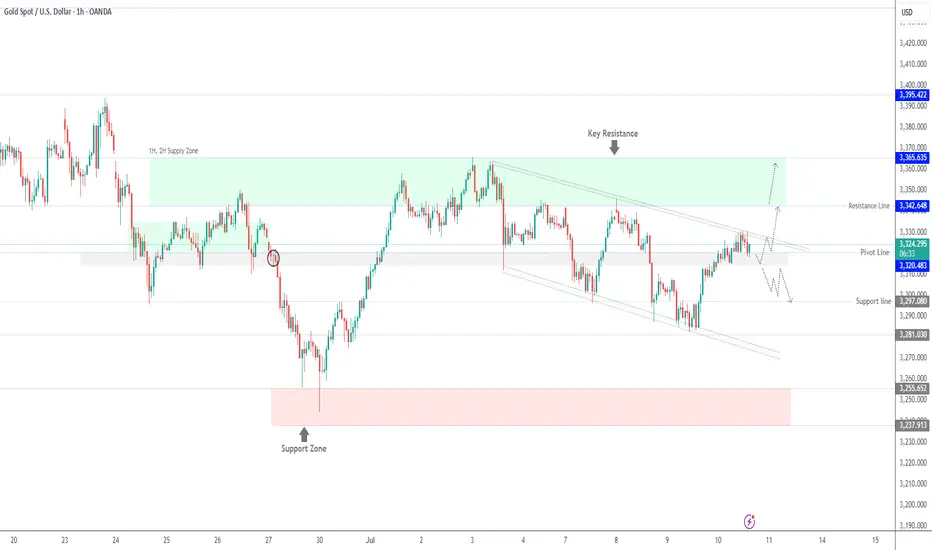
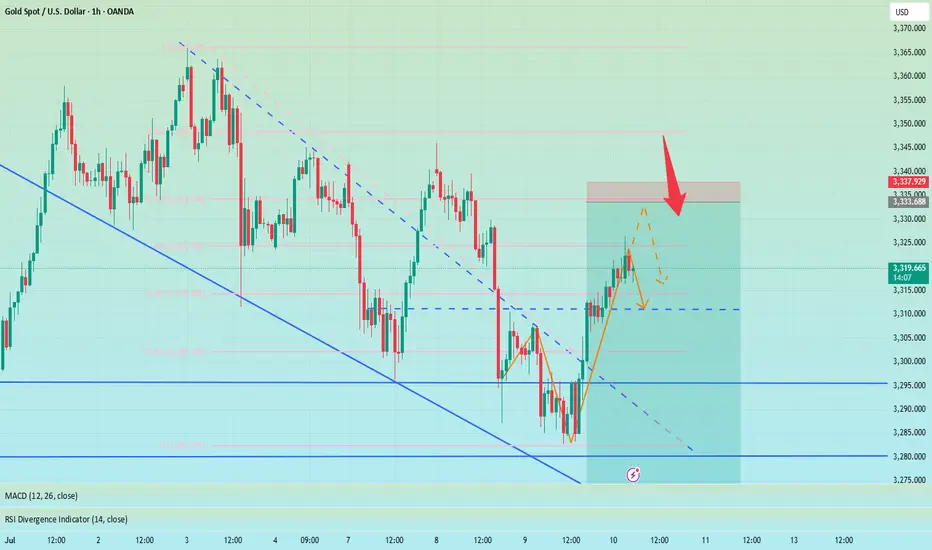
Support Under Siege – Is Gold Ready for Another Leg Down?As I expected in the previous idea , Gold ( OANDA:XAUUSD ) rose to $3,343 on the 1-hour time frame , but failed to break the Resistance zone($3,350-$3,326) and started to fall with relatively good momentum .
Do you think Gold can finally break the Support zone($3,312-$3,280) and Support lines , or will it rise again?
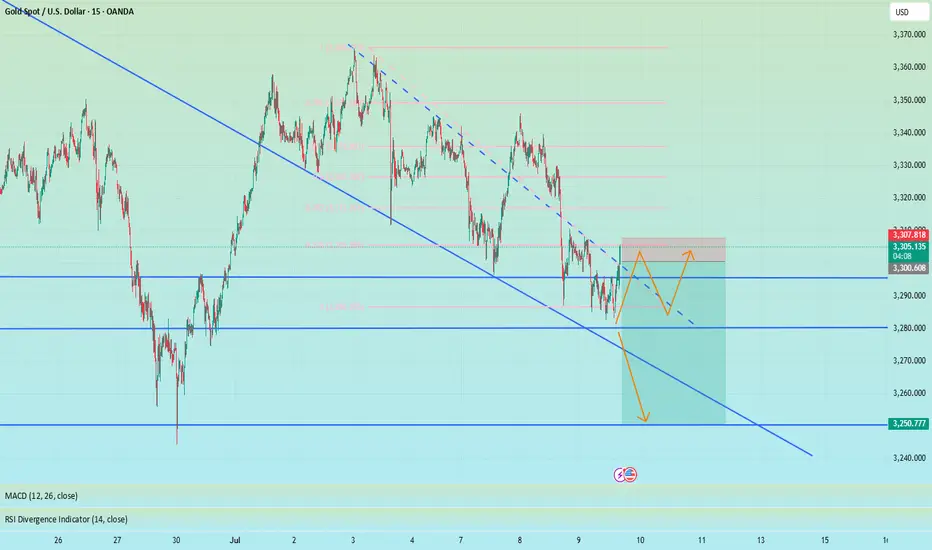
Gold is currently trading in the Support zone($3,312-$3,280) and near the Support line s. It has also managed to break the downtrend line .
In terms of Elliott Wave theory on the 15-minute time frame , Gold appears to be completing a main wave 4 . The main wave 4 appears to follow Double Three Correction(WXY) . Also, the main wave 3 is extended due to the high downward momentum.
I expect Gold to start falling again by entering the Potential Reversal Zone(PRZ) or Resistance zone($3,302-$3,296) and eventually breaking the Support zone($3,312-$3,280) and Support lines, Gold's falling targets are clear on the chart.
Note: Stop Loss (SL) = $3,313
Gold Analyze (XAUUSD), 15-minute time frame.
Be sure to follow the updated ideas.
Do not forget to put a Stop loss for your positions (For every position you want to open).
Please follow your strategy; this is just my idea, and I will gladly see your ideas in this post.
Please do not forget the ✅ ' like ' ✅ button 🙏😊 & Share it with your friends; thanks, and Trade safe.

GOLD - SHORT TO $2,800 (UPDATE)I know this constant whipsaw price action on Gold, of seeing it move up & down it testing a lot of peoples patience & liquidating short term buyers & sellers who keep buying at this level with no real trading plan.
But that is how I know the market is doing its job. Flushing out the weak, retail market traders before making its big move.
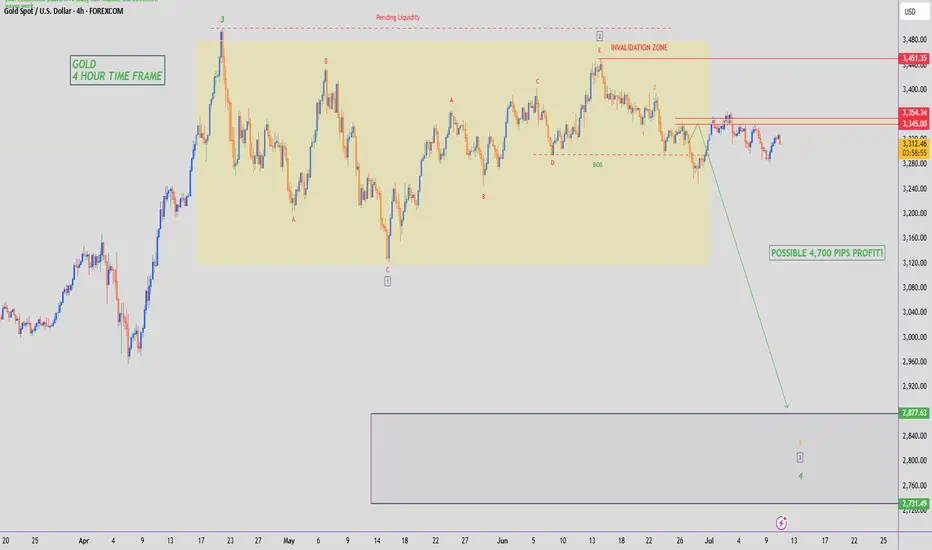
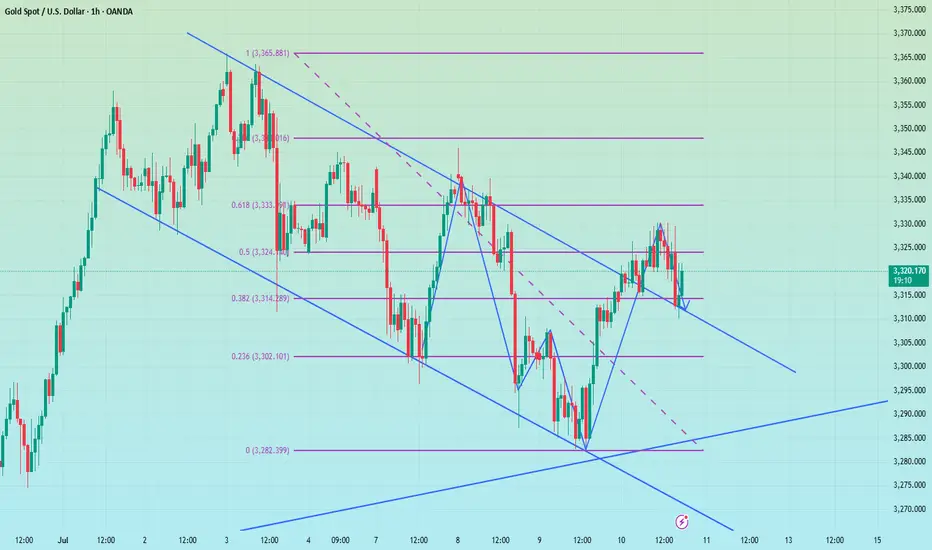
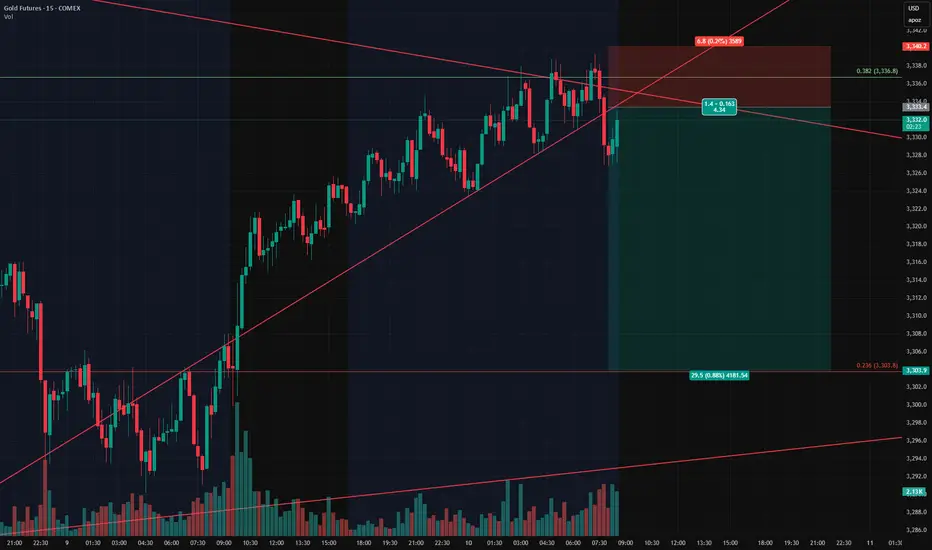
Gold Trade Setup – Long Invalidated, Watching Retest for ShortGold has been consolidating between $3,200 and $3,500, recently pressing against a descending resistance line that has rejected price several times. I was favoring the upside, but our long setup was invalidated — the stop loss at $3,330 was hit.
Price is now retesting ascending support, and I'm shifting focus to a short opportunity, using our previous long entry level (~$3,333) as a key area of interest for entries.
Here’s the updated plan:
Short Entry: Around $3,333
Stop Loss: $3,340
Take Profit: $3,303
Remaining cautious but opportunistic — the larger structure is vulnerable and could break further if support fails.
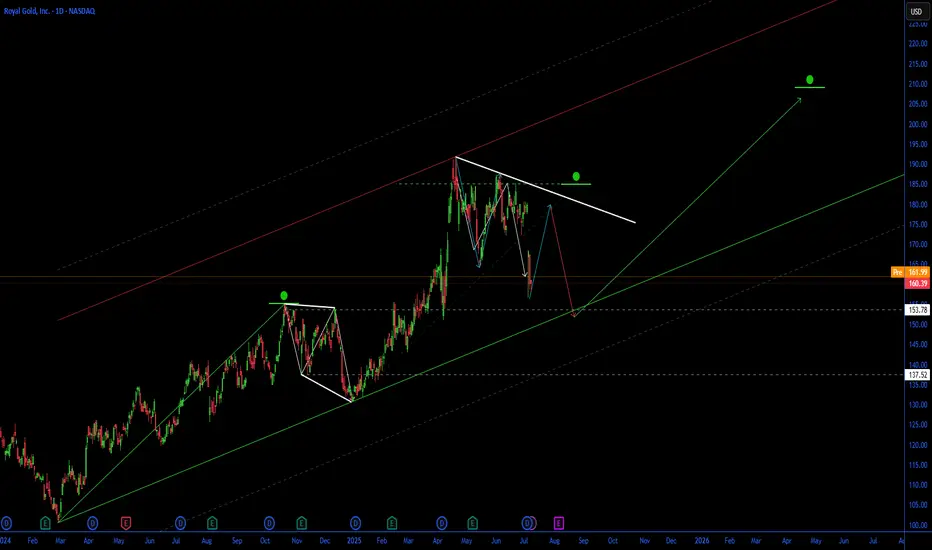
Royal Gold (RGLD) Poised for Growth with $3.5B Sandstorm Acq.🚀 **Royal Gold (RGLD) Poised for Growth with $3.5B Sandstorm Acquisition!** 🥇
Royal Gold ( NASDAQ:RGLD ) is making waves with its $3.5B all-stock acquisition of Sandstorm Gold ( NYSE:SAND ) and a $196M cash buyout of Horizon Copper, announced July 7, 2025. Here’s why this could be a game-changer for investors! 📈
**🔥 Financial Highlights:**
- **Q2 2025 Performance**: Sold 40,600 GEOs at $3,248/oz gold, $32.91/oz silver, with an impressive 87% gross margin. $11.1B market cap reflects strength. 💰
- **Acquisition Impact**: Sandstorm deal adds 40 producing assets, boosting 2025 GEO production by 26%. Expect revenue & earnings growth post-Q4 2025 close. 🚀
- **Dividend Confidence**: Declared $0.45/share Q3 dividend, signaling robust cash flows. 💸
**📊 Sector Edge & Valuation**:
- **Undervalued?** Compared to Wheaton ($56B) & Franco-Nevada ($44B), Royal Gold’s lower valuation (per RBC Capital) could signal a bargain. Post-deal scale (75% gold revenue) may close the gap. 📉
- **Performance**: Sandstorm’s record Q1 2025 results + Royal Gold’s aggressive expansion outpace peers in growth potential. 🚀
**⚠️ Risks to Watch**:
- 6%–8.5% stock dip post-announcement reflects dilution fears (~19M new shares). 📉
- Commodity price volatility & regulatory approvals (due Q4 2025) pose risks. ⚖️
**🎯 SWOT Snapshot**:
- **Strengths**: Enhanced portfolio, 87% margins, leading North American royalty player.
- **Opportunities**: Analyst optimism (BMO $197 target) & copper exposure via Horizon.
- **Weaknesses**: Short-term dilution concerns.
- **Threats**: Commodity price swings, peer competition.
**💡 Why Buy Now?**
Royal Gold’s stock dip could be a buying opportunity, with analysts like BMO ($197 target) and unusual options activity signaling confidence. If precious metals stay hot ($3,342.80/oz gold futures), RGLD’s diversified portfolio could shine! 🌟
📅 **Deal Close**: Q4 2025, pending approvals.
🔎 **Dive Deeper**: Check Royal Gold’s IR page or Yahoo Finance for details.
What’s your take on NASDAQ:RGLD ’s big move? Bullish or cautious? 🐂🐻 #StockMarket #Gold #Investing
Gold: Market analysis and strategy for July 10.Gold technical analysis
Daily chart resistance level 3345, support level 3245
Four-hour chart resistance level 3340, support level 3285
One-hour chart resistance level 3330, support level 3310.
Yesterday, gold bottomed out and rebounded, standing above 3310, breaking the previous downward rhythm. The breakthrough of the previous opening means that gold is likely to continue to rise. The current market is bullish above 3310. You can buy around 3310. The upper resistance is 3340/45 area. The gold price runs in this area. If the top signal appears at a small level, you can sell.
In terms of intraday operations, it is recommended to sell in the 3340-45 range after rising, and buy when it falls back to 3310. It runs in a narrow range and can be scalped.
SELL: 3343 near
BUY: 3310near
GOLD: Local Bullish Bias! Long!
My dear friends,
Today we will analyse GOLD together☺️
The market is at an inflection zone and price has now reached an area around 3,324.79 where previous reversals or breakouts have occurred.And a price reaction that we are seeing on multiple timeframes here could signal the next move up so we can enter on confirmation, and target the next key level of 3,330.13.Stop-loss is recommended beyond the inflection zone.
❤️Sending you lots of Love and Hugs❤️

Gold - Sell before longer term buyLooking at gold we are a matter of a few pips away from entry. looking to play gold down till our larger 4H area of demand seeing as we have had a CHoCH to the upside.
There for i will be looking to take my sell position down to 3283.5 at a bare minimum as it was the previous structure level in which we turned around.
Lets see if we get tagged in. If not i will jump down to the lower TF and see if we can get a confirmation that price is going to turn from here.
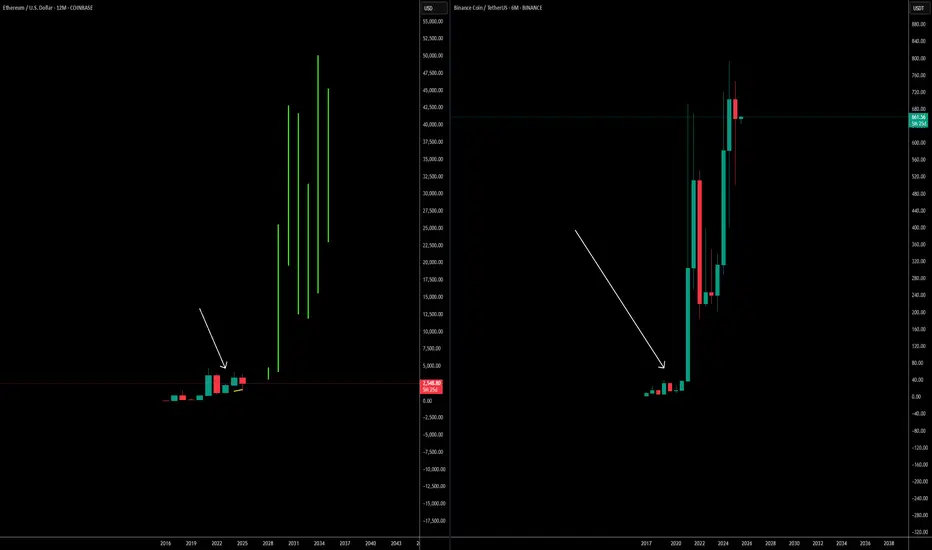
Why Ethereum’s Will 10×🚀 Ethereum’s Next 10×: Why bank-grade adoption + the stable-coin avalanche make a moonshot look conservative
Big banks are building on-chain right now. JPMorgan & Bank of America began 2025 pilots for dollar-backed tokens that settle on Ethereum, while Societe Generale just unveiled its USD CoinVertible stable-coin on main-net.
Stable-coins already move more money than Visa + Mastercard combined. $27.6 trillion flowed through stable-coins in 2024—most of it routed over Ethereum block-space.
Ethereum clears four-fifths of that stable-coin volume. More than 80 % of all stable-coin transactions occur on ETH or its L2s, locking in network effects that rivals can’t match.
ETF wall-of-money is already hitting the gate. 2025 Ethereum ETFs posted a record $743 million month of inflows—the strongest vote of institutional confidence to date.
ETH supply keeps shrinking while demand spikes. Post-Merge burn has removed roughly 332 k ETH, flipping issuance negative; base-line inflation is now < –1.3 %/yr.
30 million ETH is locked in staking, slicing liquid float by 25 %. The yield engine tightens supply just as banks and ETFs need inventory.
Real-world assets are going token-native. Tokenized bond issuance jumped 260 % in 2024 to €3 billion, and virtually every pilot settles on ERC-standards.
Layer-2 roll-ups slashed average gas fees to <$4. Cheaper block-space makes day-to-day payments viable, driving still more stable-coin throughput (and fee burn).
User base is exploding toward mass scale. Active ETH wallets hit 127 million—up 22 % YoY—showing that retail, devs, and institutions are onboarding together.
Energy-efficient PoS removes the last ESG roadblock. With > 99 % less energy use than PoW chains, Ethereum checks the sustainability box that banks and asset managers need for wide-open deployment.
Bottom line: when TradFi giants plug directly into Ethereum rails and stable-coins dwarf legacy payment rails, every transfer torches a little more supply. Add the ETF flywheel and a vanishing float, and a 10× move shifts from “moon-boy” to math.
OTHER EXAMPLES
TSLA
tradingview.sweetlogin.com
Total 2
tradingview.sweetlogin.com
MartyBoots here—trading for 17 years, and I would like to hear YOUR take!
👉 Can Ethereum really 10× from here? Drop your best argument below, hit the 👍 if you learned something, and smash that Follow to stay in the loop on every crypto deep-dive I post.
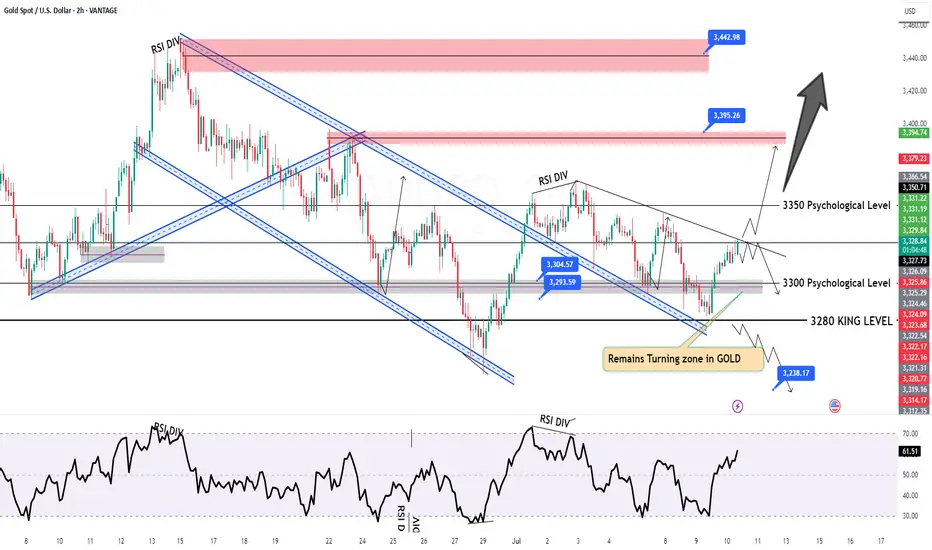
GOLD Intraday Chart Update For 10 July 25Hello Traders,
as you can see that GOLD is stuck in tight range between 3300-3330 all eyes on clear breakout for now
further only market will break clearly 3345 level then we will consider market will move further advance below 3300 GOLD will move towards 3250
Scalping Range 3300 - 3330 for the short time period
Disclaimer: Forex is Risky
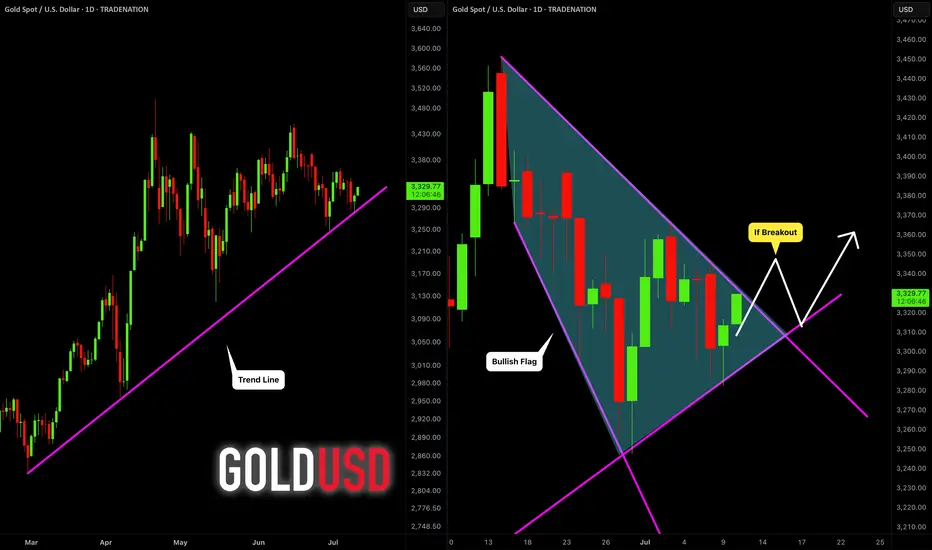
GOLD (XAUUSD): Important Decision Ahead
As I predicted, Gold went up from a trend line yesterday.
The price is now testing another trend line - a falling resistance
of a bullish flag pattern.
The next reliable bullish signal that you can look for is its
bullish breakout and a daily candle close above that.
A bullish move is going to follow then.
❤️Please, support my work with like, thank you!❤️
I am part of Trade Nation's Influencer program and receive a monthly fee for using their TradingView charts in my analysis.
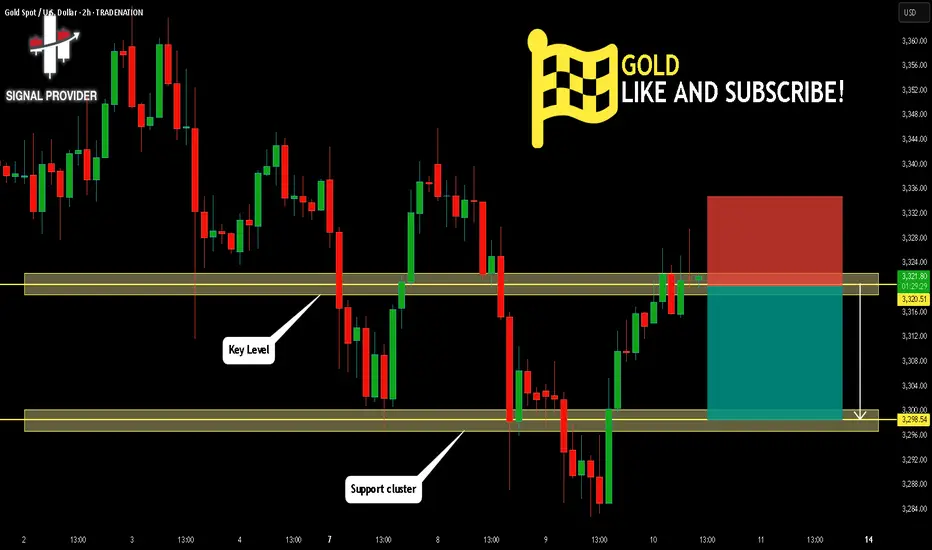
GOLD Is Very Bearish! Short!
Here is our detailed technical review for GOLD.
Time Frame: 2h
Current Trend: Bearish
Sentiment: Overbought (based on 7-period RSI)
Forecast: Bearish
The market is approaching a significant resistance area 3,320.51.
Due to the fact that we see a positive bearish reaction from the underlined area, I strongly believe that sellers will manage to push the price all the way down to 3,298.54 level.
P.S
Please, note that an oversold/overbought condition can last for a long time, and therefore being oversold/overbought doesn't mean a price rally will come soon, or at all.
Disclosure: I am part of Trade Nation's Influencer program and receive a monthly fee for using their TradingView charts in my analysis.
Like and subscribe and comment my ideas if you enjoy them!
Gold H4 | Rising into a swing-high resistanceGold (XAU/USD) is rising towards a swing-high resistance and could potentially reverse off this level to drop lower.
Sell entry is at 3,336.84 which is a swing-high resistance.
Stop loss is at 3,370.00 which is a level that sits above the 127.2% Fibonacci extension and a swing-high resistance.
Take profit is at 3,289.33 which is a swing-low support.
High Risk Investment Warning
Trading Forex/CFDs on margin carries a high level of risk and may not be suitable for all investors. Leverage can work against you.
Stratos Markets Limited (tradu.com ):
CFDs are complex instruments and come with a high risk of losing money rapidly due to leverage. 63% of retail investor accounts lose money when trading CFDs with this provider. You should consider whether you understand how CFDs work and whether you can afford to take the high risk of losing your money.
Stratos Europe Ltd (tradu.com ):
CFDs are complex instruments and come with a high risk of losing money rapidly due to leverage. 63% of retail investor accounts lose money when trading CFDs with this provider. You should consider whether you understand how CFDs work and whether you can afford to take the high risk of losing your money.
Stratos Global LLC (tradu.com ):
Losses can exceed deposits.
Please be advised that the information presented on TradingView is provided to Tradu (‘Company’, ‘we’) by a third-party provider (‘TFA Global Pte Ltd’). Please be reminded that you are solely responsible for the trading decisions on your account. There is a very high degree of risk involved in trading. Any information and/or content is intended entirely for research, educational and informational purposes only and does not constitute investment or consultation advice or investment strategy. The information is not tailored to the investment needs of any specific person and therefore does not involve a consideration of any of the investment objectives, financial situation or needs of any viewer that may receive it. Kindly also note that past performance is not a reliable indicator of future results. Actual results may differ materially from those anticipated in forward-looking or past performance statements. We assume no liability as to the accuracy or completeness of any of the information and/or content provided herein and the Company cannot be held responsible for any omission, mistake nor for any loss or damage including without limitation to any loss of profit which may arise from reliance on any information supplied by TFA Global Pte Ltd.
The speaker(s) is neither an employee, agent nor representative of Tradu and is therefore acting independently. The opinions given are their own, constitute general market commentary, and do not constitute the opinion or advice of Tradu or any form of personal or investment advice. Tradu neither endorses nor guarantees offerings of third-party speakers, nor is Tradu responsible for the content, veracity or opinions of third-party speakers, presenters or participants.
