renderwithme ||| XAU/USD Monthly Analysis (August 2025 Outlook) #Fundamental Analysis
Gold prices are influenced by macroeconomic factors, monetary policy, and geopolitical events. Based on recent data:Federal Reserve Policy: The Fed’s decision to maintain interest rates at 4.25–4.50% in July 2025, with a hawkish tilt, has strengthened the US dollar, putting downward pressure on gold. A stronger USD typically reduces gold’s appeal as it’s priced in dollars. However, expectations of a potential rate cut in September could support gold if signaled by Fed Chair Jerome Powell. Watch for updates in the FOMC statement or Powell’s comments for clues on future policy.
#Economic Indicators:
Strong US economic data, such as a robust labor market (jobless claims at a 3-month low) and rising consumer confidence (Conference Board’s Index at 97.2 in July), suggest increased economic activity, which could bolster the USD and limit gold’s upside. Upcoming data like the US PCE Price Index and Nonfarm Payrolls (NFP) in early August will be critical for gauging inflation and labor market trends, impacting gold’s trajectory.
Geopolitical and Safe-Haven Demand: Reduced safe-haven demand due to de-escalating global trade tensions and geopolitical stability has capped gold’s gains. However, any escalation in conflicts (e.g., Russia-Ukraine or Middle East) or renewed trade disputes could drive demand for gold as a safe-haven asset.
Central Bank Demand: Continued central bank gold purchases could provide long-term support, but a slowdown in buying might weigh on prices.
# Inflation and Currency Dynamics:
Persistent US inflation supports the USD, limiting gold’s attractiveness. Conversely, a recovering Chinese economy or global policy easing could boost gold demand.
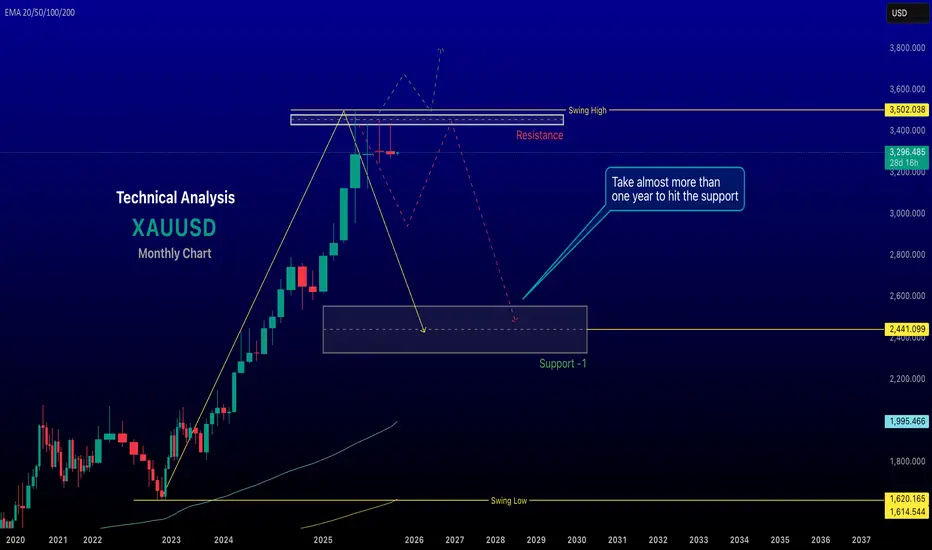
#Technical Analysis
Recent technical data suggests a mixed outlook for XAU/USD on the monthly timeframe:Price Levels and Trends: As of late July 2025, XAU/USD is trading around $3,291–$3,337, consolidating after retreating from a high of $3,440. The monthly chart shows a medium-term uptrend channel that began in early 2025, with support around $3,285–$3,300 and resistance at $3,355–$3,430. A decisive break above $3,355 could signal bullish momentum toward $3,500 or higher, while a break below $3,285 might target $3,130 or lower.
Indicators: The 14-day RSI at 46.10 suggests neutral momentum, neither overbought nor oversold. Technical indicators show mixed signals, with 15 bearish and 11 bullish signals as of July 28, 2025, reinforcing a cautious outlook.
Key Levels: Support: $3,275–$3,225 (major demand zone), $3,130 (potential deeper pullback).
Resistance: $3,355, $3,430, $3,500 (psychological level).
A bearish descending channel on shorter timeframes (e.g., 1H, 3H) suggests potential downside unless $3,320 is breached.
Monthly ForecastBearish Scenario: If the USD remains strong due to hawkish Fed signals, persistent inflation, or robust US economic data, XAU/USD could test support at $3,275–$3,225. A break below this zone might lead to $3,130 or even $2,900 in a deeper correction, especially if safe-haven demand weakens further.
Bullish Scenario: A Fed signal of rate cuts, renewed geopolitical tensions, or increased central bank buying could push gold above $3,355, targeting $3,430 or $3,500. A breakout above $3,430 could aim for $3,830, as suggested by some analysts.
Expected Range: For August 2025, XAU/USD is likely to trade between $3,225 and $3,430, with volatility driven by US economic data and Fed policy updates. A monthly close above $3,430 would strengthen the bullish case, while a close below $3,225 would favor bears.
Trading ConsiderationsRisk Management: Given the mixed signals, use tight stop-losses. For bullish trades, consider entries near $3,275–$3,300 with stops below $3,225. For bearish trades, enter near $3,320 with stops above $3,355.
Key Events to Watch: Monitor the US PCE Price Index, NFP report, and Fed statements in early August for directional cues. Geopolitical developments could also trigger sudden moves.
Volatility: The 30-day volatility is low at 0.91%, suggesting consolidation, but upcoming data releases could spark sharper moves.
# Chart for the reference will give u better idea to take decisions
in my views top has been made
~~ Disclaimer ~~
This analysis is based on recent technical data and market sentiment from web sources. It is for informational \ educational purposes only and not financial advice. Trading involves high risks, and past performance does not guarantee future results. Always conduct your own research or consult a SEBI-registered advisor before trading.
# Boost and comment will be highly appreciated.
Gold
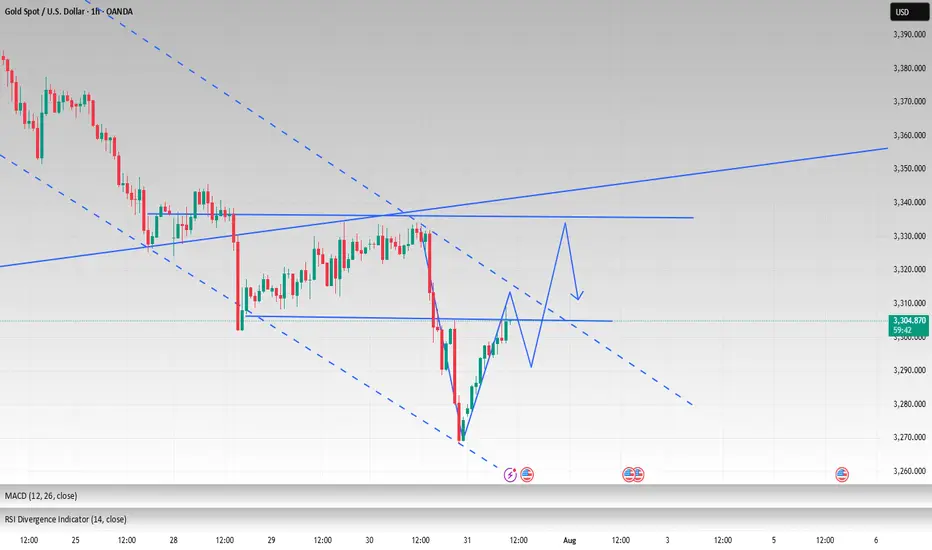
Will gold bottom out and rebound on July 31st?
1. Key News Drivers
Federal Reserve Policy Expectations: The market generally expects the Fed to maintain a hawkish stance. If economic data (such as ADP, GDP, and PCE) show strong performance, the expected rate cut may be further postponed, which is bearish for gold.
Geopolitics and Risk Aversion: Uncertainty in the US-China trade negotiations and the situation in the Middle East may temporarily support gold prices, but the market is currently more focused on macroeconomic data.
Dollar Trend: If the US dollar index continues to strengthen (driven by expectations of a Fed rate hike), it will suppress gold's rebound potential.
2. Key Technical Signals
Trend Break Confirmation:
The daily chart shows four consecutive declines below the 60-day moving average and the rising trend line, confirming a mid-term correction following the 3439 high.
The next key support is 3245 (previous low). If it falls below this, the price could drop to 3150-3120.
Short-term oversold rebound demand:
The RSI entered the oversold zone, and a technical rebound may occur.
Key rebound resistance level:
3315-3325 (near yesterday's high, short-term short position entry area)
3345-3350 (bull-bear watershed, strong resistance area)
3380-3400 (trend reversal confirmation point, ideal layout position for medium-term short positions)
3. Today's operation strategy
(1) Short-term trading (intraday)
Mainly high-short:
Rebound to 3315-3325, light position short test, stop loss 3335, target 3280-3270.
If it touches 3345-3350, you can add short positions, stop loss 3360, target 3300-3280.
Dip-buying strategy (caution):
If the price stabilizes after a pullback to 3280-3270, short-term buying is recommended, with a stop-loss at 3260 and a target of 3300-3310 (quick entry and exit).
4. Key Risks
Federal Reserve Policy Shift: If the Fed unexpectedly releases dovish signals (such as hinting at a rate cut), it could trigger a rapid rebound in gold prices.
Unfortunate Economic Data: If US GDP, PCE, and other data fall short of expectations, it could boost gold prices in the short term, but after the rebound, it will still be an opportunity to buy higher.
Escalating Geopolitical Conflict: If a major risk event occurs (such as a escalation in the Sino-US trade war), it could temporarily boost safe-haven buying.
Summary
Short-Term: Oversold rebounds may provide opportunities to sell high, with attention to resistance at 3315-3325 and 3345-3350.
Medium-Term: The trend remains bearish, with a target of 3245 to 3150. Any upward movement is considered an opportunity to enter a short position. Trading strategy: Mainly short on rebound, be cautious when buying long orders on rebound, and strictly set stop-loss to prevent unexpected fluctuations.

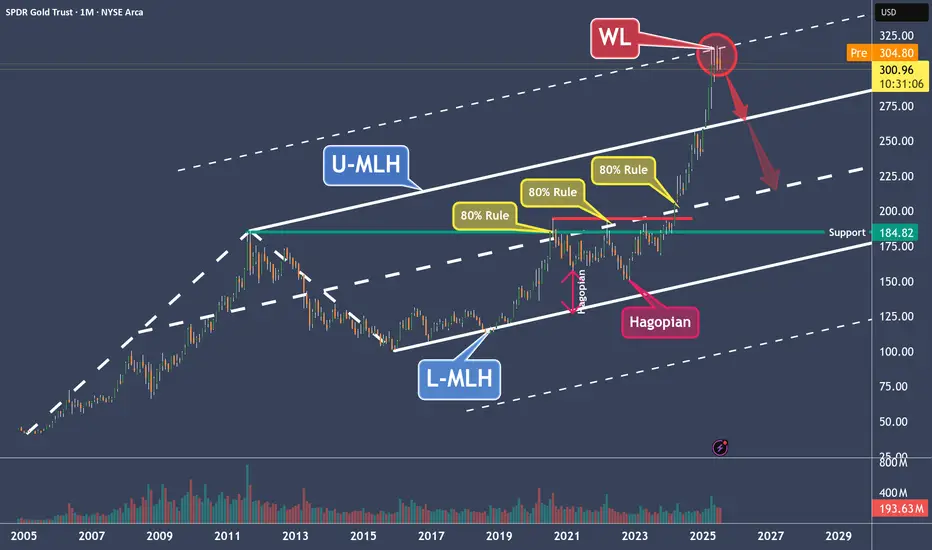
GLD – Why Gold Is a Clear Short to MePrice moved from the Lower Median Line (L-MLH) up to the Centerline, fulfilling the 80% rule.
Then we had two Hagopians, which sent price right back to the Centerline.
After the breakout above the Centerline, the next target was the Upper Median Line Parallel (U-MLH), which was reached rather quickly.
Finally, price broke above the U-MLH and was pulled up toward the Warning Line (WL).
Is this the end of the happy story?
I think so—because Gold has now reached its 2nd standard deviation, and there’s probably no more gas left in the tank.
The Trade:
- A logical target is the U-MLH.
- A secondary target is the Centerline.
At the very least, if you're long, this might be a good time to take some profits—because no tree grows to the moon.
For further details, I will follow-up with a Video explanation - See my Signature.
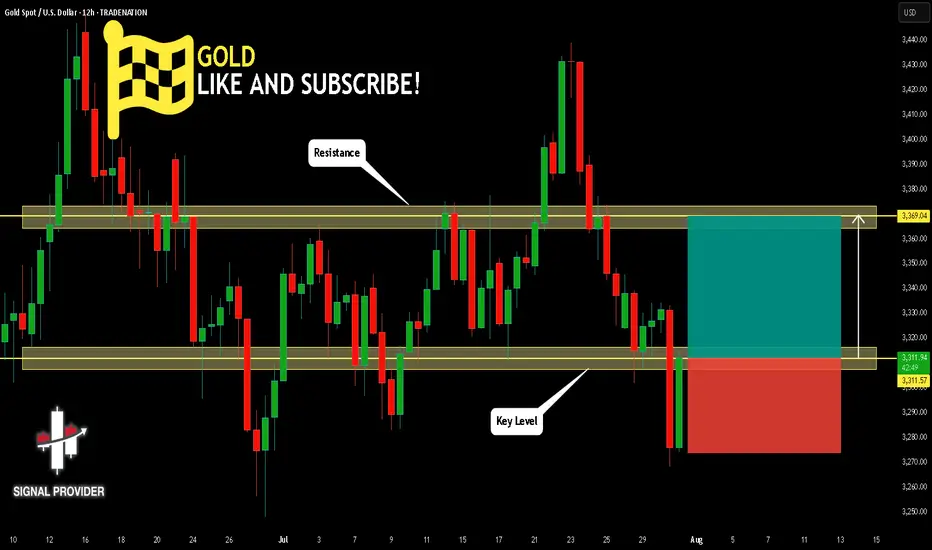
GOLD Will Go Higher From Support! Buy!
Here is our detailed technical review for GOLD.
Time Frame: 12h
Current Trend: Bullish
Sentiment: Oversold (based on 7-period RSI)
Forecast: Bullish
The market is testing a major horizontal structure 3,311.57.
Taking into consideration the structure & trend analysis, I believe that the market will reach 3,369.04 level soon.
P.S
The term oversold refers to a condition where an asset has traded lower in price and has the potential for a price bounce.
Overbought refers to market scenarios where the instrument is traded considerably higher than its fair value. Overvaluation is caused by market sentiments when there is positive news.
Disclosure: I am part of Trade Nation's Influencer program and receive a monthly fee for using their TradingView charts in my analysis.
Like and subscribe and comment my ideas if you enjoy them!
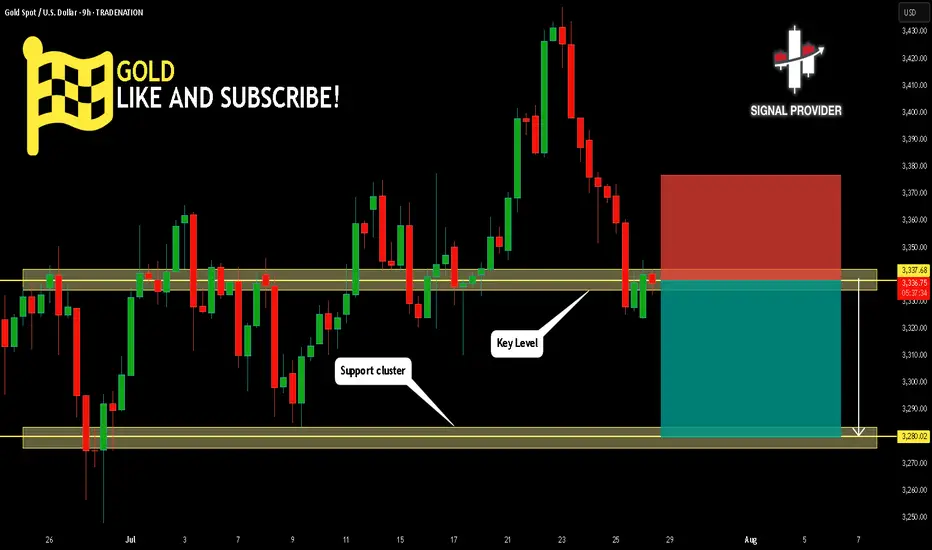
GOLD Will Move Lower! Sell!
Here is our detailed technical review for GOLD.
Time Frame: 9h
Current Trend: Bearish
Sentiment: Overbought (based on 7-period RSI)
Forecast: Bearish
The market is testing a major horizontal structure 3,337.68.
Taking into consideration the structure & trend analysis, I believe that the market will reach 3,280.02 level soon.
P.S
The term oversold refers to a condition where an asset has traded lower in price and has the potential for a price bounce.
Overbought refers to market scenarios where the instrument is traded considerably higher than its fair value. Overvaluation is caused by market sentiments when there is positive news.
Disclosure: I am part of Trade Nation's Influencer program and receive a monthly fee for using their TradingView charts in my analysis.
Like and subscribe and comment my ideas if you enjoy them!
DeGRAM | GOLD reached the $3300 level📊 Technical Analysis
● XAUUSD remains capped below a broken trendline retest near 3,355, while price forms a lower-high inside a descending channel.
● The repeated rejection of the 3,357.83 resistance level, coupled with failed bullish continuation, points to renewed downside toward 3,300 and 3,262.
💡 Fundamental Analysis
● A rebound in the DXY after strong US consumer sentiment and pending home sales adds pressure to gold, reaffirming real-yield strength.
● Traders are reducing long exposure ahead of upcoming NFP data and Powell’s next statement, shifting bias away from risk hedges.
✨ Summary
Short bias below 3,355. Break under 3,320 eyes 3,300 → 3,262. Key breakdown risk if lower trendline fails.
-------------------
Share your opinion in the comments and support the idea with a like. Thanks for your support!

Short selling remains the main themeGold hit a low of around 3267 yesterday and fluctuated until closing at 3274. Gold fluctuated upward at the opening today. Currently, gold is fluctuating around yesterday's rebound point of 3305. This is the resistance we need to pay attention to in the short term.
From the 4H analysis, today's short-term resistance is around 3305-3315. If gold wants to rise, it needs to stabilize above 3315. Focus on the 3335 first-line pressure, and rebound to the 3305-3315 resistance area during the day. You can consider shorting and follow the trend to see the decline unchanged, looking towards 3290-3280. Rely on this range to maintain the main tone of high-altitude participation. For the middle position, watch more and do less, be cautious in chasing orders, and wait patiently for key points to enter the market.
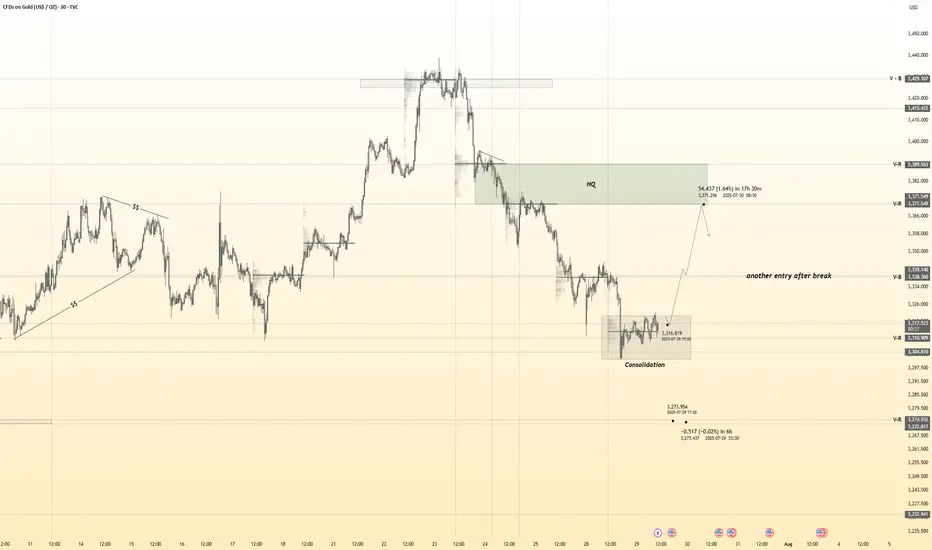
Gold 30Min Engaged ( Bullish Reversal Entry Detected )Time Frame: 30-Minute Warfare
Entry Protocol: Only after volume-verified breakout
🩸Bullish Reversal - 3318
➗ Hanzo Protocol: Volume-Tiered Entry Authority
➕ Zone Activated: Dynamic market pressure detected.
The level isn’t just price — it’s a memory of where they moved size.
Volume is rising beneath the surface — not noise, but preparation.
🔥 Tactical Note:
We wait for the energy signature — when volume betrays intention.
The trap gets set. The weak follow. We execute.
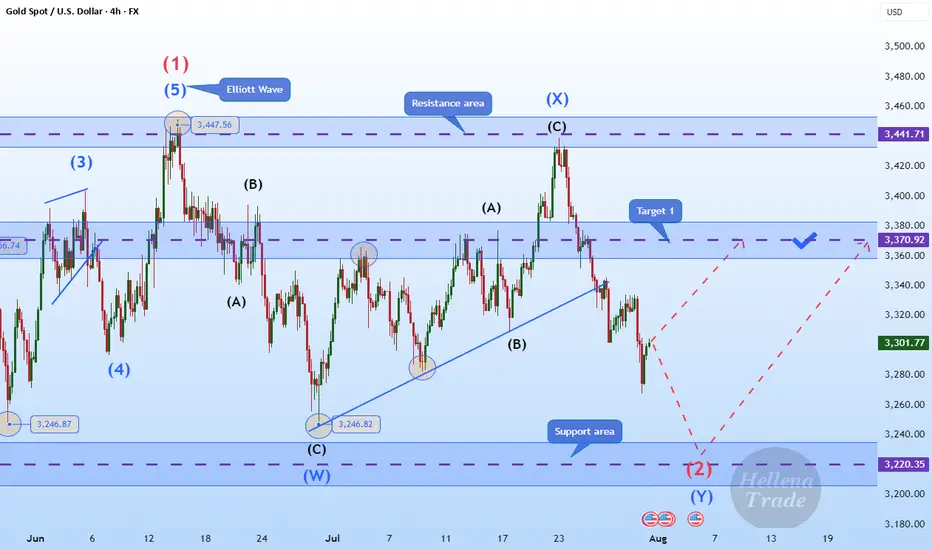
Hellena | GOLD (4H): LONG to area of 3370 (Wave 2).Colleagues, gold is once again disrupting our plans, and I have to revise the wave marking. It's not easy, but the most important thing is to keep doing it.
Now I'm back to the previous marking — the price is in wave “2” correction.
To complete this wave, the price needs to overcome the level of wave “W” of the middle order 3246.82. Then the correction will be completed and wave “3” will begin an upward movement.
I see the minimum target in the area of the 3370 level.
Manage your capital correctly and competently! Only enter trades based on reliable patterns!
Gold is Falling Sharply – Will It Keep Falling?Hello dear traders, what’s your view on XAUUSD?
Yesterday, XAUUSD continued its strong downtrend and is now trading around 3,296 USD.
The recent drop in gold is largely due to the strengthening U.S. dollar, following the Federal Reserve’s decision to hold interest rates steady as expected — despite sharp criticism from President Donald Trump.
Technically speaking, after breaking below the rising trendline, gold failed to retest successfully and plunged further, confirming that the bearish trend is now in control. Price is currently moving below key moving averages, and the structure has clearly formed a sequence of lower highs and lower lows — reinforcing the likelihood of continued downside.
If a pullback occurs before the next leg down, the Fibonacci 0.5 and 0.618 retracement zone — which aligns with the EMA 34 and 89 and a major resistance level — will be a key area to watch. This could present a prime opportunity for breakout and trend-following traders.
Looking ahead, the next key support sits near 3,220 USD. If this level breaks, gold may head toward the 3,162 USD zone.
What do you think? Will gold keep falling, or will buyers step in? Drop a comment and hit follow to catch the next big move!

Gold price continues sharp declineHello everyone! Do you think gold will rise or fall? Let’s dive into the latest movements of this precious metal.
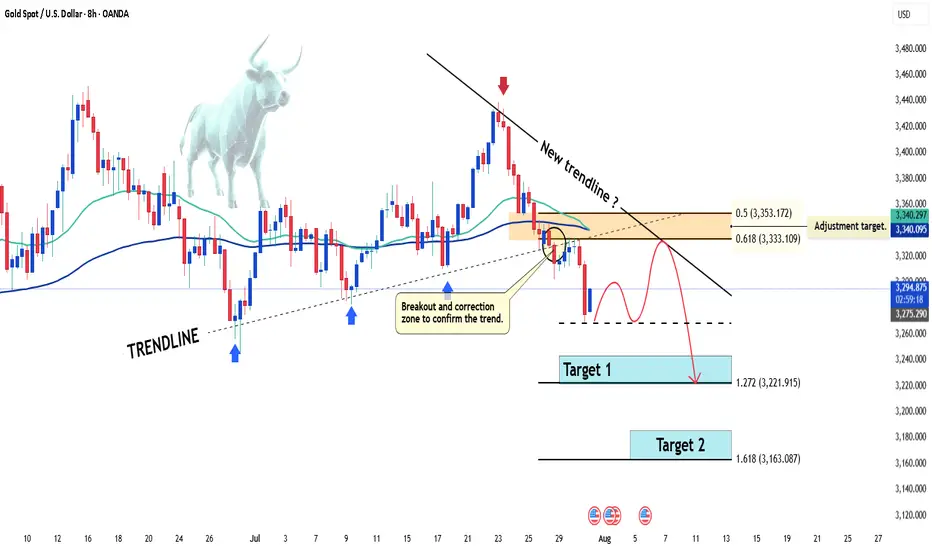
Just as we anticipated in yesterday’s strategy , gold has extended its downward move, with the bears firmly in control. The precious metal is currently trading around 3,290 USD, clearly signaling a short-term downtrend after breaking the ascending trendline that started in early July. Although there was a slight bounce, price remains capped below the key resistance zone of 3,333 – 3,350 USD, which coincides with the confluence of the 0.618 – 0.5 Fibonacci retracement and the EMA 34/89 — adding even more downside pressure.
The main reason behind this recent drop lies in the easing of trade tensions following the US-EU tariff agreement, which has significantly weakened gold’s safe-haven appeal. At the same time, the FOMC meeting yesterday failed to provide any bullish catalyst for gold. Even though the Fed is expected to keep rates unchanged, a single hawkish remark from Chair Powell was enough to intensify short-term selling pressure.
From a technical perspective, gold attempted to retest the broken trendline but failed, confirming the bearish structure. A new wave of correction could emerge soon, but the overall outlook remains tilted toward further downside.
My personal view:
Target 1 is at the 1.272 Fibonacci extension.
Target 2 lies at the 1.618 Fibonacci level — which could be the next destination.
And you — what do you think about this trendline break? Let’s discuss in the comments!
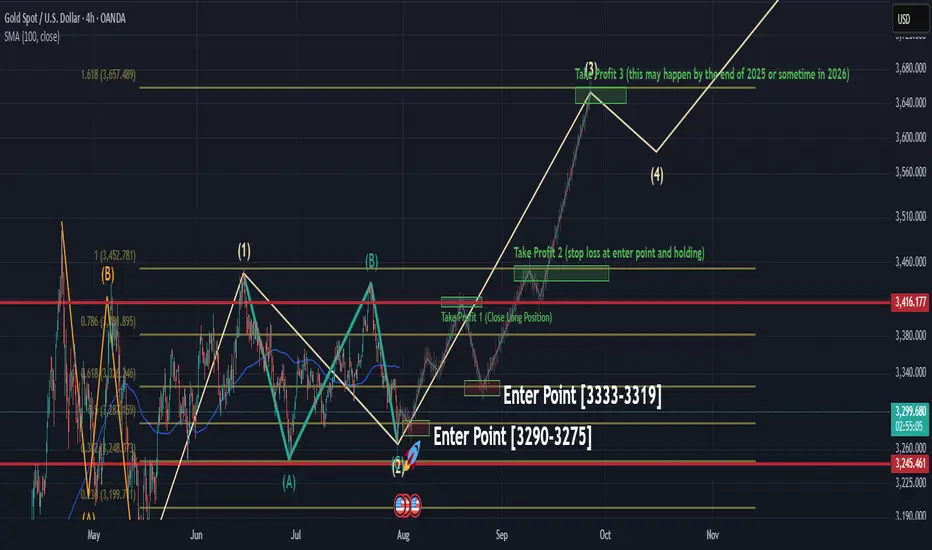
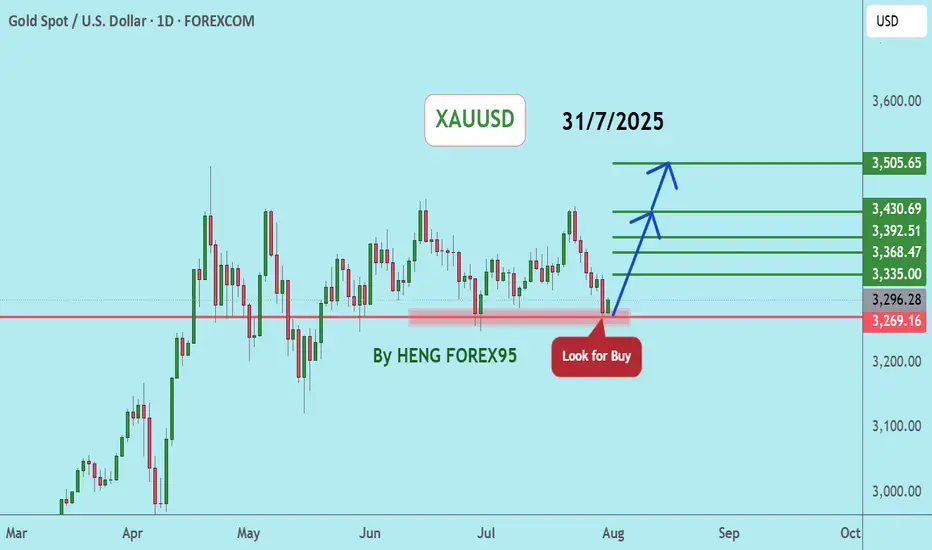
Roadmap to 3982: Key Long Entries and Profit ZonesThe initial long entry zone is between 3290 and 3275 .
From this range, an uptrend is expected to begin, targeting 3416 , which is our first exit point to close the initial long position.
After that, we wait for the next long entry , ideally around 3333 to 3319 . A new upward movement from this range is expected to reach 3455 . At this level, we continue to hold the position while placing the stop loss at the entry level to protect profits.
The next take profit target is 3650 , which may be reached by the end of 2025 or in 2026.
The final target is 3982 , which is likely to be hit in 2026, as the market may not have enough strength to reach it in 2025.
Gold Faces Strong Rejection Below $3,365 – Bearish Wave Ahead?Gold is currently trading around $3,359, showing signs of exhaustion after climbing from the $3,248 low. The chart illustrates a textbook scenario of channel rejection after testing the upper boundary of the descending wedge and failing to break above the $3,365–$3,392 resistance zone. Price is now hovering just below the diagonal black trendline, indicating a potential lower high formation and setting up for another bearish wave.
📌 Key Technical Highlights
Resistance Zone: $3,365–$3,392
This area marks the confluence of the black long-term trendline, the top of the descending purple channel, and the previous high at $3,392.
Price attempted a "Possible Retest" as annotated on the chart and is now starting to pull back—showing signs of bearish rejection.
Bearish Scenario (Blue Arrows):
Multiple downward arrows show likely bearish paths if the current resistance holds.
Key short-term targets:
$3,337, $3,320, $3,303, Strong support at $3,293–$3,248
Further downside may test extension levels toward $3,220–$3,200 by early August if momentum builds.
⚠️ Bearish Confirmation Criteria
Failure to close above $3,365 (black trendline)
Breakdown below $3,337 followed by $3,320
Strong selling pressure supported by fundamentals (e.g. USD strength, Fed hawkish stance)
✅ Invalidation / Bullish Outlook
A decisive breakout and close above $3,392.73 would invalidate the bearish structure.
In that case, targets would shift toward:
$3,412, $3,434, $3,490 (long-term trendline intersection)
However, today's U.S. CPI (Consumer Price Index) release adds a layer of volatility and potential trend disruption, making this a high-risk trading day.
📊 CPI News Impact – What to Watch
High CPI (Stronger than forecast):
- Increases expectations of further Fed tightening → strengthens USD → bearish for gold
- Likely scenario: sharp drop toward $3,337 → $3,320 → $3,293
Low CPI (Weaker than forecast):
- Signals disinflation → weakens USD → bullish for gold
- Possible breakout above $3,365 → retest of $3,392 → if broken, target $3,412 and $3,434
Neutral or as expected CPI:
- Likely leads to whipsaw — fakeout on both sides
- Caution advised — wait for candle close confirmations post-news
Note
Please risk management in trading is a Key so use your money accordingly. If you like the idea then please like and boost. Thank you and Good Luck!

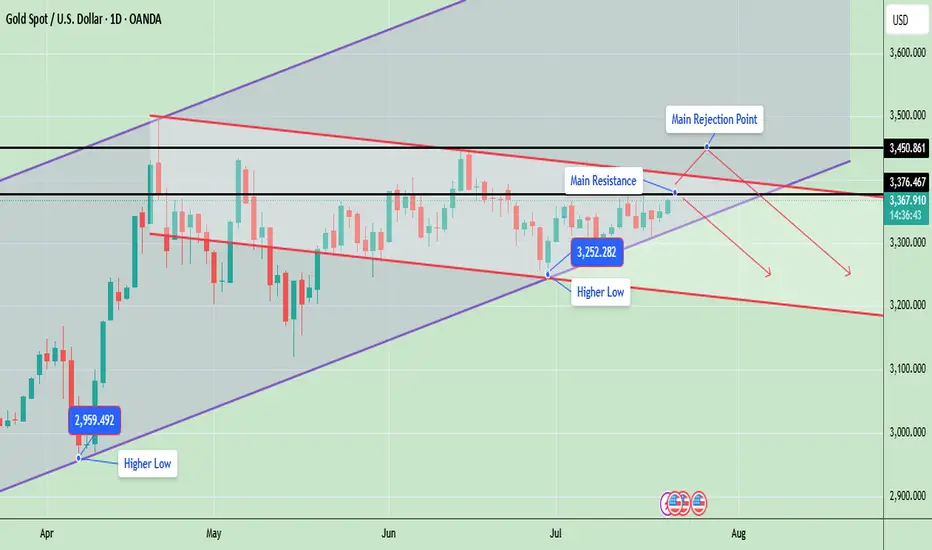
Gold Price Update – Testing Key ResistanceGold is currently trading around 3367, showing strong bullish momentum as it continues to form higher lows, which indicates an ongoing uptrend. The market structure is developing inside a rising wedge pattern, with the price consistently respecting both the ascending support and resistance lines.
Gold is now testing a key resistance zone between 3376 and 3450, an area that previously acted as a major supply zone and caused sharp rejections. A successful breakout and close above 3450 will likely confirm a bullish continuation and may open the door for a rally toward 3500 and possibly 3580. However, if gold fails to break this level, it could retrace back to the 3300 or 3250 support zones, especially if a rejection candle forms in the daily timeframe.
📊 Key Technical Highlights:
- Price has approached the upper resistance boundary of the wedge.
- Daily candle is bullish, indicating strong buying momentum.
- However, unless price closes above 3,376–3,450, there’s still a risk of rejection from the top channel and a pullback toward 3,300–3,250.
🔑 Key levels to watch:
- Gold is currently trading around $3,367, just below a crucial horizontal resistance at $3,376
- A strong breakout above $3,376, and especially above $3,450, could open the door for further bullish movement toward the $3,500–$3,600 range, following the upper trendline of the ascending channel.
- On the downside, if price fails to hold the higher low at $3,252, a drop toward $3,200 or even $3,100 is possible aligning with the downward red trendline.
- The structure remains bullish overall, as price is still making higher lows and staying within the rising channel
📊 Weekly Gold Chart Analysis
Gold is currently trading around $3,368, forming a symmetrical triangle pattern on the weekly timeframe. This pattern typically indicates a period of consolidation before a potential breakout in either direction. The price is getting squeezed between lower highs and higher lows, which is a sign of decreasing volatility and approaching breakout.
🔑 Key Technical Insights:
- ✅ Current Structure: Price has been consolidating within a triangle since April 2025 after a strong upward move. It is now near the apex of the triangle, suggesting a breakout is imminent—most likely in the next 1–2 weeks.
🔼 Bullish Breakout:
- If gold breaks above the triangle resistance (~$3,385–$3,393), it could trigger a sharp rally.
- Upside targets post-breakout: $3,450, $3,500, $3,600+ (if momentum continues)
🔽 Bearish Breakdown:
- A break below the triangle support (~$3,335–$3,325) may lead to a deeper correction.
- Downside targets post-breakdown: $3,285, $3,200
- Possibly $3,100–$3,050 if bearish sentiment intensifies
📉 Volume Drop:
As typical with triangles, volume has likely decreased, signaling indecision. Once volume returns, it will likely confirm the breakout direction.
Note
Please risk management in trading is a Key so use your money accordingly. If you like the idea then please like and boost. Thank you and Good Luck!
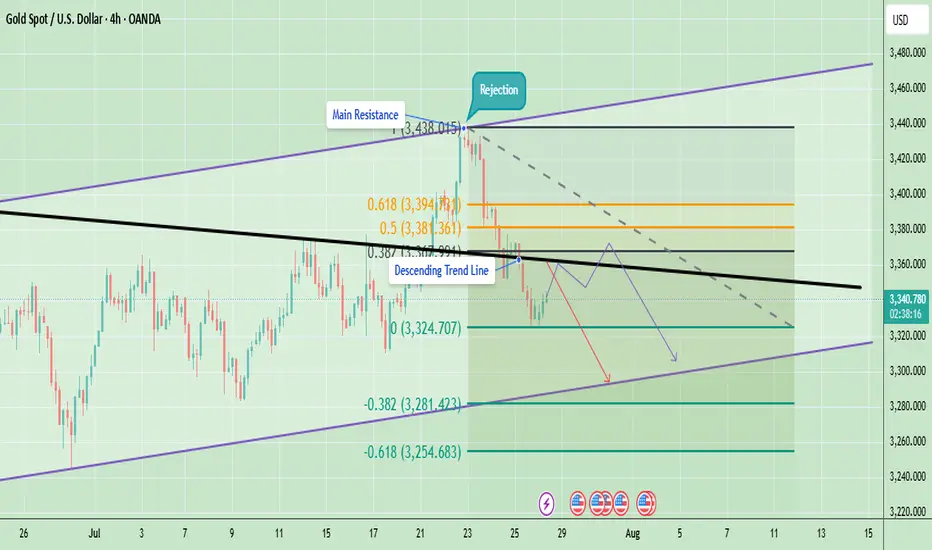
Technical Analysis - Gold Rejected at ResistanceGold is currently trading around $3,341 after facing a strong rejection from the $3,438 resistance area. This rejection coincided with the upper boundary of the trend channel and the main resistance zone, which also aligns with the Fibonacci 0.5–0.618 retracement levels. After the rejection, price fell below the descending trendline, indicating that short-term sellers have taken control.
On the downside, the immediate support sits at $3,324, which has acted as a short-term bounce level. A break below this could push gold lower toward $3,281 and potentially $3,254, which are key Fibonacci extension support levels. On the upside, the immediate hurdle is at $3,355–$3,360 (descending trendline). A breakout above this area will be critical for any bullish recovery attempt toward $3,381–$3,394 and eventually $3,420–$3,438.
At the moment, the short-term trend remains bearish because gold is trading below the descending resistance and showing lower highs. However, as long as gold holds above the $3,254 support zone, the medium-term structure remains neutral to bullish, giving bulls a chance if momentum shifts again.
Last week candle is pin bar bearish candle which is showing bearish momentum at the moment. The candle shows rejection near $3,400–$3,450, aligning with the triangle’s upper resistance trendline. If gold cannot reclaim and hold above last week’s high, price may drift lower to retest support zones around $3,248–$3,150 before another breakout attempt.
Note
Please risk management in trading is a Key so use your money accordingly. If you like the idea then please like and boost. Thank you and Good Luck!
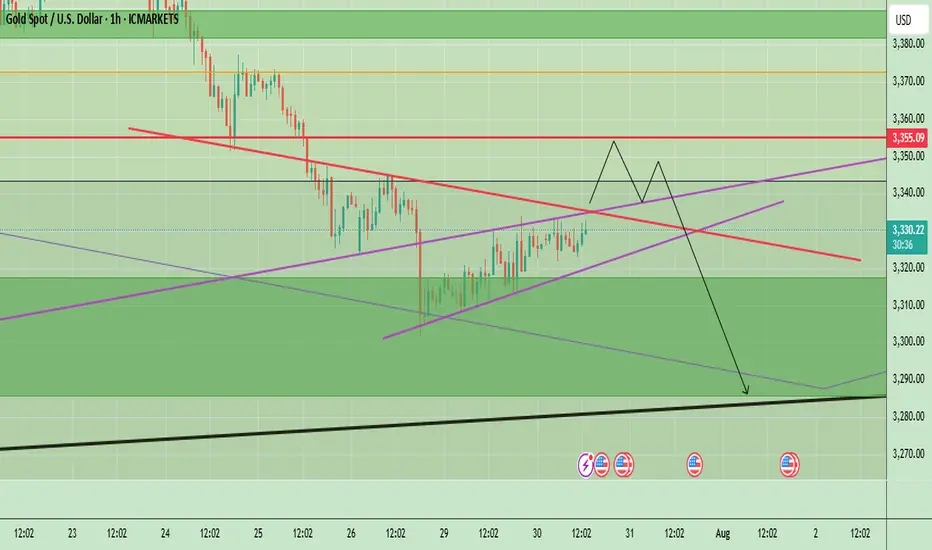
Gold Awaits Fed Rate Decision – Key Levels & Volatility AheadGold is currently trading near $3,332, showing a minor recovery after recent downward momentum. The price action on the 1-hour chart highlights a short-term ascending structure, which often acts as a corrective move rather than a strong bullish trend. The market previously saw significant selling pressure from above $3,355–$3,360, creating a short-term supply zone. Unless the price breaks and holds above this zone, the overall momentum remains bearish.
The chart also shows a projected price path where gold could push slightly higher toward $3,355, meet resistance, and potentially reverse downward again. Key support lies at $3,320, and if this breaks, we could see gold testing $3,290–$3,280 levels, aligning with the black trend line support. However, if bulls manage to break above $3,360, it would signal potential upside continuation toward $3,380–$3,400.
Key Points
- Key Resistance Levels: $3,355 and $3,360 (critical supply zone).
- Key Support Levels: $3,320 (short-term), followed by $3,290–$3,280 (major trendline support).
- Expected Short-Term Move: Possible push toward $3,355 → rejection → decline back toward $3,320 and possibly $3,290.
Bullish Breakout Scenario: A strong close above $3,360 could push price toward $3,380–$3,400.
Overall Bias: Bearish while trading below $3,360.
4hr Chart
Price remains under pressure below the descending trendline. A small pullback toward $3,345–$3,350 is possible, but as long as price stays under this resistance, the bias remains bearish with potential downside targets around $3,300–$3,280.
Key Levels:
- Resistance: $3,350 → $3,381 → $3,394
- Support: $3,324 → $3,281 → $3,254
Today’s FOMC interest rate decision is a key driver for Gold. Here’s the quick analysis:
- If Fed Hikes Rates or Maintains Hawkish Tone:
- Strong USD likely → Gold could face more selling pressure.
- Key support zones: $3,324 – $3,300, then $3,281 and $3,254.
- If Fed Pauses or Turns Dovish:
- Dollar weakens → Gold may bounce toward resistance zones.
- Upside levels: $3,355 – $3,360 and higher toward $3,381 – $3,394 (Fib levels).
Expect high volatility; $3,300 is a critical support to watch. A dovish Fed may give Gold short-term relief, but a hawkish stance could accelerate the downtrend.
Note
Please risk management in trading is a Key so use your money accordingly. If you like the idea then please like and boost. Thank you and Good Luck!
Gold Price Update – Bearish Flag Signals Possible Drop AheadGold is currently trading around $3,324, showing consolidation after a recent decline from the $3,345 region. The chart shows a bearish flag pattern forming after the sharp drop, indicating potential continuation of the downtrend. If gold fails to break above this region, sellers may push the price lower towards $3,301 and possibly $3,275.
The descending trend line adds further bearish pressure, limiting upside momentum unless gold decisively breaks and holds above $3,345. Overall, gold remains under short-term bearish sentiment, with the focus on support retests. Any bullish momentum will only be confirmed if the price closes above the flag and trendline resistance.
Key Points
Resistance Zones: $3,328 (0.618 Fib), $3,345 (flag top).
Support Zones: $3,301 (Fib base), $3,284, and $3,275 (bearish extension).
Trend Outlook: Short-term bearish unless price breaks above $3,345 with volume.
Bearish Targets: $3,301 → $3,284 → $3,275.
Bullish Invalidations: Break and close above $3,345 may shift bias to bullish.
Note
Please risk management in trading is a Key so use your money accordingly. If you like the idea then please like and boost. Thank you and Good Luck!

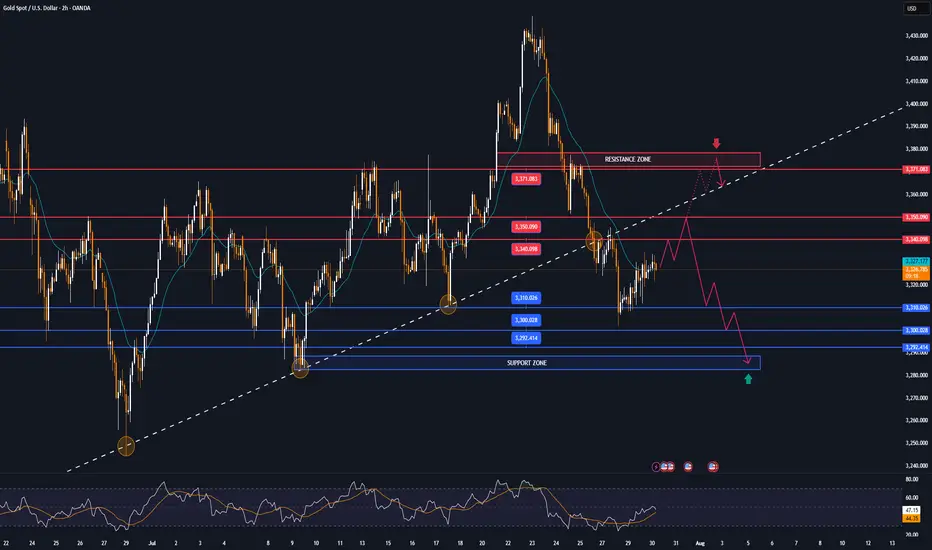
Gold breaks price channel, officially starts falling✏️ OANDA:XAUUSD price has officially broken the bullish wave structure and broken the bullish channel. A corrective downtrend has begun to form. If there is a pull back to the trendline today, it is considered a good opportunity for sell signals.
The liquidity zone 3250 is the target of this corrective downtrend. The 3283 zone also has to wait for confirmation because when the market falls and the momentum of the decline, the number of FOMO sellers will be very strong. The opposite direction is when closing back above 3375, Gold will return to the uptrend.
📉 Key Levels
SELL zone 3343-3345
Target: 3250
BUY trigger: Rejection candle 3285
Buy zone: 3251
Leave your comments on the idea. I am happy to read your views.

XAUUSDUpdate:
Gold Price Trend: As per our previous analysis on July 28, 2025, the price has now tested the support at 3,269. We expect that if the gold price can hold above 3,249, the gold price trend will remain bullish. We recommend considering buying in the red zone.
🔥Trading futures, forex, CFDs and stocks carries a risk of loss.
Please consider carefully whether such trading is suitable for you.
>>GooD Luck 😊
❤️ Like and subscribe to never miss a new idea!
Gold Weekly Outlook (XAUUSD) -28th JulyGold Enters a High-Stakes Week
This week sets the stage for major moves in gold. The charts are signalling liquidity grabs, premium compression, and volatility driven by upcoming macro catalysts.
Key events ahead:
Tuesday: ADP Employment Data
Wednesday: The Fed
Gold is currently consolidating beneath a critical supply zone, suggesting potential for a breakout or rejection. We'll align macro drivers with Smart Money Concepts, ICT methodology, Fibonacci levels, EMAs, RSI, and Fair Value Gaps to craft a precise trading framework.
Technically, price action reflects a corrective phase within a broader uptrend. Confluence support from the ascending trendline and a key horizontal level is in play. As long as price remains above 3342, a bounce toward 3400 remains the preferred scenario.
The broader bullish structure and underlying momentum suggest that once this retracement completes, the uptrend may resume with strength.
🟡 – Summary
🔹 Macro & HTF View:
Bias: Bullish but weakening under premium supply
Key Events: ADP (Tue), FOMC (Wed) → potential for liquidity grabs
Indicators:
RSI divergence (75 → 66)
EMAs flattening
Unfilled FVGs above (3365–3405) and below (3280–3320)
Key Fib targets: 3405 (127%) and 3439 (161.8%)
🔸 Weekly Key Zones
Supply (Short Trap): 3350–3439 → heavy confluence, short bias unless W1 closes above 3439
Primary Demand: 3220–3285 → ideal for news-driven long
Deep Discount (Long Only if Panic): 2960–3050
🎯 Strategy Summary
Short Setup:
Target 3350–3439 → wait for rejection after news
Long Setup:
Target 3220–3285 or deeper
Look for wick rejections + bullish structure reclaim
Avoid: 3285–3350 → indecision zone
🧭 Daily Zones
Sell Zone: 3345–3415 → trap area with FVG + Fib + EMA confluence
Buy Zones:
3290–3320 (primary)
3240–3270 (deeper)
3000–3140 (only if USD spikes)
⏱ H4 + Intraday Bias
Bias: Bearish below 3350
Short Zones:
3365–3405 (rejection only)
3355 (flip zone)
Buy Zones:
3290–3310 (reclaim setup)
3250–3280 (panic flush)
📌 Key Intraday Levels
Resistance: 3405, 3385, 3375–3350, 3350–3340
Support: 3314–3302, 3289–3272, 3260, 3240
⚠️ Final Execution Notes
Stay out of 3340–3326 zone – it’s chop
Wait for confirmation candles (engulfing, pin bars, OB reactions)
Discipline over prediction. Sniper mode only.
Disclaimer: For educational context only.

GOLD recovers after many days of declineOANDA:XAUUSD has recovered after several days of declines. Investors will focus on the Federal Reserve's interest rate decision on Wednesday, which is expected to cause significant market volatility.
Gold hit a three-week low of $3,301 an ounce on Monday, before recovering somewhat on Tuesday after falling for a fourth straight day as the dollar erased some of its earlier gains, boosting demand for the precious metal.
Falling US Treasury yields and a weak US jobs report also prompted investors to buy gold.
Data released by the U.S. Labor Department on Tuesday showed the number of jobs added fell in June after two straight months of gains.
The number of jobs added in June fell to 7.44 million from a revised 7.71 million in May. The median forecast of economists in a survey was 7.5 million.
Focus on the Federal Reserve's decision
The Federal Reserve will announce its interest rate decision at 01:00 IST on Thursday; Federal Reserve Chairman Powell will hold a press conference on monetary policy at 01:30 IST on the same day.
The market generally expects the Federal Reserve to keep interest rates unchanged, with the focus on whether Fed Chairman Powell's speech will provide any clues about the timing or pace of future rate cuts.
The market sees a very low chance of a rate cut in July and a roughly 40% chance of another rate cut in September, up from about 10% last month, according to the Chicago Mercantile Exchange's FedWatch tool. Investors will be closely watching the statement and Fed Chairman Powell's remarks at his post-meeting press conference for fresh clues on the timing of the next rate cut.
- If Powell opens the door to a rate cut in September, citing the recent trade deal as a reason to ease uncertainty, US Treasury yields could fall immediately, paving the way for gold prices to rise.
- On the other hand, if Powell avoids committing to a rate cut at this meeting, citing recent rising inflation data, gold prices could fall.
Gold typically performs well in low-interest-rate environments because it does not pay interest and its appeal increases when returns from other assets decline.
Technical Outlook Analysis OANDA:XAUUSD
Gold has recovered from the key $3,300 price point and is holding above $3,310, which is also the nearest support. However, the current recovery is not technically enough to create a short-term uptrend, or conditions for a sustained price increase. In terms of position, gold is under pressure with the 21-day EMA as the nearest resistance at around $3,340 – $3,350. If gold falls below the 0.382% Fibonacci retracement level, it will be eligible to open a new downtrend with a target of around $3,246 in the short term, more than the 0.50% Fibonacci retracement level.
On the other hand, RSI is below 50, and the current 50 level acts as momentum resistance in the short term. If RSI slopes down, it will signal bearish momentum with more downside ahead. For gold to qualify for bullish expectations, it needs to at least push price action above EMA21, then retrace back to the price channels and finally break above the 0.236% Fibonacci retracement level to confirm bullish conditions. The upside target could be towards $3,400 in the short term, more like $3,430 – $3,450.
For the day, the technical outlook for gold prices tends to lean more towards the downside, with the following notable points listed.
Support: 3,310 – 3,300 – 3,292 USD
Resistance: 3,340 – 3,350 – 3,371 USD
SELL XAUUSD PRICE 3376 - 3374⚡️
↠↠ Stop Loss 3380
→Take Profit 1 3368
↨
→Take Profit 2 3362
BUY XAUUSD PRICE 3280 - 3282⚡️
↠↠ Stop Loss 3276
→Take Profit 1 3288
↨
→Take Profit 2 3294
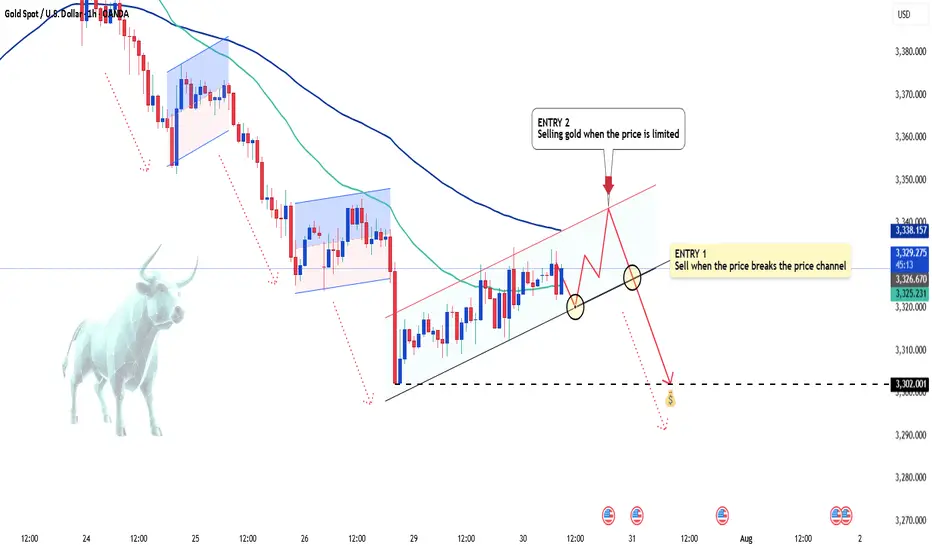
Gold's Strong Moves: Will the Bears Take Over?Hello everyone, Kevinn here!
Today, gold continues to experience significant fluctuations in the new week, with XAU/USD currently hovering around 3,325 USD. Amid the strong rise of the USD, the gold market has seen a sharp adjustment. However, the medium-term trend still seems to favor the bears.
The main reason for the turbulence in gold prices is the strengthening of the U.S. dollar, following strong economic news from the U.S. that points to a clear recovery. The stronger USD has made gold more expensive for international investors. Additionally, the market is awaiting further moves from the Fed regarding interest rate policies, which is limiting the flow of capital into gold.
Looking at the technical chart, we can see that although gold has shown a slight uptick, bearish pressures are still lurking. Indicators and patterns suggest that gold may break its rising price channel, with a high likelihood of further declines. The next support level could be around 3,310 USD, and if broken, gold may continue to fall toward 3,300 USD or lower.
Based on the signals from the chart, ENTRY 1 strategy would be to sell when the price breaks the upward channel. Additionally, if the price pulls back to the upper limit zone, ENTRY 2 could present another potential selling point.
For today's strategy, I expect gold to decrease. What do you think? Share your thoughts in the comments!
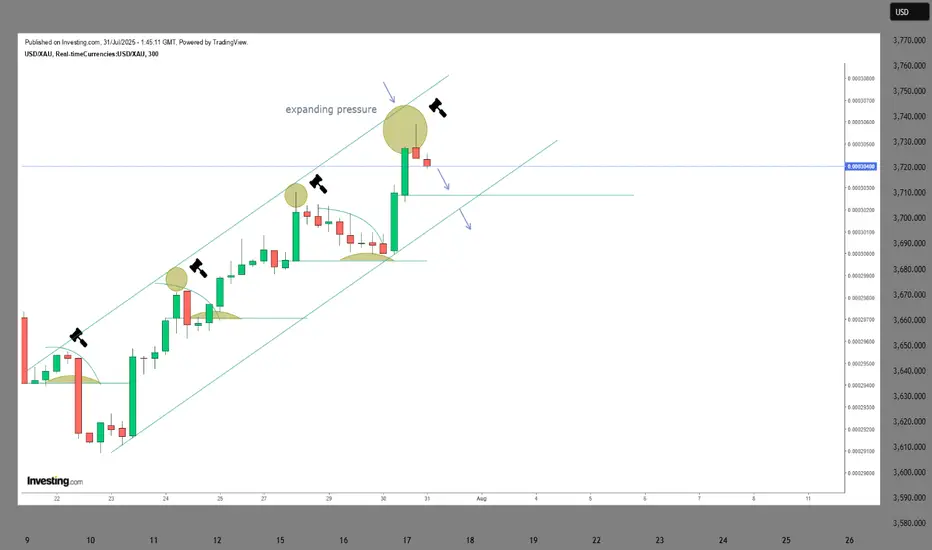
GOLD prep work to ATH retap has started. seed at 3270!First thing first.
Diagram above is in reverse metrics (USDXAU)
--------
GOLD, has been met with some well deserved respite on price growth after a series of parabolic highs this past few weeks. And this healthy trims are warranted in the grand scheme of things -- to sustain its upward trajectory. A price rest is definitely welcomed.
Now based on our latest daily metrics, gold is showing some low key hints of shift -- it may not be visible to 99% of traders -- but it is there now to magnify.
Diagram above is in reverse metrics (USDXAU). It is currently showing some pressure expansion for bears and hinting of prep work to reverse.
This is a precursor of a massive structure change-- for that elusive upside continuation.
On the daily metrics, we got some hop signals here as well from -- first one in a while. Price baselines detaching itself from the descending trend line. There maybe something here now. A good zone to seed on the most discounted bargain levels -- with safety.
Spotted at 3260.
Interim mid target: ATH at 3500
Long term. 4k++
Trade safely.
TAYOR.