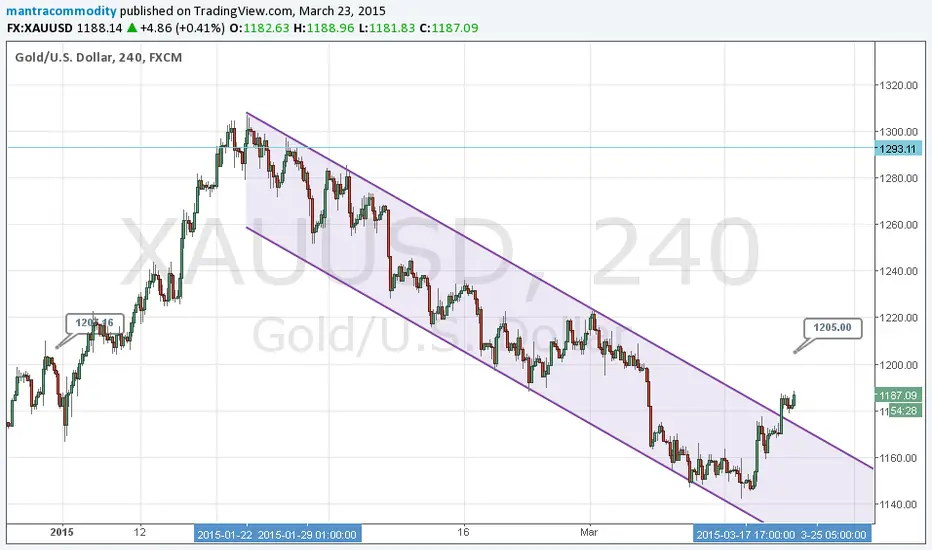
Gold recovery still confusingGold (23.03.2015) moved higher as mention in our last article just around swiss gold referendum & posted a higher above $1300 mark. However it felt sharply & reached to the previous bottom around $1138.
Now gold showing recovery from previous bottom level & also broken from a shot term descending channel as shown in picture. However this breakout is not supported well in terms of volume & that force us to stay concern about this upside rally. The strength of this rally will be tested on $1205 once.
On fundamental side a clear signal from FED to not raise the interest rate very soon & over bought conditions in dollar could support further.
Based on above studies, gold probably will more higher towards $1205 in coming trading session & will test the strength on this mark.
Note - Above technical analysis is not a buy/sell recommendation. For recommendations Contact Us
Call Us : 088890 34986
www.mantracommodity.blogspot.in
MCX levels -> S2(25900) S1(26010) cmp(26150) R1(26330) R2(26510)
Goldbugs
You can't keep Goldie awayGC is setting up for a visit of the November lows. Pull backs are sellable. If you are in from the bear flag trim and trail. We are looking for a test of the lows, then 1100.

Repeat of 2013 GLD Crash - Updated(3/9)- TL;DR: GLD in descending triangle similar to that of 2011- 13. Expecting up to 25% decline over next 6 months.
- Trade: Short, Limit Cover half @ $98 and half @ $85, Stop Loss @ 124.5 (8%) -OR- Jun 30 113.00 Puts trading $2.91, BE $110
After nearly three years of uninterrupted gains, beginning in late 2008 and ending in late 2011, GLD set a high water mark at $185. Over the next year the etf settled into a clear descending triangle pattern, the base of which measured roughly $37 or 20%. The $151 support was shattered in early April giving way to a roughly $37 or 25% decline in less than three months. This accounts for a measured move of 1.0(nominal measure of base).
Again we find ourselves low in the tail end of a descending triangle, after four consecutively lower highs. Oddly enough the base of this pattern measures $28.5, again another 20% measured base. A full measured move would take GLD to roughly $85, down 25%, coincident with '08 - '10 support. Interim support to be found around $97. Remember the first half of the year is typically seasonally weak for gold prices, the last crash occurring on the threshold of March and April.
Additionally consider that gold has a particularly loyal set of investors; they love to buy the dips and psychological supports( at least from what I can tell). So on one hand this absolutely bolsters the current support, on the other hand it leads to interesting circumstances. Below this current price level the volume at price drops off relatively sharply, until about $100. When you see heavy accumulation at a given price support with a volume pocket below, it creates vacuum conditions and usually leads to capitulation if the support is broken. These same conditions existed and, I believe, contributed to fast drop in '13.
If you're a gold bug, it would be prudent to maybe hedge your position with some puts.
If you're looking to short, here might be your catalyst.
Regardless of where you stand, best of luck.
Update (10am: 3/9/15) -
Main support has been broken, but two intermediary supports remain for the short term. The first is $111.50, which I will give moderate attention to. The second is at $109.90, which should be the last strand. Otherwise I believe the trade is on. Cheers. If you follow currencies check out my related DXY idea.

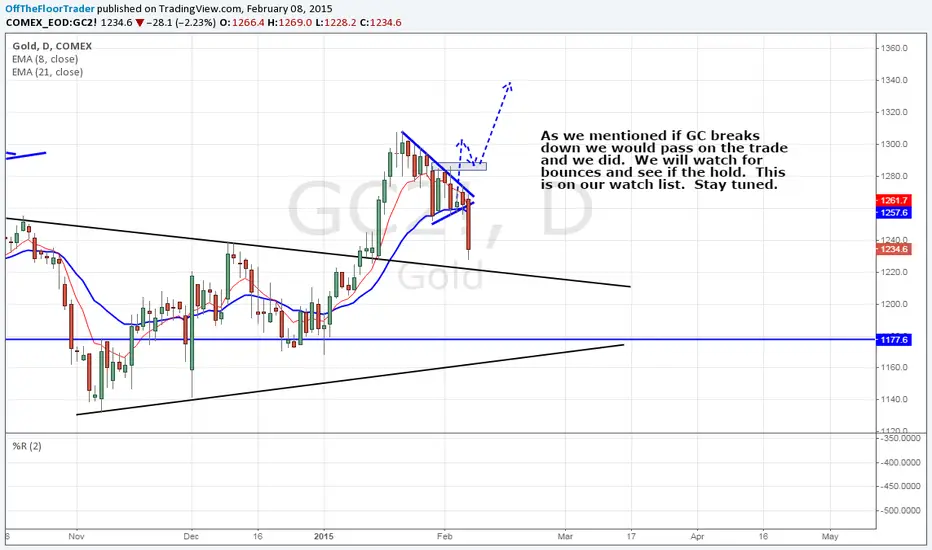
Yep...we ignored GoldieAs we mentioned if GC breaks down we would pass on the trade and we did. We will watch for bounces and see if the hold. This is on our watch list. Stay tuned.
Watch more GC analysis here: youtu.be
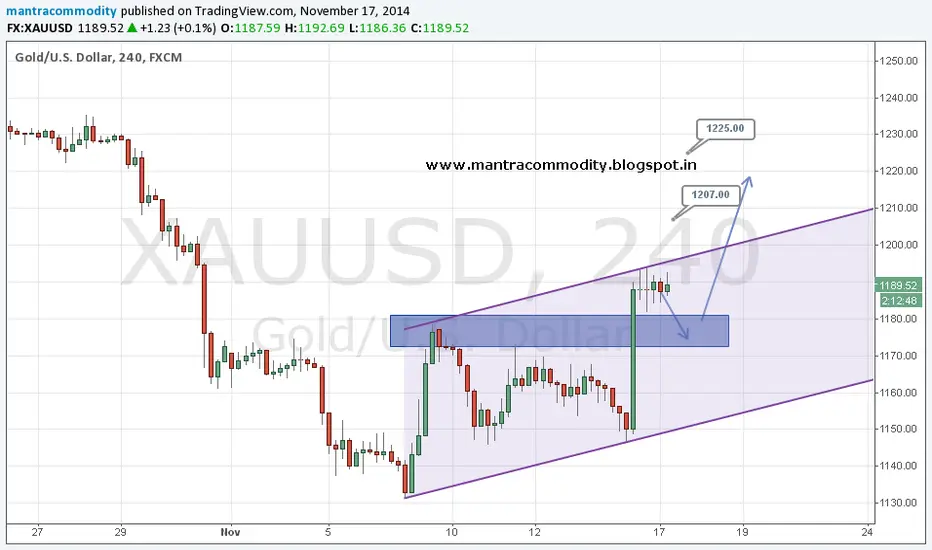
Gold broken major resistance Gold(17.11.2014) moved higher in last week on profit booking as well as on challenging fundamental growth of major economy. However branching the strong resistance zone with volume could change long term scenario.
Now gold is trading around $1187 & we can see on charts, friday gold rally more than 3% & provided a closing above $1182-1172 resistance which where able to stop gold momentum many times. Technically after breaking $1180 mark gold made a low of $1131 while unable to close below $1138 mark which represent the 161.8% Fibonacci retracement level. This area was very close to the lower trendline of current descending channel too. An elliott wave bearish pattern completion also suggest for 3 corrective wave pattern ahead.
On fundamental side, upcoming swiss bank referendum on 30th nov could play major role for gold price. A voting result in favor of swiss referendum will force swiss banks to buy big quantity of gold which will never come back in market for liquidation.
Based on above studies , there is a major probability that gold will provide a corrective move towards support zone & then move upside for possible targets around $1207 & then $1225 atleast. A day close below $1272 will delay the forecast.
Note - Above technical analysis is not a buy/sell recommendation. For recommendations Contact Us
Call Us : 088890 34986
MCX levels -> S2(26160) S1(26300) cmp(26425) R1(26650) R2(27000)
www.mantracommodity.blogspot.in
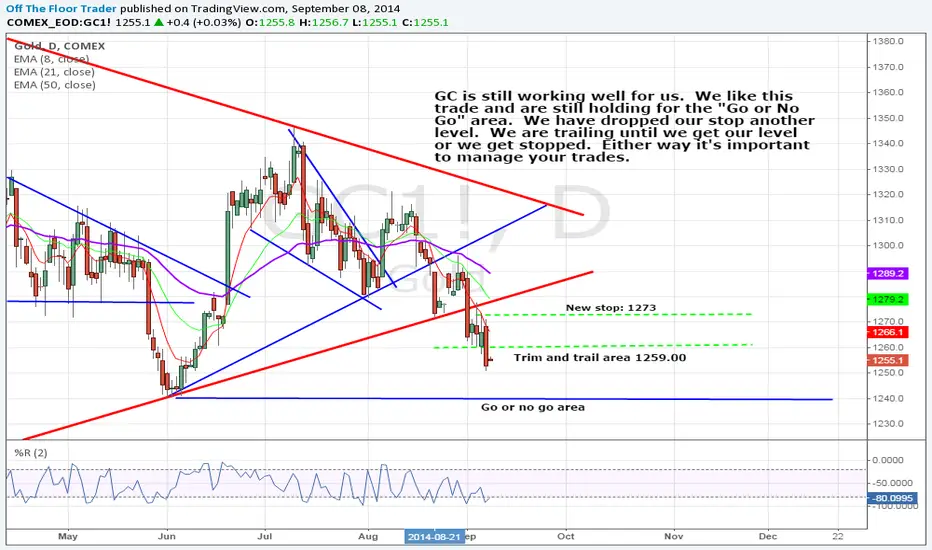
"Looking good Billy Ray"GC is still working well for us. We like this trade and are still holding for the "Go or No Go" area. We have dropped our stop another level. We are trailing until we get our level or we get stopped. Either way it's important to manage your trades.
When this breaks it could run!We are choosing to to stay out of GC1! for the time being. While the break of the descending wedge was tradeable...the action has been whippy and the risk has been hard to identify. Look at the larger wedge building. We are keeping a close eye on this for a big break.
