XAU/USD 18 July 2025 Intraday AnalysisH4 Analysis:
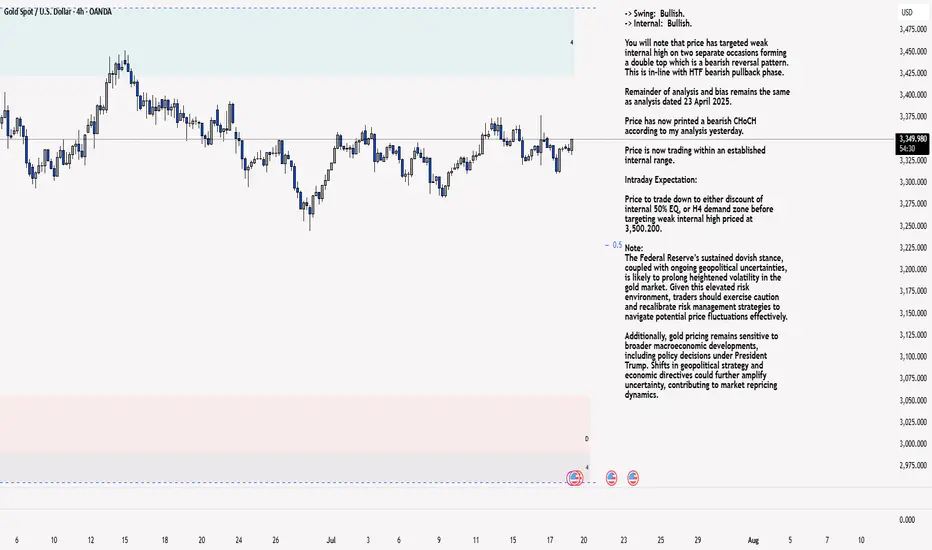
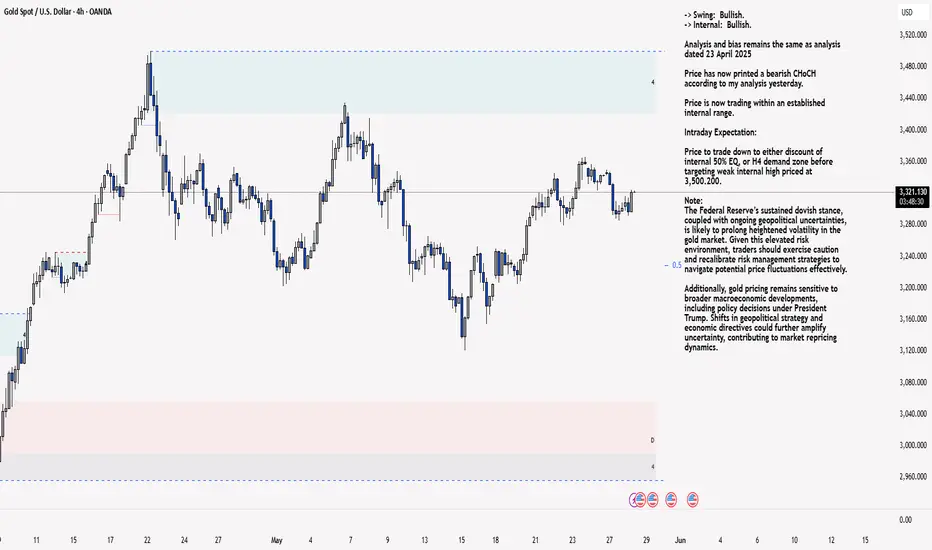
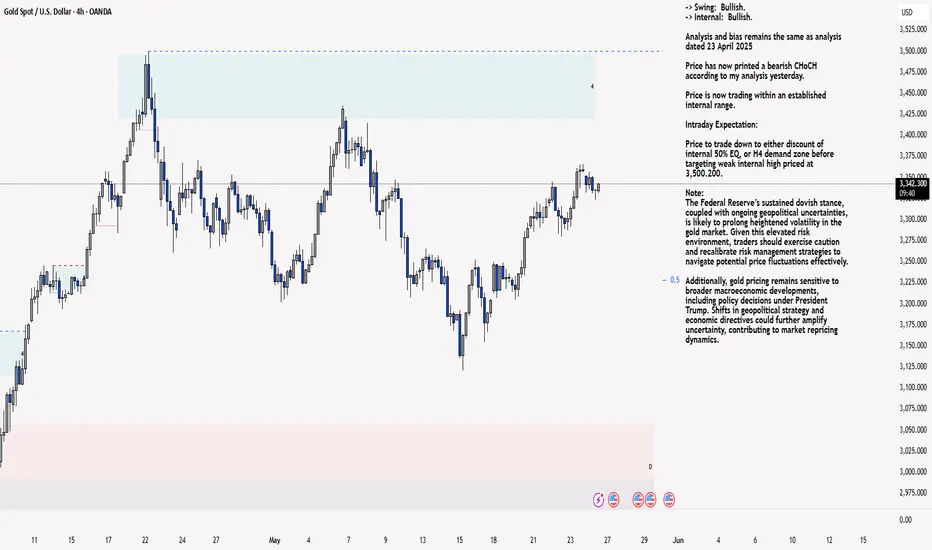
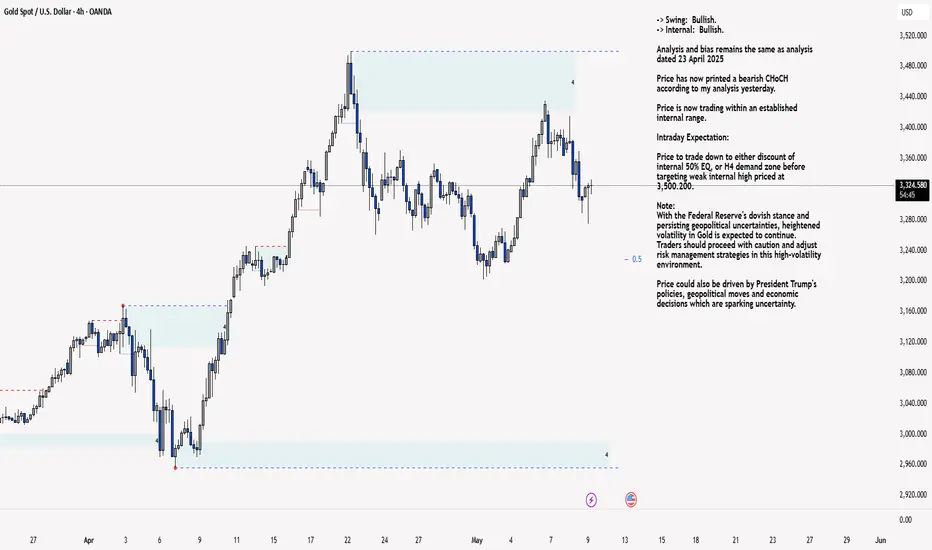
-> Swing: Bullish.
-> Internal: Bullish.
You will note that price has targeted weak internal high on two separate occasions forming a double top which is a bearish reversal pattern. This is in-line with HTF bearish pullback phase.
Remainder of analysis and bias remains the same as analysis dated 23 April 2025.
Price has now printed a bearish CHoCH according to my analysis yesterday.
Price is now trading within an established internal range.
Intraday Expectation:
Price to trade down to either discount of internal 50% EQ, or H4 demand zone before targeting weak internal high priced at 3,500.200.
Note:
The Federal Reserve’s sustained dovish stance, coupled with ongoing geopolitical uncertainties, is likely to prolong heightened volatility in the gold market. Given this elevated risk environment, traders should exercise caution and recalibrate risk management strategies to navigate potential price fluctuations effectively.
Additionally, gold pricing remains sensitive to broader macroeconomic developments, including policy decisions under President Trump. Shifts in geopolitical strategy and economic directives could further amplify uncertainty, contributing to market repricing dynamics.
H4 Chart:
M15 Analysis:
-> Swing: Bullish.
-> Internal: Bullish.
H4 Timeframe - Price has failed to target weak internal high, therefore, it would not be unrealistic if price printed a bearish iBOS.
The remainder of my analysis shall remain the same as analysis dated 13 June 2025, apart from target price.
As per my analysis dated 22 May 2025 whereby I mentioned price can be seen to be reacting at discount of 50% EQ on H4 timeframe, therefore, it is a viable alternative that price could potentially print a bullish iBOS on M15 timeframe despite internal structure being bearish.
Price has printed a bullish iBOS followed by a bearish CHoCH, which indicates, but does not confirm, bearish pullback phase initiation. I will however continue to monitor, with respect to depth of pullback.
Intraday Expectation:
Price to continue bearish, react at either M15 supply zone, or discount of 50% internal EQ before targeting weak internal high priced at 3,451.375.
Note:
Gold remains highly volatile amid the Federal Reserve's continued dovish stance, persistent and escalating geopolitical uncertainties. Traders should implement robust risk management strategies and remain vigilant, as price swings may become more pronounced in this elevated volatility environment.
Additionally, President Trump’s recent tariff announcements are expected to further amplify market turbulence, potentially triggering sharp price fluctuations and whipsaws.
M15 Chart:
Golddollarforecast
XAU/USD 24 June 2025 Intraday AnalysisH4 Analysis:
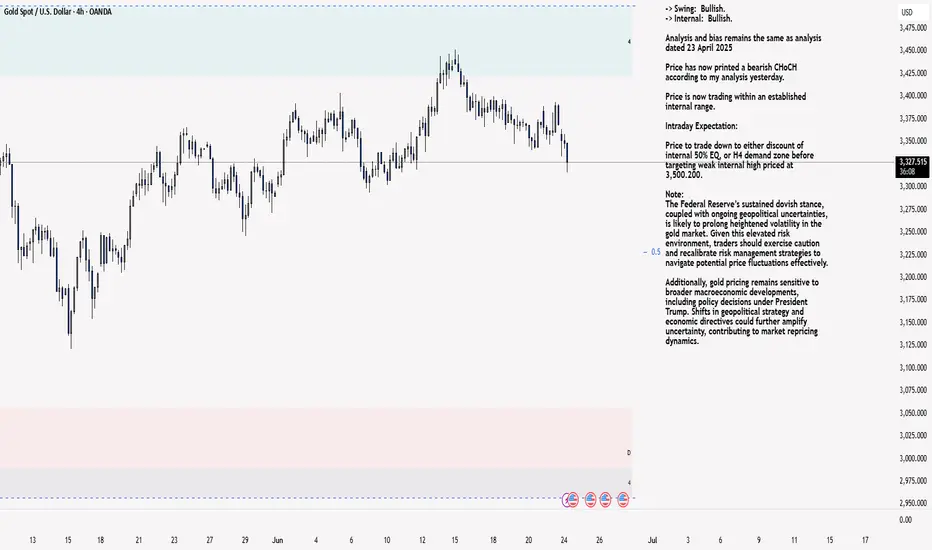
-> Swing: Bullish.
-> Internal: Bullish.
Analysis and bias remains the same as analysis dated 23 April 2025
Price has now printed a bearish CHoCH according to my analysis yesterday.
Price is now trading within an established internal range.
Intraday Expectation:
Price to trade down to either discount of internal 50% EQ, or H4 demand zone before targeting weak internal high priced at 3,500.200.
Note:
The Federal Reserve’s sustained dovish stance, coupled with ongoing geopolitical uncertainties, is likely to prolong heightened volatility in the gold market. Given this elevated risk environment, traders should exercise caution and recalibrate risk management strategies to navigate potential price fluctuations effectively.
Additionally, gold pricing remains sensitive to broader macroeconomic developments, including policy decisions under President Trump. Shifts in geopolitical strategy and economic directives could further amplify uncertainty, contributing to market repricing dynamics.
H4 Chart:
M15 Analysis:
-> Swing: Bullish.
-> Internal: Bullish.
Following previous high, and printing of bearish CHoCH, price has pulled back to an M15 supply zone, where we are currently seeing a reaction. Therefore, I shall now confirm internal high.
Price is now trading within an established internal range.
The remainder of my analysis shall remain the same as analysis dated 13 June 2025, apart from target price.
As per my analysis dated 22 May 2025 whereby I mentioned price can be seen to be reacting at discount of 50% EQ on H4 timeframe, therefore, it is a viable alternative that price could potentially print a bullish iBOS on M15 timeframe despite internal structure being bearish.
Price has printed a bullish iBOS followed by a bearish CHoCH, which indicates, but does not confirm, bearish pullback phase initiation. I will however continue to monitor, with respect to depth of pullback.
Intraday Expectation:
Price to continue bearish, react at either M15 supply zone, or discount of 50% internal EQ before targeting weak internal high priced at 3,451.375.
Note:
Gold remains highly volatile amid the Federal Reserve's continued dovish stance, persistent and escalating geopolitical uncertainties. Traders should implement robust risk management strategies and remain vigilant, as price swings may become more pronounced in this elevated volatility environment.
Additionally, President Trump’s recent tariff announcements are expected to further amplify market turbulence, potentially triggering sharp price fluctuations and whipsaws.
M15 Chart:
XAU/USD 10 June 2025 Intraday AnalysisH4 Analysis:
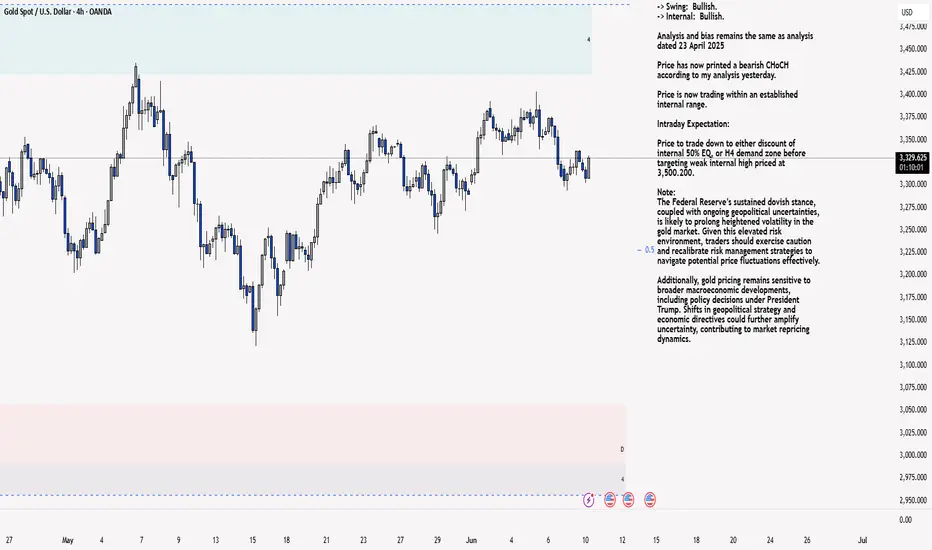
-> Swing: Bullish.
-> Internal: Bullish.
Analysis and bias remains the same as analysis dated 23 April 2025
Price has now printed a bearish CHoCH according to my analysis yesterday.
Price is now trading within an established internal range.
Intraday Expectation:
Price to trade down to either discount of internal 50% EQ, or H4 demand zone before targeting weak internal high priced at 3,500.200.
Note:
The Federal Reserve’s sustained dovish stance, coupled with ongoing geopolitical uncertainties, is likely to prolong heightened volatility in the gold market. Given this elevated risk environment, traders should exercise caution and recalibrate risk management strategies to navigate potential price fluctuations effectively.
Additionally, gold pricing remains sensitive to broader macroeconomic developments, including policy decisions under President Trump. Shifts in geopolitical strategy and economic directives could further amplify uncertainty, contributing to market repricing dynamics.
H4 Chart:
M15 Analysis:
-> Swing: Bullish.
-> Internal: Bearish.
Analysis and bias remains the same as analysis dated 22 May 2025.
In my analysis from 12 May 2025, I noted that price had yet to target the weak internal high, including on the H4 timeframe. This aligns with the ongoing corrective bearish pullback across higher timeframes, so a bearish internal Break of Structure (iBOS) was a likely outcome.
As anticipated, price targeted strong internal low, confirming a bearish iBOS.
Price has remained within the internal range for an extended period and has yet to target the weak internal low. A contributing factor could be the bullish nature of the H4 timeframe's internal range, which has reacted from a discounted level at 50% of the internal equilibrium (EQ).
Intraday Expectation:
Technically price to continue bullish, react at either premium of internal 50% EQ or M15 demand zone before targeting weak internal low priced at 3,120.765.
Alternative scenario:
Price can be seen to be reacting at discount of 50% EQ on H4 timeframe, therefore, it is a viable alternative that price could potentially print a bullish iBOS on M15 timeframe.
Note:
Gold remains highly volatile amid the Federal Reserve's continued dovish stance and persistent geopolitical uncertainties. Traders should implement robust risk management strategies and remain vigilant, as price swings may become more pronounced in this elevated volatility environment.
Additionally, President Trump’s recent tariff announcements are expected to further amplify market turbulence, potentially triggering sharp price fluctuations and whipsaws.
M15 Chart:
XAU/USD 09 June 2025 Intraday AnalysisH4 Analysis:
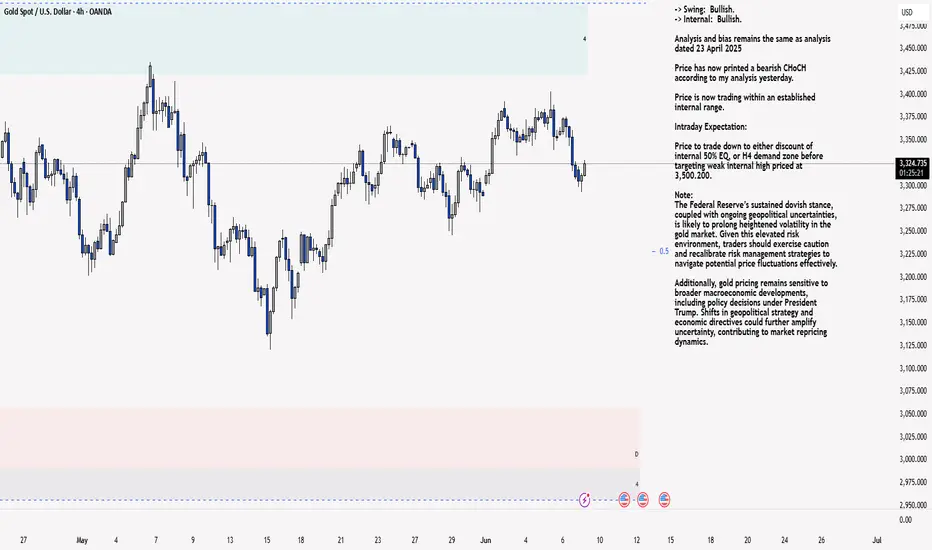
-> Swing: Bullish.
-> Internal: Bullish.
Analysis and bias remains the same as analysis dated 23 April 2025
Price has now printed a bearish CHoCH according to my analysis yesterday.
Price is now trading within an established internal range.
Intraday Expectation:
Price to trade down to either discount of internal 50% EQ, or H4 demand zone before targeting weak internal high priced at 3,500.200.
Note:
The Federal Reserve’s sustained dovish stance, coupled with ongoing geopolitical uncertainties, is likely to prolong heightened volatility in the gold market. Given this elevated risk environment, traders should exercise caution and recalibrate risk management strategies to navigate potential price fluctuations effectively.
Additionally, gold pricing remains sensitive to broader macroeconomic developments, including policy decisions under President Trump. Shifts in geopolitical strategy and economic directives could further amplify uncertainty, contributing to market repricing dynamics.
H4 Chart:
M15 Analysis:
-> Swing: Bullish.
-> Internal: Bearish.
Analysis and bias remains the same as analysis dated 22 May 2025.
In my analysis from 12 May 2025, I noted that price had yet to target the weak internal high, including on the H4 timeframe. This aligns with the ongoing corrective bearish pullback across higher timeframes, so a bearish internal Break of Structure (iBOS) was a likely outcome.
As anticipated, price targeted strong internal low, confirming a bearish iBOS.
Price has remained within the internal range for an extended period and has yet to target the weak internal low. A contributing factor could be the bullish nature of the H4 timeframe's internal range, which has reacted from a discounted level at 50% of the internal equilibrium (EQ).
Intraday Expectation:
Technically price to continue bullish, react at either premium of internal 50% EQ or M15 demand zone before targeting weak internal low priced at 3,120.765.
Alternative scenario:
Price can be seen to be reacting at discount of 50% EQ on H4 timeframe, therefore, it is a viable alternative that price could potentially print a bullish iBOS on M15 timeframe.
Note:
Gold remains highly volatile amid the Federal Reserve's continued dovish stance and persistent geopolitical uncertainties. Traders should implement robust risk management strategies and remain vigilant, as price swings may become more pronounced in this elevated volatility environment.
Additionally, President Trump’s recent tariff announcements are expected to further amplify market turbulence, potentially triggering sharp price fluctuations and whipsaws.
M15 Chart:
XAU/USD 09-13 June 2025 Weekly AnalysisWeekly Analysis:
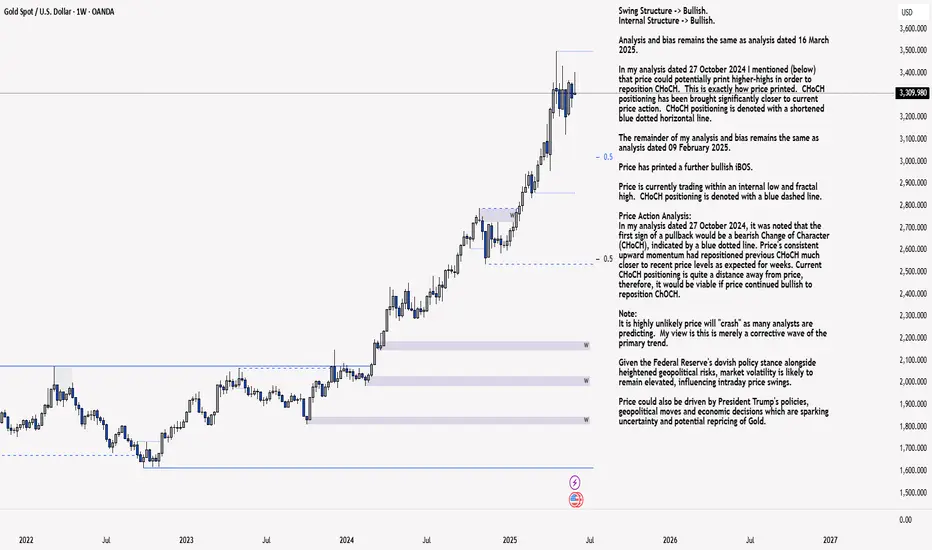
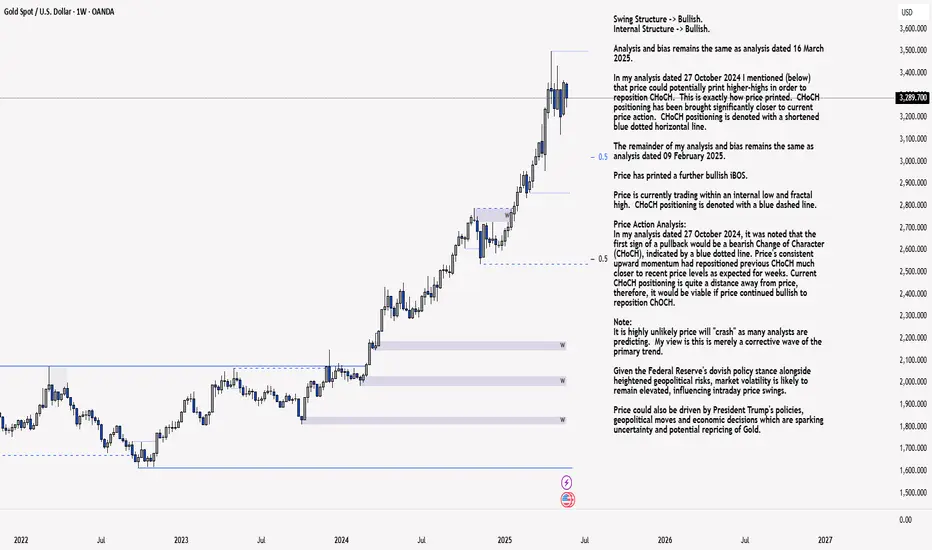
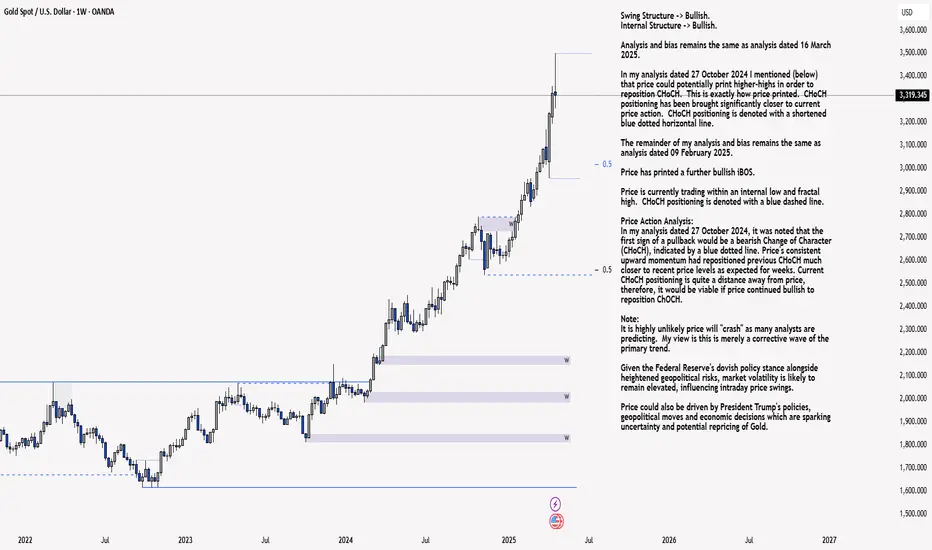
Swing Structure -> Bullish.
Internal Structure -> Bullish.
Analysis and bias remains the same as analysis dated 16 March 2025.
In my analysis dated 27 October 2024 I mentioned (below) that price could potentially print higher-highs in order to reposition CHoCH. This is exactly how price printed. CHoCH positioning has been brought significantly closer to current price action. CHoCH positioning is denoted with a shortened blue dotted horizontal line.
The remainder of my analysis and bias remains the same as analysis dated 09 February 2025.
Price has printed a further bullish iBOS.
Price is currently trading within an internal low and fractal high. CHoCH positioning is denoted with a blue dashed line.
Price Action Analysis:
In my analysis dated 27 October 2024, it was noted that the first sign of a pullback would be a bearish Change of Character (CHoCH), indicated by a blue dotted line. Price's consistent upward momentum had repositioned previous CHoCH much closer to recent price levels as expected for weeks. Current CHoCH positioning is quite a distance away from price, therefore, it would be viable if price continued bullish to reposition ChOCH.
Note:
It is highly unlikely price will "crash" as many analysts are predicting. My view is this is merely a corrective wave of the primary trend.
Given the Federal Reserve's dovish policy stance alongside heightened geopolitical risks, market volatility is likely to remain elevated, influencing intraday price swings.
Price could also be driven by President Trump's policies, geopolitical moves and economic decisions which are sparking uncertainty and potential repricing of Gold.
Weekly Chart:
Daily Analysis:
Swing -> Bullish.
Internal -> Bullish.
Analysis and Bias remains the same as Analysis dated 11 May 2025.
Since my last weekly analysis price has finally printed a bearish CHoCH.
This is the first indication, but not confirmation of bearish pullback phase initiation.
Price is now trading within an established internal range.
Price should now technically trade down to either discount of 50% internal EQ, or Daily demand zone before targeting weak internal high, priced at 3,500.200.
Note:
The Federal Reserve’s continued dovish stance, coupled with escalating geopolitical uncertainties, is expected to sustain elevated market volatility, influencing both intraday and broader trend developments.
Additionally, price action may be further shaped by U.S. policy decisions, including measures enacted under President Trump. Shifts in geopolitical strategy and economic policymaking could introduce further uncertainty, contributing to the ongoing repricing dynamics within the gold market.
Daily Chart:
H4 Analysis:
-> Swing: Bullish.
-> Internal: Bullish.
Analysis and bias remains the same as analysis dated 23 April 2025
Price has now printed a bearish CHoCH according to my analysis yesterday.
Price is now trading within an established internal range.
Intraday Expectation:
Price to trade down to either discount of internal 50% EQ, or H4 demand zone before targeting weak internal high priced at 3,500.200.
Note:
The Federal Reserve’s sustained dovish stance, coupled with ongoing geopolitical uncertainties, is likely to prolong heightened volatility in the gold market. Given this elevated risk environment, traders should exercise caution and recalibrate risk management strategies to navigate potential price fluctuations effectively.
Additionally, gold pricing remains sensitive to broader macroeconomic developments, including policy decisions under President Trump. Shifts in geopolitical strategy and economic directives could further amplify uncertainty, contributing to market repricing dynamics.
H4 Chart:
XAU/USD 02-06 June 2025 Intraday AnalysisWeekly Analysis:
Swing Structure -> Bullish.
Internal Structure -> Bullish.
Analysis and bias remains the same as analysis dated 16 March 2025.
In my analysis dated 27 October 2024 I mentioned (below) that price could potentially print higher-highs in order to reposition CHoCH. This is exactly how price printed. CHoCH positioning has been brought significantly closer to current price action. CHoCH positioning is denoted with a shortened blue dotted horizontal line.
The remainder of my analysis and bias remains the same as analysis dated 09 February 2025.
Price has printed a further bullish iBOS.
Price is currently trading within an internal low and fractal high. CHoCH positioning is denoted with a blue dashed line.
Price Action Analysis:
In my analysis dated 27 October 2024, it was noted that the first sign of a pullback would be a bearish Change of Character (CHoCH), indicated by a blue dotted line. Price's consistent upward momentum had repositioned previous CHoCH much closer to recent price levels as expected for weeks. Current CHoCH positioning is quite a distance away from price, therefore, it would be viable if price continued bullish to reposition ChOCH.
Note:
It is highly unlikely price will "crash" as many analysts are predicting. My view is this is merely a corrective wave of the primary trend.
Given the Federal Reserve's dovish policy stance alongside heightened geopolitical risks, market volatility is likely to remain elevated, influencing intraday price swings.
Price could also be driven by President Trump's policies, geopolitical moves and economic decisions which are sparking uncertainty and potential repricing of Gold.
Weekly Chart:
Daily Analysis:
Swing -> Bullish.
Internal -> Bullish.
Analysis and Bias remains the same as Analysis dated 11 May 2025.
Since my last weekly analysis price has finally printed a bearish CHoCH.
This is the first indication, but not confirmation of bearish pullback phase initiation.
Price is now trading within an established internal range.
Price should now technically trade down to either discount of 50% internal EQ, or Daily demand zone before targeting weak internal high, priced at 3,500.200.
Note:
The Federal Reserve’s continued dovish stance, coupled with escalating geopolitical uncertainties, is expected to sustain elevated market volatility, influencing both intraday and broader trend developments.
Additionally, price action may be further shaped by U.S. policy decisions, including measures enacted under President Trump. Shifts in geopolitical strategy and economic policymaking could introduce further uncertainty, contributing to the ongoing repricing dynamics within the gold market.
Daily Chart:
H4 Analysis:
-> Swing: Bullish.
-> Internal: Bullish.
Analysis and bias remains the same as analysis dated 23 April 2025
Price has now printed a bearish CHoCH according to my analysis yesterday.
Price is now trading within an established internal range.
Intraday Expectation:
Price to trade down to either discount of internal 50% EQ, or H4 demand zone before targeting weak internal high priced at 3,500.200.
Note:
The Federal Reserve’s sustained dovish stance, coupled with ongoing geopolitical uncertainties, is likely to prolong heightened volatility in the gold market. Given this elevated risk environment, traders should exercise caution and recalibrate risk management strategies to navigate potential price fluctuations effectively.
Additionally, gold pricing remains sensitive to broader macroeconomic developments, including policy decisions under President Trump. Shifts in geopolitical strategy and economic directives could further amplify uncertainty, contributing to market repricing dynamics.
H4 Chart:
XAU/USD 28 May 2025 Intraday AnalysisH4 Analysis:
-> Swing: Bullish.
-> Internal: Bullish.
Analysis and bias remains the same as analysis dated 23 April 2025
Price has now printed a bearish CHoCH according to my analysis yesterday.
Price is now trading within an established internal range.
Intraday Expectation:
Price to trade down to either discount of internal 50% EQ, or H4 demand zone before targeting weak internal high priced at 3,500.200.
Note:
The Federal Reserve’s sustained dovish stance, coupled with ongoing geopolitical uncertainties, is likely to prolong heightened volatility in the gold market. Given this elevated risk environment, traders should exercise caution and recalibrate risk management strategies to navigate potential price fluctuations effectively.
Additionally, gold pricing remains sensitive to broader macroeconomic developments, including policy decisions under President Trump. Shifts in geopolitical strategy and economic directives could further amplify uncertainty, contributing to market repricing dynamics.
H4 Chart:
M15 Analysis:
-> Swing: Bullish.
-> Internal: Bearish.
Analysis and bias remains the same as analysis dated 22 May 2025.
In my analysis from 12 May 2025, I noted that price had yet to target the weak internal high, including on the H4 timeframe. This aligns with the ongoing corrective bearish pullback across higher timeframes, so a bearish internal Break of Structure (iBOS) was a likely outcome.
As anticipated, price targeted strong internal low, confirming a bearish iBOS.
Price has remained within the internal range for an extended period and has yet to target the weak internal low. A contributing factor could be the bullish nature of the H4 timeframe's internal range, which has reacted from a discounted level at 50% of the internal equilibrium (EQ).
Intraday Expectation:
Technically price to continue bullish, react at either premium of internal 50% EQ or M15 demand zone before targeting weak internal low priced at 3,120.765.
Alternative scenario:
Price can be seen to be reacting at discount of 50% EQ on H4 timeframe, therefore, it is a viable alternative that price could potentially print a bullish iBOS on M15 timeframe.
Note:
Gold remains highly volatile amid the Federal Reserve's continued dovish stance and persistent geopolitical uncertainties. Traders should implement robust risk management strategies and remain vigilant, as price swings may become more pronounced in this elevated volatility environment.
Additionally, President Trump’s recent tariff announcements are expected to further amplify market turbulence, potentially triggering sharp price fluctuations and whipsaws.
M15 Chart:
XAU/USD 26 May 2025 Intraday AnalysisH4 Analysis:
-> Swing: Bullish.
-> Internal: Bullish.
Analysis and bias remains the same as analysis dated 23 April 2025
Price has now printed a bearish CHoCH according to my analysis yesterday.
Price is now trading within an established internal range.
Intraday Expectation:
Price to trade down to either discount of internal 50% EQ, or H4 demand zone before targeting weak internal high priced at 3,500.200.
Note:
The Federal Reserve’s sustained dovish stance, coupled with ongoing geopolitical uncertainties, is likely to prolong heightened volatility in the gold market. Given this elevated risk environment, traders should exercise caution and recalibrate risk management strategies to navigate potential price fluctuations effectively.
Additionally, gold pricing remains sensitive to broader macroeconomic developments, including policy decisions under President Trump. Shifts in geopolitical strategy and economic directives could further amplify uncertainty, contributing to market repricing dynamics.
H4 Chart:
M15 Analysis:
-> Swing: Bullish.
-> Internal: Bearish.
Analysis and bias remains the same as analysis dated 22 May 2025.
In my analysis from 12 May 2025, I noted that price had yet to target the weak internal high, including on the H4 timeframe. This aligns with the ongoing corrective bearish pullback across higher timeframes, so a bearish internal Break of Structure (iBOS) was a likely outcome.
As anticipated, price targeted strong internal low, confirming a bearish iBOS.
Price has remained within the internal range for an extended period and has yet to target the weak internal low. A contributing factor could be the bullish nature of the H4 timeframe's internal range, which has reacted from a discounted level at 50% of the internal equilibrium (EQ).
Intraday Expectation:
Technically price to continue bullish, react at either premium of internal 50% EQ or M15 demand zone before targeting weak internal low priced at 3,120.765.
Alternative scenario:
Price can be seen to be reacting at discount of 50% EQ on H4 timeframe, therefore, it is a viable alternative that price could potentially print a bullish iBOS on M15 timeframe.
Note:
Gold remains highly volatile amid the Federal Reserve's continued dovish stance and persistent geopolitical uncertainties. Traders should implement robust risk management strategies and remain vigilant, as price swings may become more pronounced in this elevated volatility environment.
Additionally, President Trump’s recent tariff announcements are expected to further amplify market turbulence, potentially triggering sharp price fluctuations and whipsaws.
M15 Chart:
XAU/USD 09 May 2025 Intraday AnalysisH4 Analysis:
-> Swing: Bullish.
-> Internal: Bullish.
Analysis and bias remains the same as analysis dated 23 April 2025
Price has now printed a bearish CHoCH according to my analysis yesterday.
Price is now trading within an established internal range.
Intraday Expectation:
Price to trade down to either discount of internal 50% EQ, or H4 demand zone before targeting weak internal high priced at 3,500.200.
Note:
With the Federal Reserve's dovish stance and persisting geopolitical uncertainties, heightened volatility in Gold is expected to continue. Traders should proceed with caution and adjust risk management strategies in this high-volatility environment.
Price could also be driven by President Trump's policies, geopolitical moves and economic decisions which are sparking uncertainty.
H4 Chart:
M15 Analysis:
-> Swing: Bullish.
-> Internal: Bullish.
Analysis and bias remains remains the same as analysis dated 07 May 2025.
As mentioned in yesterday's analysis that I would continue to monitor price and depth of bearish pullback following previous bullish iBOS.
Price did not pull back with any significance, therefore, I will apply discretion and not mark the previous iBOS. I have however marked this in red.
Price continued bullish and subsequently printed a bearish iBOS to indicate, but not confirm bearish pullback phase initiation.
Price is now trading within an established internal range, however, I will continue to monitor depth of pullback.
Intraday Expectation:
Price to trade down to either discount of internal 50% EQ, or M15 supply zones before targeting weak internal high priced at 3,435.055
Note:
With the Federal Reserve maintaining a dovish stance and ongoing geopolitical tensions, volatility in Gold prices is expected to remain elevated. Traders should exercise caution, adjust risk management strategies, and stay prepared for potential price whipsaws in this high-volatility environment.
Trump's tariff announcement will most likely cause considerably increased volatility and whipsaws.
M15 Chart:
XAU/USD 28 April 2025 Intraday AnalysisH4 Analysis:
-> Swing: Bullish.
-> Internal: Bullish.
Analysis and bias remains the same as analysis dated 23 April 2025
Price has now printed a bearish CHoCH according to my analysis yesterday.
Price is now trading within an established internal range.
Intraday Expectation:
Price to trade down to either discount of internal 50% EQ, or H4 demand zone before targeting weak internal high priced at 3,500.200.
Note:
With the Federal Reserve's dovish stance and persisting geopolitical uncertainties, heightened volatility in Gold is expected to continue. Traders should proceed with caution and adjust risk management strategies in this high-volatility environment.
Price could also be driven by President Trump's policies, geopolitical moves and economic decisions which are sparking uncertainty.
H4 Chart:
M15 Analysis:
-> Swing: Bullish.
-> Internal: Bearish.
Analysis and Bias remains the same as analysis dated 24 April 2025.
Price printed as per my note yesterday whereby I mentioned that we should be surprised if price printed a bearish iBOS as all HTF's require a pullback.
Price subsequently printed a bearish iBOS which confirms internal structure.
Intraday Expectation:
Price has traded up to just short of premium of internal 50% EQ where we are seeing a reaction. Price could potentially trade further into premium of 50%, or H4/M15 nested supply zone before targeting weak internal low priced at 3,260.190.
Note:
With the Federal Reserve maintaining a dovish stance and ongoing geopolitical tensions, volatility in Gold prices is expected to remain elevated. Traders should exercise caution, adjust risk management strategies, and stay prepared for potential price whipsaws in this high-volatility environment.
Trump's tariff announcement will most likely cause considerably increased volatility and whipsaws.
M15 Chart:

XAU/USD 28 April - 02 May 2025 Weekly AnalysisWeekly Analysis:
Swing Structure -> Bullish.
Internal Structure -> Bullish.
Analysis and bias remains the same as analysis dated 16 March 2025.
In my analysis dated 27 October 2024 I mentioned (below) that price could potentially print higher-highs in order to reposition CHoCH. This is exactly how price printed. CHoCH positioning has been brought significantly closer to current price action. CHoCH positioning is denoted with a shortened blue dotted horizontal line.
The remainder of my analysis and bias remains the same as analysis dated 09 February 2025.
Price has printed a further bullish iBOS.
Price is currently trading within an internal low and fractal high. CHoCH positioning is denoted with a blue dashed line.
Price Action Analysis:
In my analysis dated 27 October 2024, it was noted that the first sign of a pullback would be a bearish Change of Character (CHoCH), indicated by a blue dotted line. Price's consistent upward momentum had repositioned previous CHoCH much closer to recent price levels as expected for weeks. Current CHoCH positioning is quite a distance away from price, therefore, it would be viable if price continued bullish to reposition ChOCH.
Note:
It is highly unlikely price will "crash" as many analysts are predicting. My view is this is merely a corrective wave of the primary trend.
Given the Federal Reserve's dovish policy stance alongside heightened geopolitical risks, market volatility is likely to remain elevated, influencing intraday price swings.
Price could also be driven by President Trump's policies, geopolitical moves and economic decisions which are sparking uncertainty and potential repricing of Gold.
Weekly Chart:
Daily Analysis:
Swing -> Bullish.
Internal -> Bullish.
Since my last weekly analysis price has printed a
further bullish iBOS.
Price is now trading within an internal low and fractal high.
CHoCH positioning is denoted with a shortened blue horizontal dotted line.
First indication, but not confirmation of bearish pullback phase initiation is for price to print bearish CHoCH.
Note:
With the Fed maintaining a dovish policy stance and the continued rise in geopolitical tensions, we should anticipate elevated market volatility, which may impact both intraday and longer-term price action.
Price could also be driven by President Trump's policies, geopolitical moves and economic decisions which are sparking uncertainty and the repricing of Gold.
Daily Chart:
H4 Analysis:
-> Swing: Bullish.
-> Internal: Bullish.
Analysis and bias remains the same as analysis dated 23 April 2025
Price has now printed a bearish CHoCH according to my analysis yesterday.
Price is now trading within an established internal range.
Intraday Expectation:
Price to trade down to either discount of internal 50% EQ, or H4 demand zone before targeting weak internal high priced at 3,500.200.
Note:
With the Federal Reserve's dovish stance and persisting geopolitical uncertainties, heightened volatility in Gold is expected to continue. Traders should proceed with caution and adjust risk management strategies in this high-volatility environment.
Price could also be driven by President Trump's policies, geopolitical moves and economic decisions which are sparking uncertainty.
H4 Chart:
XAU/USD 09 April 2025 Intraday AnalysisH4 Analysis:
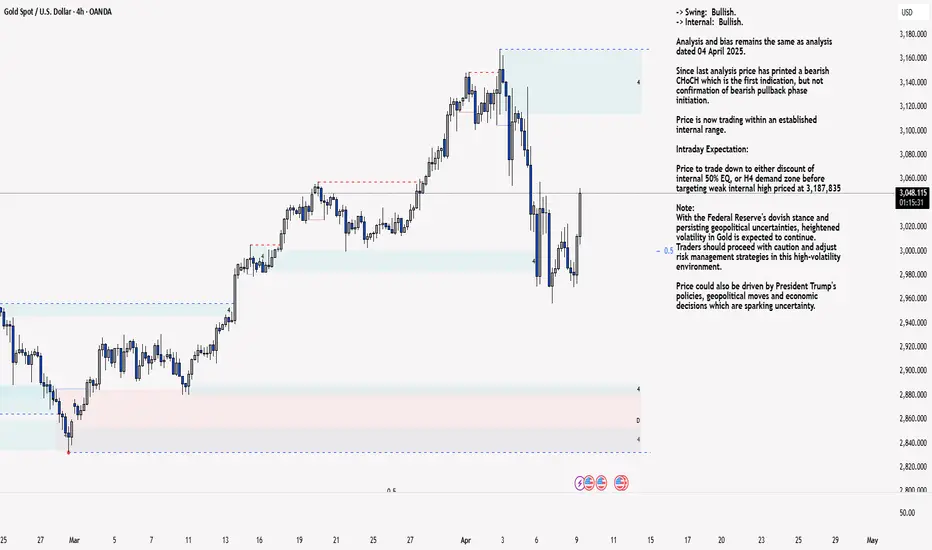
-> Swing: Bullish.
-> Internal: Bullish.
Analysis and bias remains the same as analysis dated 04 April 2025.
Since last analysis price has printed a bearish CHoCH which is the first indication, but not confirmation of bearish pullback phase initiation.
Price is now trading within an established internal range.
Intraday Expectation:
Price to trade down to either discount of internal 50% EQ, or H4 demand zone before targeting weak internal high priced at 3,187,835
Note:
With the Federal Reserve's dovish stance and persisting geopolitical uncertainties, heightened volatility in Gold is expected to continue. Traders should proceed with caution and adjust risk management strategies in this high-volatility environment.
Price could also be driven by President Trump's policies, geopolitical moves and economic decisions which are sparking uncertainty.
H4 Chart:
M15 Analysis:
-> Swing: Bullish.
-> Internal: Bearish.
Analysis and bias remains the same as yesterday's analysis dated 08 April 2025.
However, it would be worthwhile to note that price could potentially print a bullish iBOS as H4 TF has printed a bullish reaction from discount of 50% EQ.
Price has printed as per yesterday's analysis by targeting weak internal low and printing a bearish iBOS.
Price has subsequently printed a bullish CHoCH (I mentioned in yesterday's analysis bullish iBOS in error) indicating bullish phase initiation.
Price is now trading within an established internal range and appears to be stuck in between close supply and demand zones where we could see extended rangebound conditions.
Intraday Expectation:
Price to continue bullish, react at either premium of internal 50% EQ, or M15 supply zone before targeting weak internal low priced at 2,956.565
Note:
With the Federal Reserve maintaining a dovish stance and ongoing geopolitical tensions, volatility in Gold prices is expected to remain elevated. Traders should exercise caution, adjust risk management strategies, and stay prepared for potential price whipsaws in this high-volatility environment.
Trump's tariff announcement will most likely cause considerably increased volatility and whipsaws.
M15 Chart:
XAU/USD 07 April 2025 Intraday AnalysisH4 Analysis:
-> Swing: Bullish.
-> Internal: Bullish.
Analysis and bias remains the same as analysis dated 04 April 2025.
Since last analysis price has printed a bearish CHoCH which is the first indication, but not confirmation of bearish pullback phase initiation.
Price is now trading within an established internal range.
Intraday Expectation:
Price to trade down to either discount of internal 50% EQ, or H4 demand zone before targeting weak internal high priced at 3,187,835
Note:
With the Federal Reserve's dovish stance and persisting geopolitical uncertainties, heightened volatility in Gold is expected to continue. Traders should proceed with caution and adjust risk management strategies in this high-volatility environment.
Price could also be driven by President Trump's policies, geopolitical moves and economic decisions which are sparking uncertainty.
H4 Chart:
M15 Analysis:
-> Swing: Bullish.
-> Internal: Bearish.
Price has printed as per last Friday's analysis by targeting weak internal low and printing a bearish iBOS.
Price has subsequently printed a bullish iBOS indicating bullish phase initiation.
Price is now trading within an established internal range.
Intraday Expectation:
Price to continue bullish, react at either premium of internal 50% EQ, or M15/H4 nested supply zone before targeting weak internal low priced at 2,970.215
Note:
With the Federal Reserve maintaining a dovish stance and ongoing geopolitical tensions, volatility in Gold prices is expected to remain elevated. Traders should exercise caution, adjust risk management strategies, and stay prepared for potential price whipsaws in this high-volatility environment.
Trump's tariff announcement will most likely cause considerably increased volatility and whipsaws.
M15 Chart:

XAU/USD 04 October 2024 Intraday AnalysisH4 Analysis:
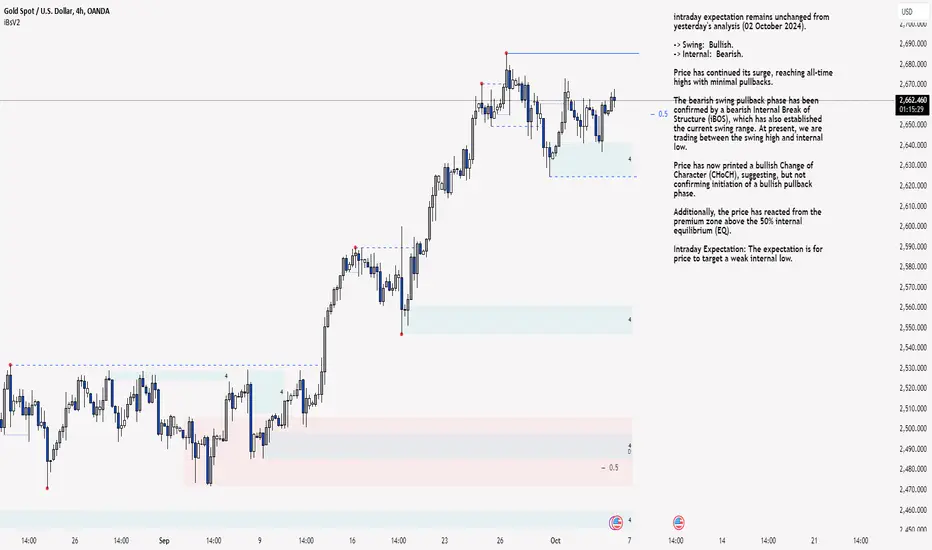
intraday expectation remains unchanged from yesterday's analysis (02 October 2024).
-> Swing: Bullish.
-> Internal: Bearish.
Price has continued its surge, reaching all-time highs with minimal pullbacks.
The bearish swing pullback phase has been confirmed by a bearish Internal Break of Structure (iBOS), which has also established the current swing range. At present, we are trading between the swing high and internal low.
Price has now printed a bullish Change of Character (CHoCH), suggesting, but not confirming initiation of a bullish pullback phase.
Additionally, the price has reacted from the premium zone above the 50% internal equilibrium (EQ).
Intraday Expectation: The expectation is for price to target a weak internal low.
H4 Chart:
M15 Analysis:
-> Swing: Bullish.
-> Internal: Bullish.
Price did not meet yesterday's intraday expectation, as the internal structure flipped from bearish to bullish, with the price printing a bullish Internal Break of Structure (iBOS).
A bearish Change of Character (CHoCH) has been printed, indicating the initiation of a bearish pullback phase, and an internal range has been established.
It is expected that the price will trade down to the premium zone of the 50% internal equilibrium (EQ) or the M15 demand zone.
Intraday Expectation: Technically, the price is expected to target the weak internal high.
Given that the H4 timeframe appears to be in a bearish pullback phase, any bullish momentum is likely to be short-lived.
With rising geopolitical tensions, coupled with a dovish stance from the Fed, Gold is expected to remain highly volatile in the short term.
M15 Chart:
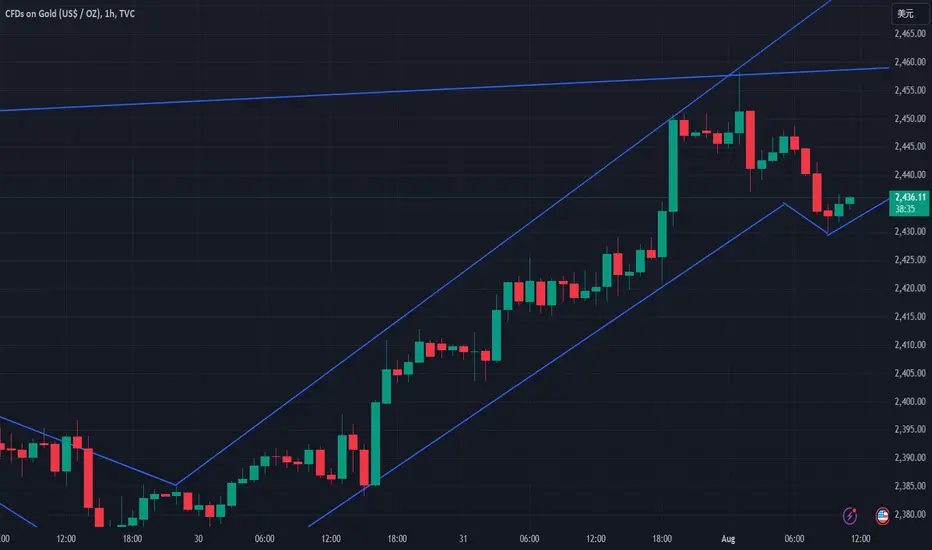
Is NFP non-agricultural data good or bad for gold?At the beginning of the Asian session on August 1, spot gold fluctuated in a narrow range and is currently trading around $2,436/ounce. Gold prices rose by nearly $40 on Wednesday.
The interest rate remained unchanged in yesterday's Federal Reserve meeting, which was in line with market expectations. Powell's speech later gave news of a possible interest rate cut in September and the increasingly tense situation in the Middle East. Gold prices will face new large fluctuations.
The upcoming non-agricultural data will surely attract a large number of gold investors.
Do you think this wave of gold is good or bad?
Welcome everyone to actively discuss
Gold forecast and ideaPlease write any advice or suggestions.
Dear friends, request any cryptocurrency pair, currencies pair for forex, and any index that you want to be analyzed and ask any questions.
Thanks for your attention
