FallingWedge from last idea’s breakout confirmed; 1st trgt=53690I placed the dotted yellow measured move line slightly lower in the previous idea than where we actually broke out as shown here on the current chart and have readjusted the dotted yellow measured move line to the actual point of the breakout giving us a slightly higher measured move target of 53690. We can see here we have closed a large green daily candle above the key resistance of the hyphenated grey horizontal trendline at 51333. The current daily candle is also currently retesting it as support. If we can close 3 consecutive daily candles above this grey hyphenated horizontal trendline I’m confident we can reach 100% of the wedge target. On our way up out of the wedge we also formed a smaller bull flag as well which we have also seemingly just broken up from and that has a measured move target of 56000 so I we continue to rise after reaching the wedge target 56k would be our next target. I must remind you all to that the falling wedge was also doubling as a bull pennant on the weekly chart so it’s also quite possible we could head to the pennant’s target as well eventually which would be around 58k or so (the dotted purple line is the measured move target line for the pennant). Let’s also not forget that we still have a much larger bullflag on the monthly chart that price action is now working on its 3rd consecutive monthly candle above that bullflag meaning it’s likely to confirm the breakout there as well and the measured move for that flag is around 97k. Of course the monthly flag will likely take much longer than the others to reach its target if it does hit 100% of its measured move. For now the strategy is to focus on this hyphenated grey horizontal to maintain support. Now that price action is back above the orange 50ma and blue 200ma, we should sustain this golden cross which if so, will ensure we reach the majority of these targets, if not all of them.
Goldencross

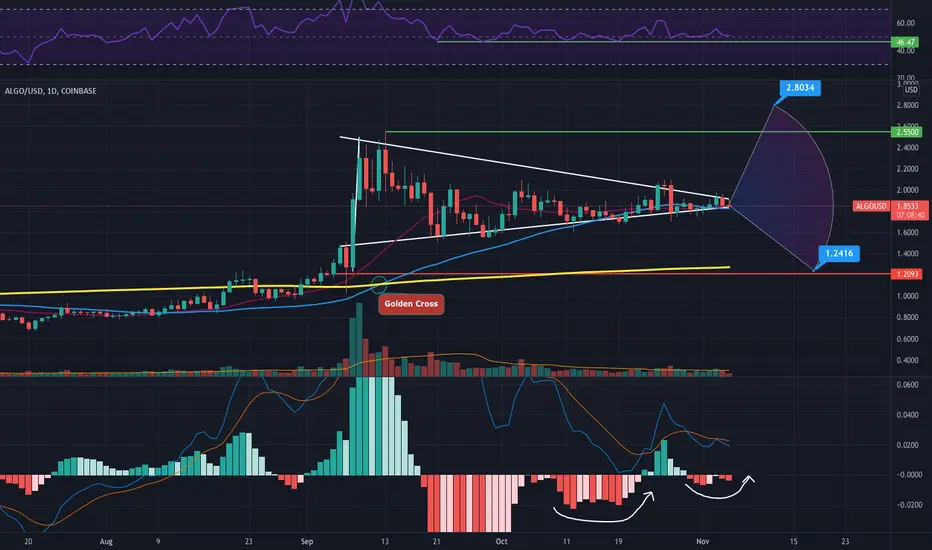
$ALGO Symmetrical TriangleRSI is showing strength maintaining above the 46 level. The 50-day MA passed up through the 200-day MA signifying a Golden Cross.
MACD doesn't look the greatest but does appear to be moving in the right direction.
Scenario A: break-out of the triangle, zoom towards previous ATH, contend with it momentarily and then make new ATH
Scenario B: breakdown out of the triangle, fall towards 200-day MA or previous support.
Which scenario do you think is more likely?
Imagine when ALGO gets the market cap of ADA or SOL... Algorand would be at about $11 if that were the case based on current market caps at the time of this post.
Weekly Chart:
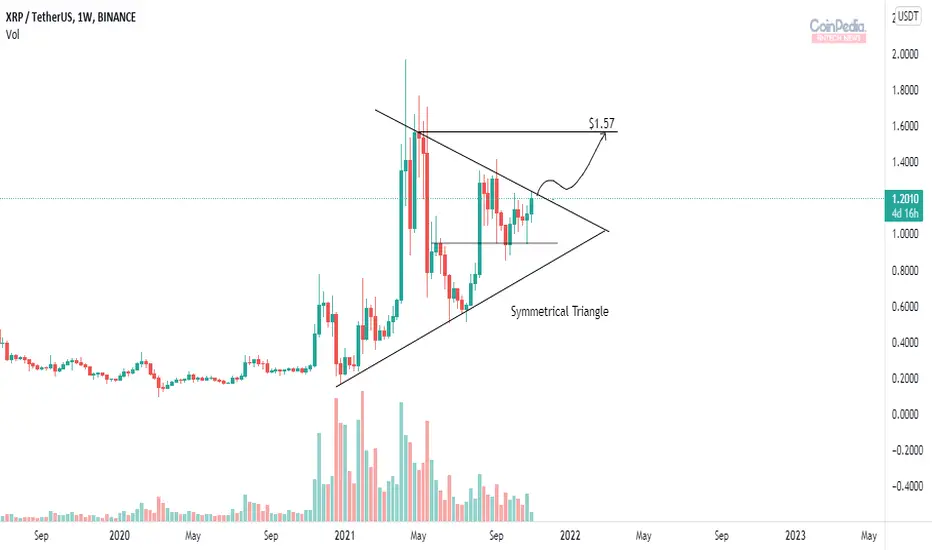
XRP about to pump * XRP in Weekly time frame forms a Symmetrical triangle pattern.
* Symmetrical triangle occurs when the price consolidates between two parallel trendlines slightly sloping towards each other. The price is squeezed until it breaks the pattern.
* After breaking the upper trendline XRP will move towards $1.57.
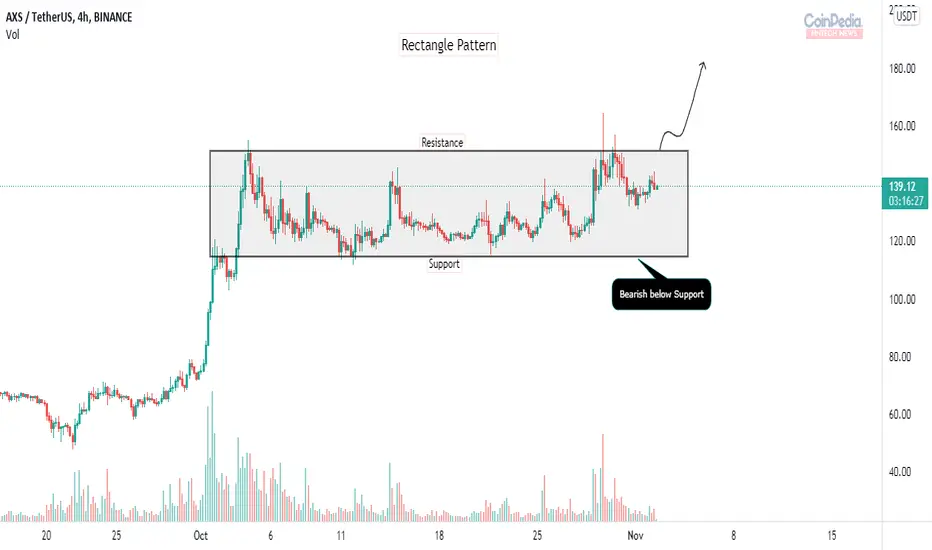
AXS is squeezed in Rectangle Pattern* AXS in 4H time frame is moving in Rectangle pattern
* The price is facing Resistance around $152 and it has support near $114
* Rectangle pattern occurs when the price bonds between two parallel trendlines opposite to each other. Rectangle is a trend continuation pattern.
* To continue the bull run AXS needs to break the above resistance of $152.
2021-10-29 | $NNDM | Golden Cross after Triple BottomOn October 29 2021 NNDM crossed the moving averages on the 3 Month chart to form a Golden Cross. Bullish trend towards Earnings (est. Nov 10 - Nov 15 2021)

Golden Cross in ChainLink* Golden cross appeared in Chainlink daily time frame.
* Golden Cross occurs when the Short term Moving average ( 50 MA ) crosses above the long term Moving average ( 200 MA ), this indicates the long bull rally.

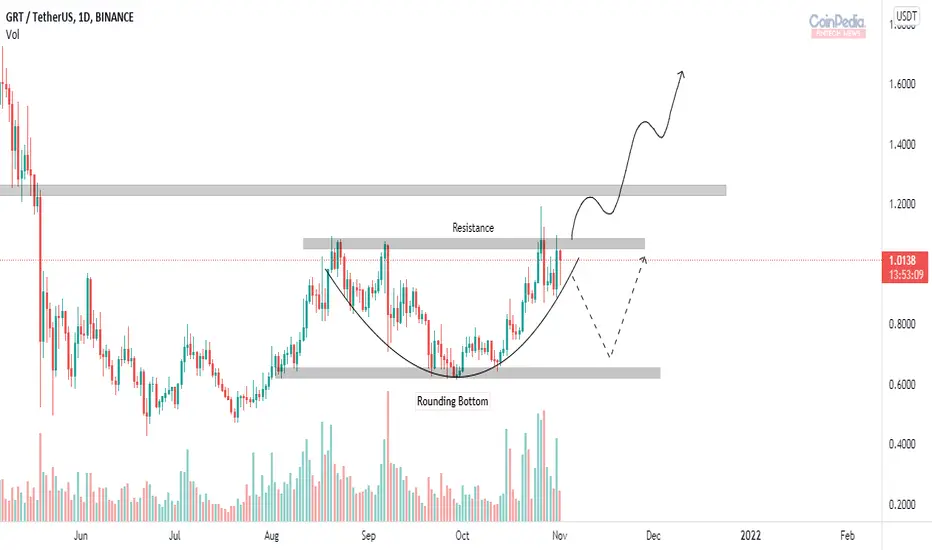
GRT facing resistance* GRTUSDT is consolidating in a range between it's support zone around $0.61 and facing resistance near $1.08.
* If the price breaks the above resistance we can see a bullish trend.
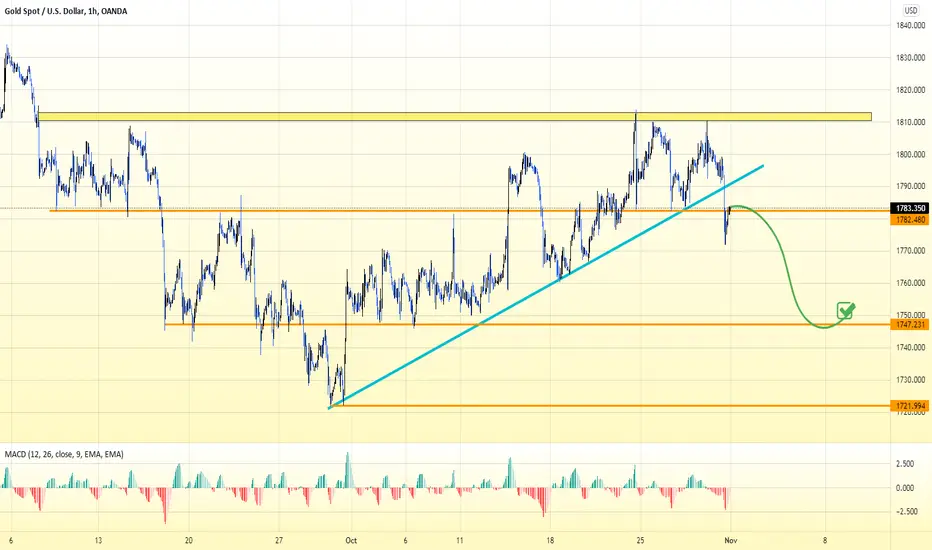
GOLD/ best place for shortThe trend line is broken.
The price of gold can move towards the specified targets.
What is your opinion ?
Explain your opinion to me.
Good luck.
BUY/USDT GOLDEN CROSS It is time for Burency to moon now . Full send. It’s forming a golden cross where the 50 MAcrosses the 200 ma. This is bullish.

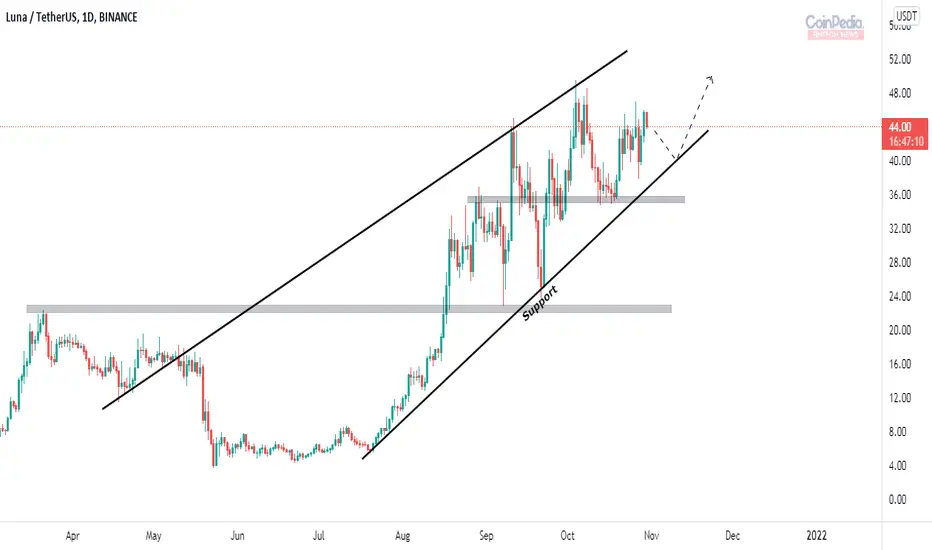
Luna in a Healthy uptrend* Luna is moving in a Channel pattern forming higher highs and higher lows, respecting the below trendline as it's support.
* After testing the below trendline (support) we can expect Luna to bounce back and form a high.
HBAR heading towards it's ATH* HBAR is in proper uptrend with respecting the below trendline as it's support.
* HBAR has a important support around $0.3 and facing resistance around $0.41, if the price breaks the trendline support we can see a drop till $0.3.
* To continue the trend HBAR needs to break above the resistance of $0.41.

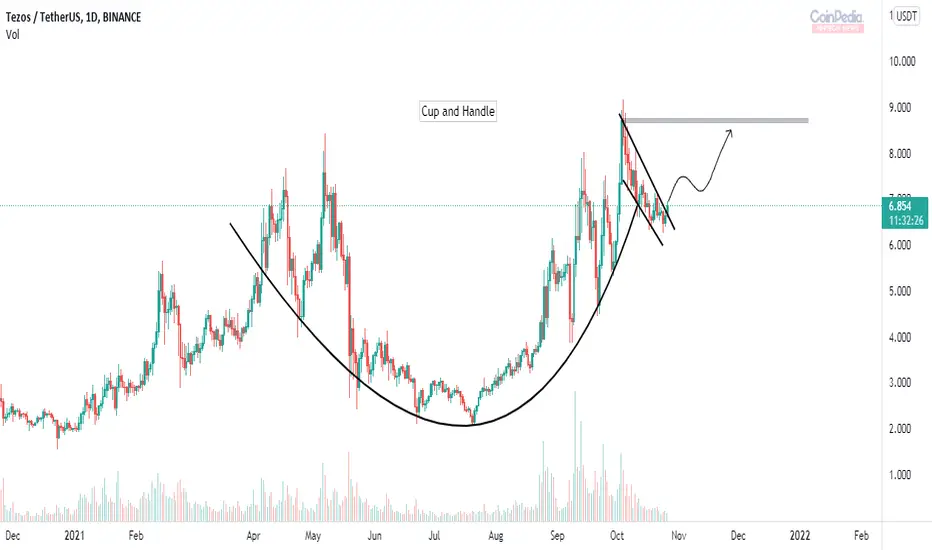
Bullish continuation pattern in Tezos* Tezos in Daily time frame forms a Cup and Handle pattern.
* Cup and Handle is a bullish continuation pattern occurs during the uptrend. To continue the trend price needs to break the handle ( Falling channel like pattern).
* After a proper retest to the breakout level, we can see the continuation of uptrend in Tezos.
Will Shib continue it's uptrend ?* Shib in 1H time frame appears with Ascending triangle, with it's support as below trendline and facing resistance around $0.00004330
* In order to continue the trend Shib needs to break the above resistance.

BUY/USDT BULLISH Burency 50MA has Crossed the 200MA in 4H chart. We are in a clear breakout of triangle. Upcoming news with cloud mining and website/exchange reopening after maintenance with new features, etc.

Corn - reasons why it could be bullishETF Corn is in the middle of a pullback, but is it bullish and due for a trend reversal above 1.30?

Bitcoin surging towards ATH* After a breakout from the Rising Channel Bitcoin created a new ATH and drops back to $60K level to retest the breakout.
* Now the price is bouncing back to it's ATH after a proper retest.

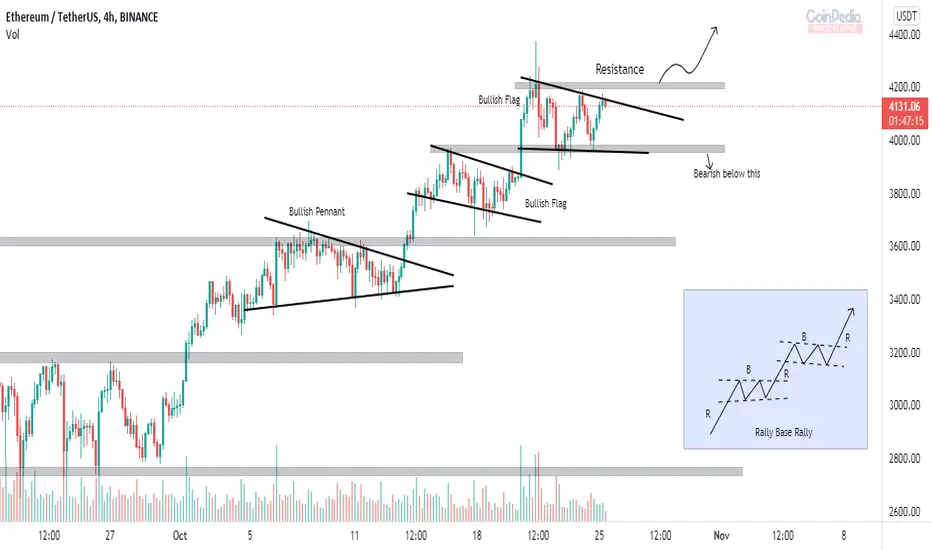
Ethereum in a healthy uptrend* Ethereum is in a healthy uptrend creating Higher-highs and Higher-lows following a pattern called Rally-Base-Rally.
* Ethereum also appears with Bullish Flag a trend continuation pattern.
* In order to continue the Bull run ETH needs break the $4220 resistance.
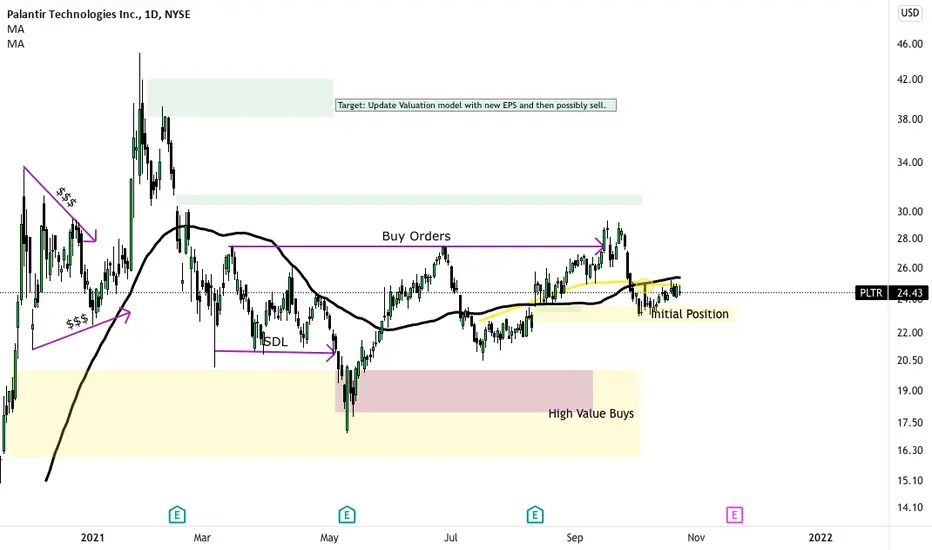
PLTR, the next Generational Company! Time to start DCA!Palantir is the best SaaS company to buy this year, next year and the following years. Right now, the accumulation happening is crucial. The next leg up that will happen (2-4 years) with bring it to 40, an 80% move. A golden cross happened (buy orders taken) so technical analysis is bullish.
My discounted free cash flow model gives me a price target of 38.
What do you guys think of Palantir as a long-term investment?
Feel free to write it below!
BUY/USDT GOLDEN CROSS INCOMINGBurency is on pace to make a golden cross. This is where the 50 MA crosses the 200 MA upward. Very bullish in short-mid term. This will continue to pay you

SAMCHEM (BURSA WK41 2021)Bull trend is on going, each reversal also can be rebound at MA20.
0.92 is the entry point with high volume.
Resistance line 1 & 2 is respectively 0.975 and 1.03, taking profit will be observed if it could break out resistance lines.
MACD and Stochastic also appeared "golden cross" signal.
=============================================================================================================
I am a profitable trader, here is the watch-list for Bursa Malaysia Market.
-TGL Engineered Excellence-

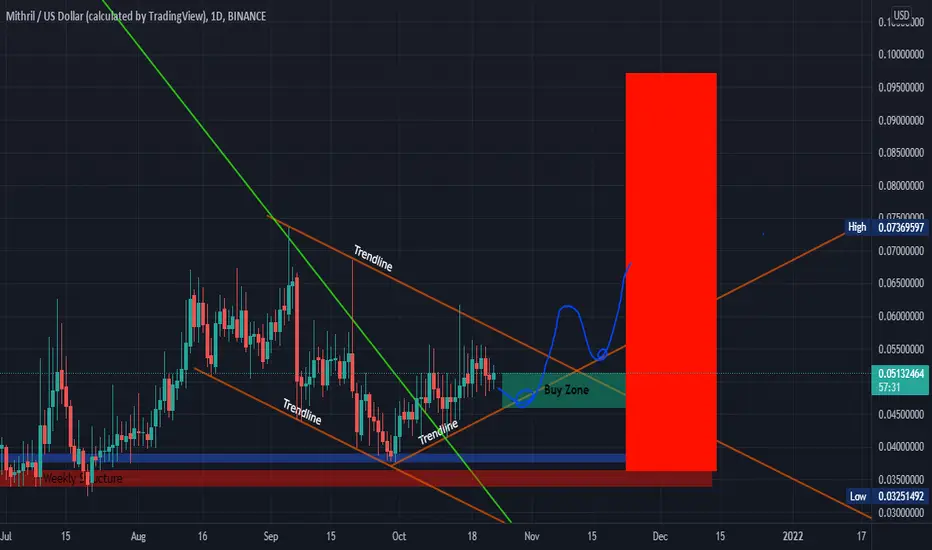
#MITHUSDT #MITH#MITHUSDT
#MITH
#MITHUSDT After Retest Will Fire Buy And Hold 35% to 47% Profit Remember Patient Is Key Of Success
Keep in Mind.
🟣 Purple Structure
Monthly Frame Structure.
🔴 Red Structure
Weekly Frame Structure.
🔵 Blue Structure
Daily Frame Structure.
🟡 Yellow Structure
4H Frame Structure.
⚪️ White Structure
1H Frame Structure.
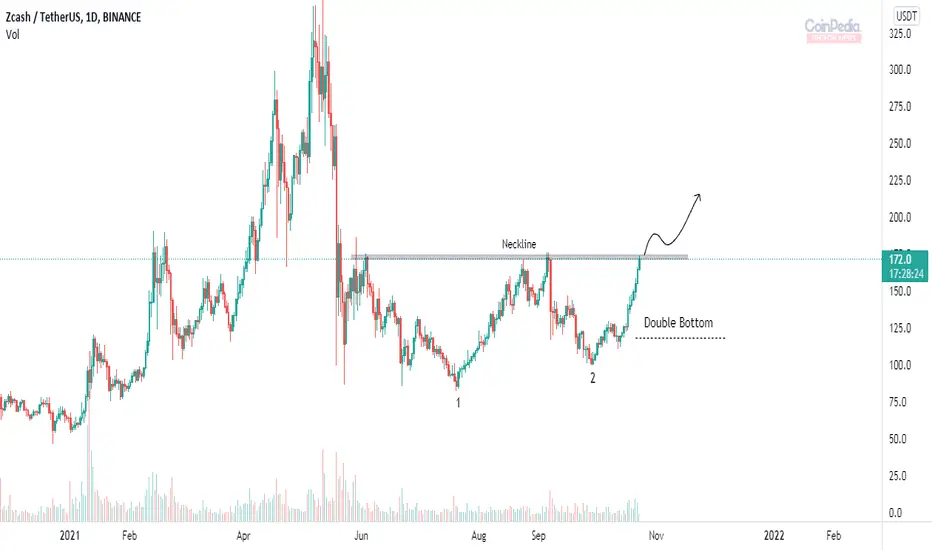
Trend reversal pattern in Zcash* Zcash in Daily time frame appears with Double Bottom pattern
* Double bottom is a trend reversal pattern appears during the down trend and signals that the sellers, who were in control of the price action, are losing momentum.
* If Zcash breaks it's resistance of $176 we can expect bullish momentum in price
BUY/USDT Upcoming Fundamentals, Golden CrossBurency (ticker: BUY , exchange: KUCOIN, SUSHISWAP) has recently tweeted that Cloud mining contracts are loading and that they will be announcing the action soon. The chart currently shows that we are above the 50 MA and the 200 MA was just tested. Although the 200 was not broken through, the price still remains above the 50. There will likely be another retest of 200 and hopefully soon a breakout. If this is the case then we could potentially be seeing an upcoming Golden Cross. This could be a big trade for all.
