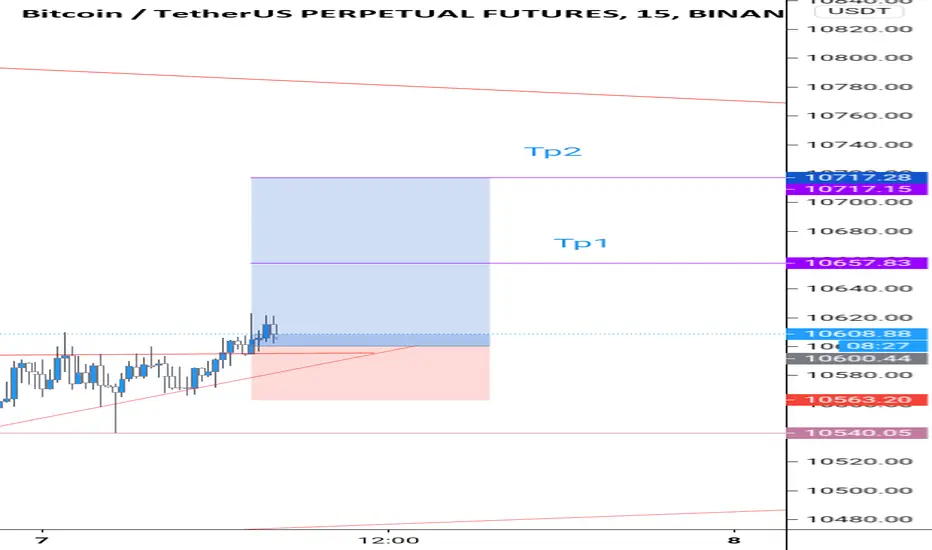
Breaking out of ascending triangle on 15 mins tf After the drop down btc consolidated for a while forming an ascending triangle. It broke out of the ascending triangle upwards , going long on it would not be a bad idea. With tight stop.
Goldencross
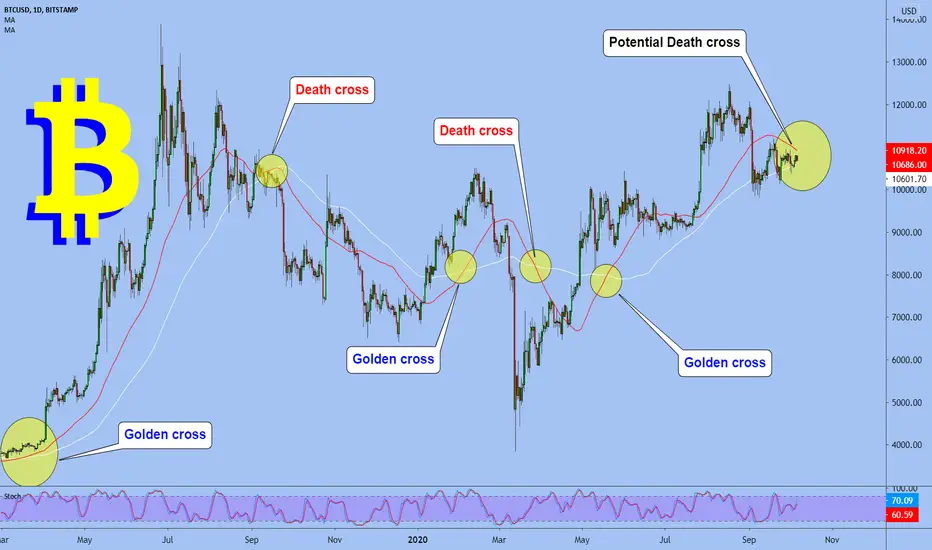
Golden and Death CrossesThe most popular and simplistic way to use moving averages is to divide the market into a bullish or a bearish one based on a cross. Even today, financial newspapers refer to these crosses as being really important and defining for a market. In order to look for a golden or a death cross, a daily timeframe needs to be open on the financial product one is interested in trading. In our case, let’s use the daily chart on the BTC/USD. The next thing to do is to apply two different moving averages on the chart: one that takes into account 100 as a period (MA100), and one that considers 50 as a period (MA50). This means that MA100 is plotting a value based on the values of the last 100 days, while the MA50 one is taking into account only the last 50 days.
The overall idea to interpret a market is quite simple: When the MA50 moves above the MA100, or it makes a cross, this cross is called a golden cross. It means that from that moment on the overall market turned bullish, and so buyers should dominate that market. The opposite is true as well: When the MA50 crosses the MA100 to the downside, the cross that is formed is called a death cross, and signals a bearish environment in the period ahead. The BTC/USD chart below shows both golden and death crosses, as the MA50 (the red line) crosses above or below the MA100 (the white one).
Best regards EXCAVO
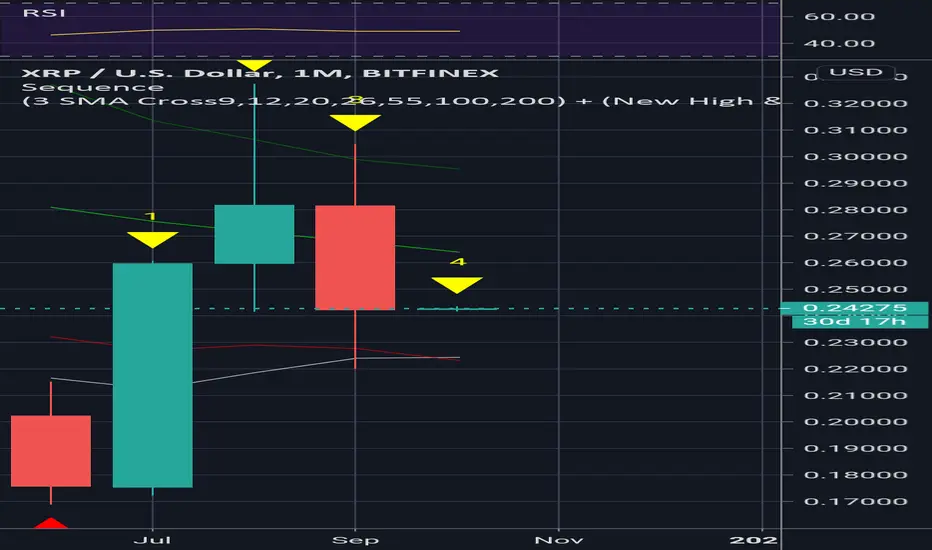
Very big moment In XRP...MOON.. or .. It remain unmoved ?XRP is in a very big pressure to show some pulse of live .
Xrp's "1 Month candles Chart" has shown some light. we just made the golden cross after a very "long long time".
First time after 2018 we are witnessing the "Golden Cross" in "1 month candles" chart.
In past we have seen Golden Cross in daily or weekly chart in XRP "BUT" first time we are witnessing "Golden Cross" in monthly chart.
Very excited moment, this may be the most awaited Reversal For XRP fans.
Lets see whether this golden Cross has any Relevance in Crypto World or not.
GOLD and 200 Exponential moving averageGOLD
On September 24 the price of gold has felled below the 200 Exponential moving average and felled towards 1850.00
The 61.8% Fibonacci retracement level is acted as major resistance level for the Bull. From this level we can expect a minor Head and shoulder pattern the immediate downside target would be 1873.00 which will be a good support level for the bull and low volume area too. On below that POC is ahead at 1860.00 level
My bias is remain towards south. Tell me about your view on GOLD in the comment section
Give a like if u find useful

Gold - Outlook 30 Sept 2020 - Interesting level!!!~~ Hi all traders,
This is a video analysis for gold.
Gold is still making uptrend and we are testing the previous high of it.
Take note of the levels that i have explained to you and hope you trade safe and make some pips from it.
Cheers and thank very much!!
****Follow me on tradingview for more video analysis****
****Like and share this video analysis with all your friends.****

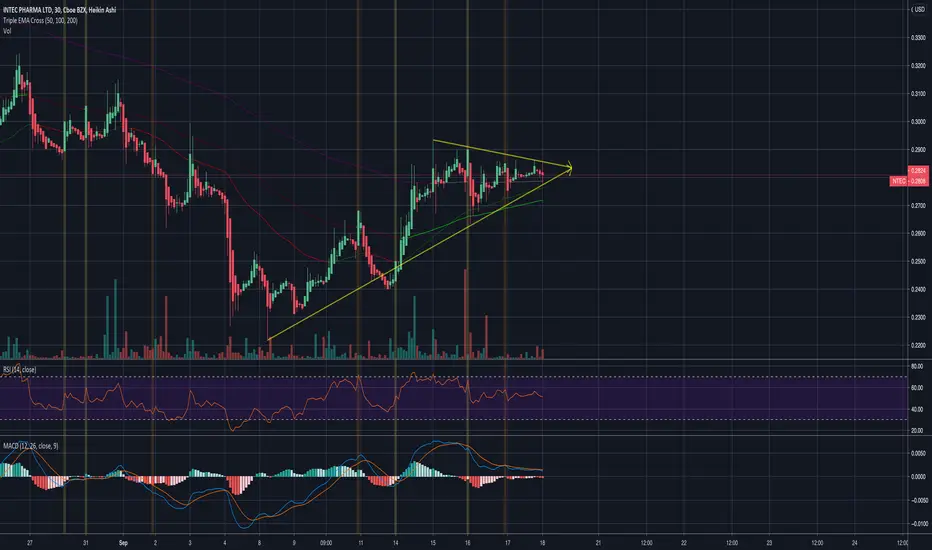
NTEC Golden Cross 30minGolden Cross incoming.
Looking for a 7-13% pop here.
no plans to hold anything past this pop but, I will see where it finds support and determine if it has more room to run up.
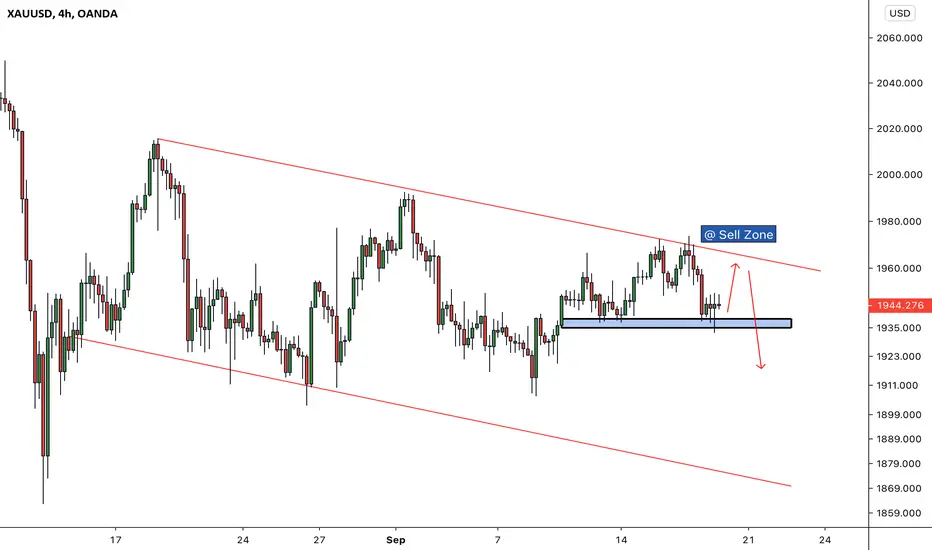
XAUUSD Gold | SWING - 17 Sep. 2020Hello my friend | Welcome Back.
Please support this idea with LIKE if you find it useful.
***
Gold is still on a downward channel and is trying to break the channel, but if it does not break it, of course, it may head towards the downside according to the scenario that you set.
***
Here is the full analysis for this pair, let me know in the comment section below if you have any questions, the entry will be taken only if all rules of the strategies will be satisfied. I suggest you keep this pair on your watchlist and see if the rules of your strategy are satisfied.
Remember this analysis is not 100% accurate No single analysis is To make a decision follow your own thoughts.
***
The information given is not a Financial Advice.
BTCUSD Apple GBPUSD EURUSD XAUUSD AUDUSD
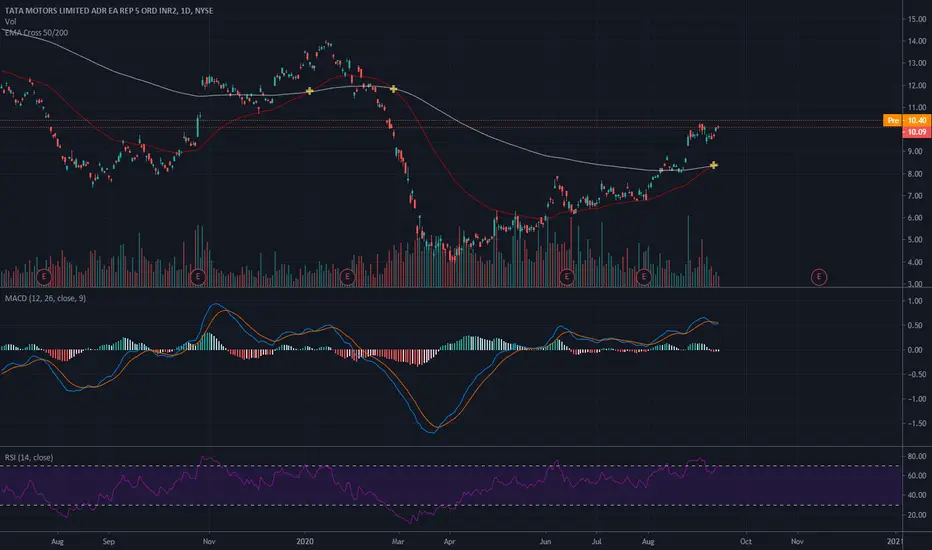
Golden cross on Daily chart TTMDue to the news and the movement of the market we found another gem.
But in order to make sure its a good one will have to give in and wait for today and see whether or not this is a fast small run followed by massive selling.
Thanks for coming by and leave a like if you liked it.
SPX Golden Cross Percentage Gain, we r #10 of 11 low ranking !if we are in for a bull run we have more than anyone would wish for :-)
if this is a top, then it would be the second wort Golden Cross bull market.
wish you all the best.

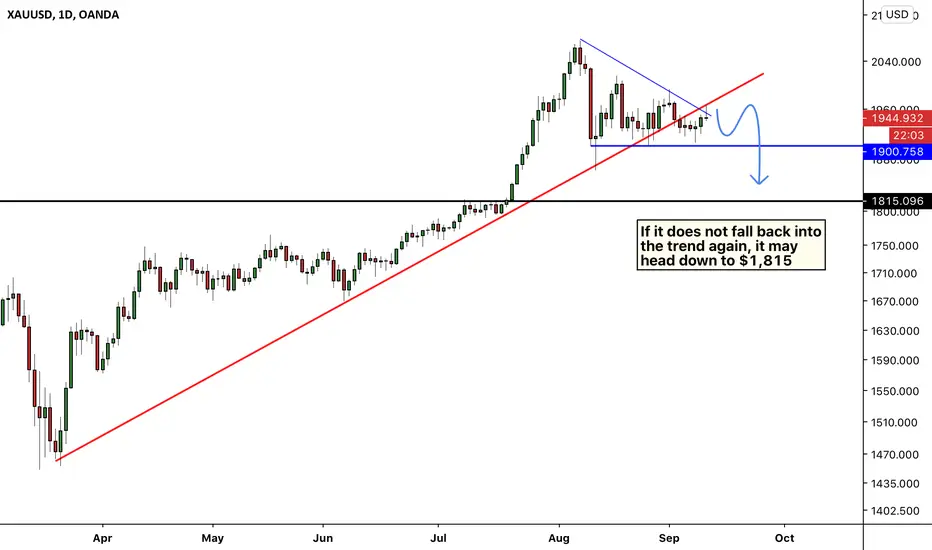
XAUUSD Gold | SWING - 10. Sep. 2020Hello my friend | Welcome Back.
Please support this idea with LIKE if you find it useful.
***
If it does not fall back into the trend again, it may head down to $ 1,815
***
Here is the full analysis for this pair, let me know in the comment section below if you have any questions, the entry will be taken only if all rules of the strategies will be satisfied. I suggest you keep this pair on your watchlist and see if the rules of your strategy are satisfied.
Remember this analysis is not 100% accurate No single analysis is To make a decision follow your own thoughts.
***
The information given is not a Financial Advice.
BTCUSD Apple GBPUSD EURUSD XAUUSD AUDUSD

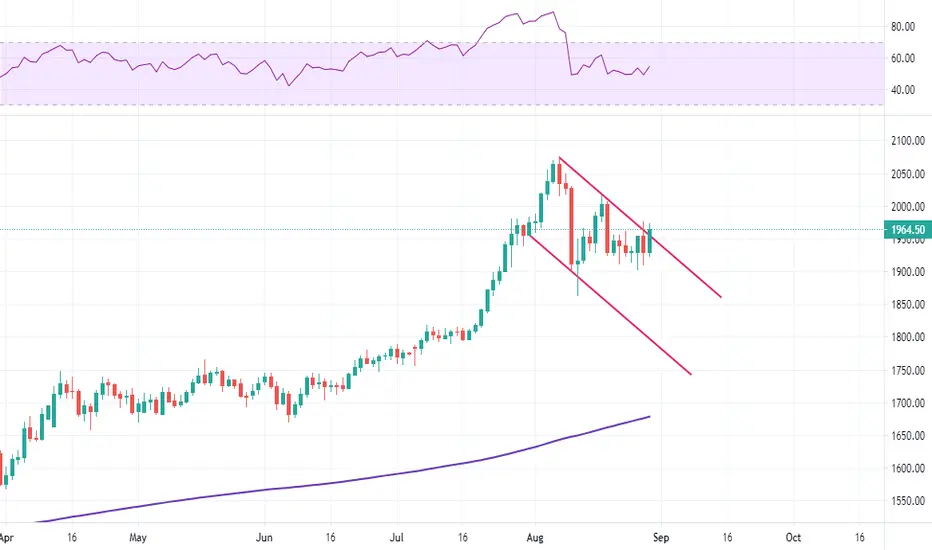
Gold - descending triangleHi all traders,
Im currently viewing gold as a possible descending triangle.
If the support is broken, we should see further downside of gold.
Any break of the trend line will only signal a possibility of a range bound gold first. I wouldn't assume the break of trend line would be the bulls taking over and making higher highs.
Follow me on tradingview
Like and share this post with your friends
**Disclaimer: all trade ideas are of my own personal views.**
Cheers and thank you everyone!

IYT Transport Golden cross continuation in septemberIYT Transport Golden cross on Aug 21, looking for continuation. You can see the accumulation candles in the chart. The top 4 holdings are FDX, UNP, NSC and KSU, which make up over 40% of ETF. Using seasonality charts, IYT in sept is up 2.5% the past 4 years.

GOLD : ECONOMY Fed changes could send $ 1700 backOANDA:XAUUSD ANALYSIS FUNDAMENTAL & TECHNICAL
Gold had a 2% drop in the week we had, the changes given by the Fed were quite optimistic about raising it to a price above $ 2060 but that the economic crisis seems to hit and gold sometimes.
If we were to look at the daily structure we would see a trendline support and a resistance while we managed to continue breaking it I think that "NFP" "EMPLOYMENT" & "UNEMPLOYMENT" that were published these days for the month of August had a bearish target for gold and a positive rise for the dollar index I think we can look beyond $ 1900 and $ 1800 if it can touch a $ 1750 retest if it were possible.
We are caught from the economic (fundamental) point of view, the purchase of gold continues in large numbers as investors see it as quite stable, inflation in America increased while we look at bearish structures, why does this happen?
We already know that in a local currency versus a quota currency, or otherwise (Basic currency in exchange for quota currency) we will see that if the base currency increases the quota currency decreases and we need to buy, as the quota currency depreciates, I believe this is something right.
if we look at the positions we will see that 70% of traders are selling the base currency while 30% are buying the base currency, the larger volume lies in the minority of what we are trading.
This is also the case with gold if banks are selling so much and investors want to buy so much the price increase would be a drastic loss in terms of sellers (Banks in question) so they will look for a more stable price where they can buy again and can sell at a more affordable price
In the comments below I will publish the gold analysis in 4 different timeframes (30M / 1H / 2H / 4H)
I hope you are also a follower of the comments where we can share ideas

Golden Cross example on $KO with angular breakout from triangle A nice golden cross and triangle breakout on #KO - possible safety play during market pull back

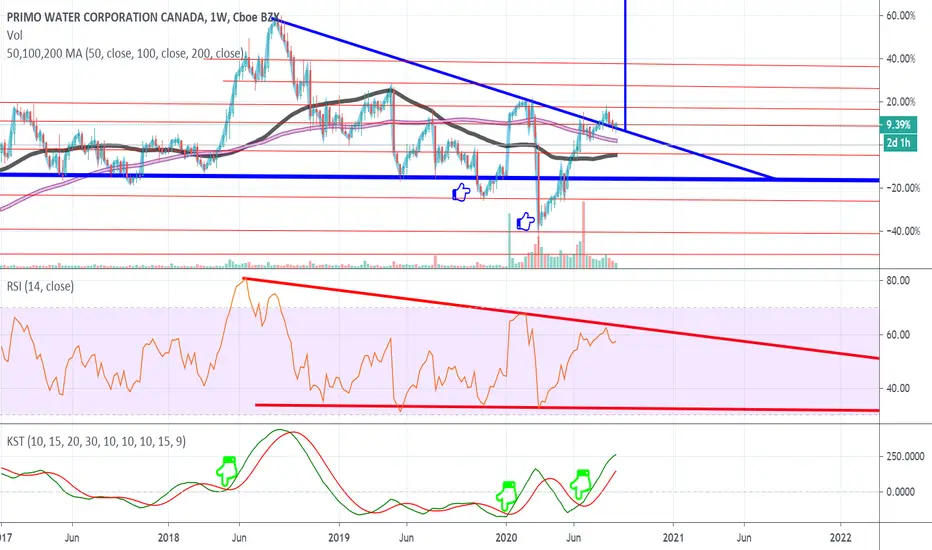
Bullish Flag breakout for PRMW?The KST has seen some very healthy bullish crosses, I've placed three green finger icons to represent each golden cross.
It's always possible we see a fake-out to the upside similar to the fake-outs to the downside where I have placed the two sideways blue icons underneath the baseline support of the pattern.
On the RSI it's possible we see a retest of the downward red sloping resistance of either a descending triangle or bullish flag, if we get a retest and rejected the bottom of the pattern is going to need to hold for the bullish flag to stay in play.
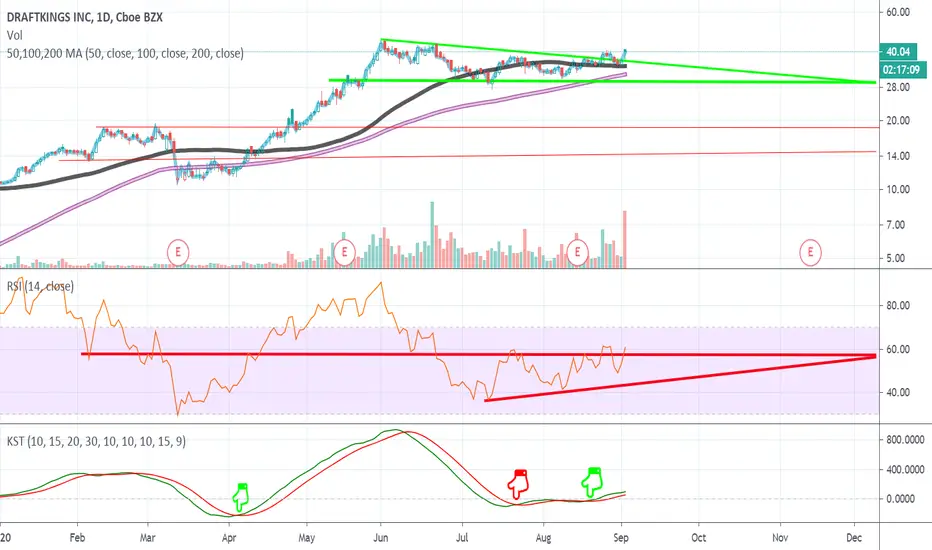
Bullish Flag breakout for DKNG??It appears as though DKNG is breaking out of a bull flag, very interesting bullish cross on the KST.
The first green finger on the KST back in April is what we want to see happen again, not like the red finger icon in July which basically resulted in choppy trading.
Higher lows on the RSI and it's looking like a higher high is going to occur in the near term.
Overall a few bullish indicators, add to the fact Michael Jordan Joins DraftKings as a Special Advisor to the Board and there's sentiment for upside price action.
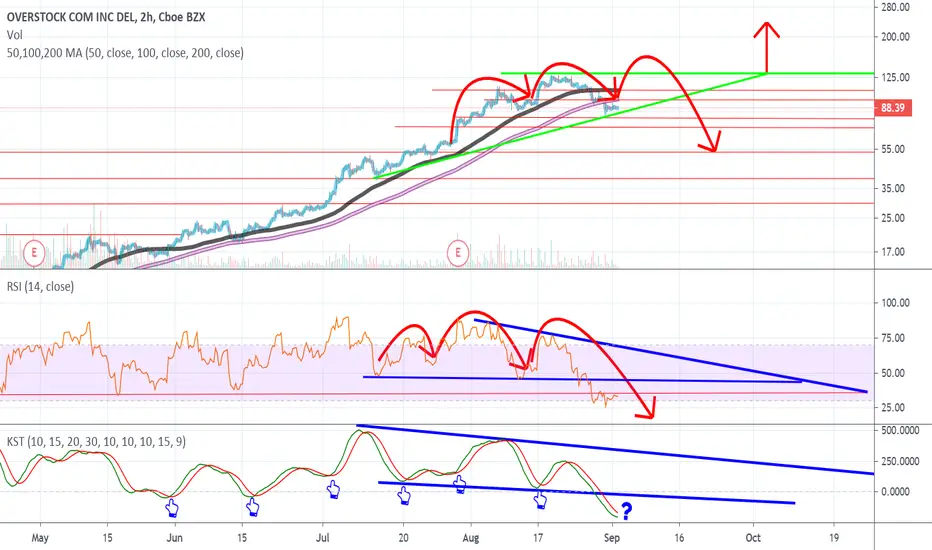
Potentially an Ascending Triangle forming for OSTK?It appears as though a Head and Shoulders on the RSI & KST has already played out to the downside, notice the blue Descending Triangle with the red colored lines representing the H&S on the RSI.
Investors should acknowledge that the previous CEO of Overstock was great friends with Warren Buffett and spoke with him privately before departing the company.
I find no coincidence that Bank of America is now involved with book running a financing regarding OSTK, interesting.
Buffett recently ventured into Gold by buying shares in Barrick Gold, "if" Buffett was going to buy anything crypto related I would imagine Overstock is of interest. Buffett sold basically all his bank stocks except Bank of America, interestingly Buffett bought more Bank of America.
tZERO said Hong Kong-based private equity firm GoldenSand Capital (formerly known as GSR Capital) has bought a 5 Million stake in the company earlier in the year, I mentioned before I wouldn't be surprised If Chinese investors are supporting this stock heavily now, especially since China is rolling out their new digital currency.
It would make sense given the parabolic rise in the OSTK since the announcement and chart I've linked to this chart.
Nothing wrong with a little speculation.
Back to the chart, if we get a bounce off the green upward sloping support and the price gets rejected at the horizontal green line of the potential Ascending Triangle, the RSI is likely get back into what was a descending triangle and could potentially top out at the downward sloping resistance of the blue pattern in the RSI. Or, It's possible OSTK could get back into the blue pattern on the RSI and create a support at the base of the pattern to then look for some higher high creation.
We've possibly seen a blow off top that will end in a bearish H&S pattern that has already played out on multiple indicators. Interestingly, the price has not formed the right shoulder yet, I have placed three coinciding red lines to represent the potential H&S.
Or, OSTK simply has seen a healthy correction back to the public offering price of $84.50 per share, and now we're going to continue the parabolic uptrend?
It's possible we see a Golden Cross on the KST this week, I've placed a question mark icon to represent where a potential golden cross may occur, if the green line crosses the red to upside similar to previous examples on the chart where I have placed blue fingers pointing upward OSTK would start looking very bullish.
NBCC INDIA - Gearing upCMP 27
After a long consolidation around the 22-25 the stock broke out with good volumes.
Above 28.5 there is a gain of 17.5% at least in the making.
Also this would be supported by the Golden Cross which is expected to happen in the coming weeks.
*****
Help Me to Help Us.
I believe in keeping the chart simple with minimal drawings & easy to interpret.
So kindly express any disagreement & improvements so that we learn & earn together.
Please support the effort and appreciate it with a Like if you felt it deserves it and Following me would only add on to the motivation.

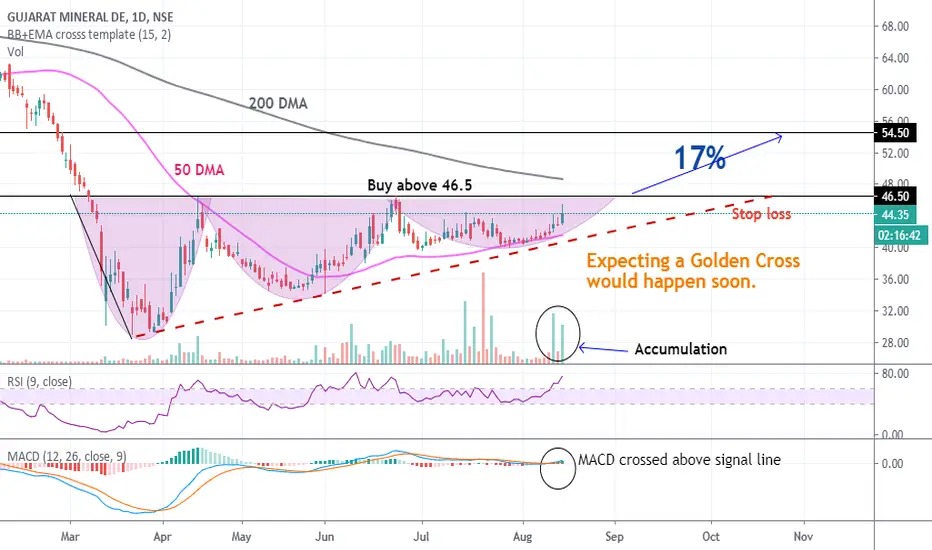
GMDC - RevisedCMP 44.2
The last time I drew my lines, I had disregarded the low on 1st June of 34.2 due to which my stop loss was hit.
The revised base line in the Ascending Triangle shows that the support was was actually not breached. However, Stop loss is our best friend at nervous points. Falling is alright but to be a winner one should accept the mistake and move on with a learning.
MACD is positive at the moment with a bullish crossover.
Now , we can also see that a Golden Cross looks very likely in the coming days which would only add on to its momentum.
Fundamentally also the stock is strong.
*****
Help Me to Help Us.
I believe in keeping the chart simple with minimal drawings & easy to interpret.
So kindly express any disagreement & improvements so that we learn & earn together.
Please support the effort and appreciate it with a Like if you felt it deserves it and Following me would only add on to the motivation.
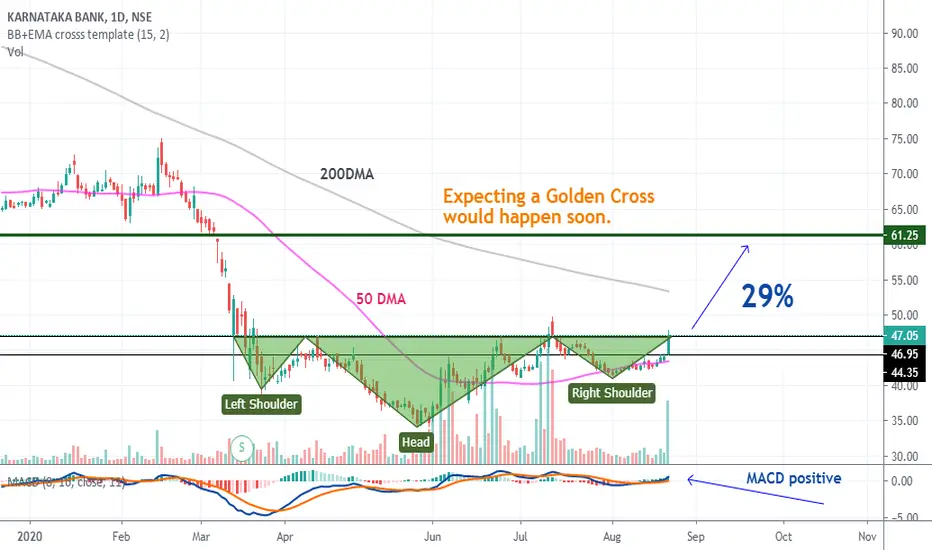
KARNATAKA BANK - Looks attractiveCMP 47
Chart is self explanatory. Price is above all leading MA except 200 DMA.
Breakout is expected soon from a inverted Head and Shoulder Pattern.
MACD is positive too.
Keep an SL at 44
*****
Help Me to Help Us.
I believe in keeping the chart simple with minimal drawings & easy to interpret.
So kindly express any disagreement & improvements so that we learn & earn together.
Please support the effort and appreciate it with a Like if you felt it deserves it and Following me would only add on to the motivation.
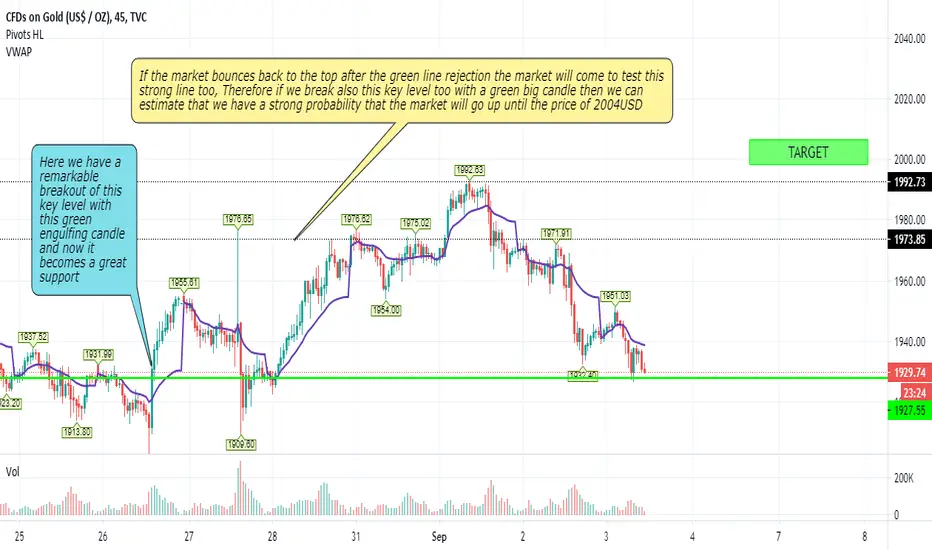
gold - upwards moveHi all traders,
For gold, im still expecting a move upwards
But we need 2002 level to be broken above first to confirm the further upwards
though we have a break out of the channel, we should be more buy biased and buy on every dip if possible.
Cheers!