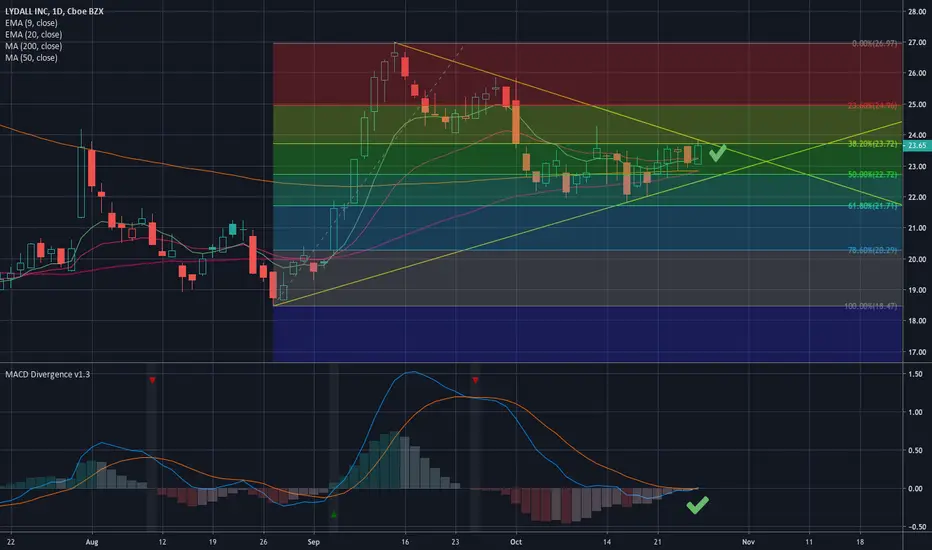
LDL LongPotential golden cross this week and also the 9 ema x the 20 ema on the daily looking for new highs. 1st target $27 2nd $31.71
Goldencross
The Bearish Period of Falling TrianglesWe should admit that the bears yet have full control on BTC now and until we again see the golden cross, they will have. However, despite bear-dominant market, we expect to see gradual falls over time which indicate a healthy downward accumulation for the upcoming bullish trend.
We will see two or three triangles more until the golden cross I assume. Each triangle will be smaller compared to previous one until the market reaches golden cross area.
Let's look at triangles closer:
Triangle-1 (T1): Takes 47 days until the next big fall. The first messenger of the bear market. First harsh fall.
Triangle-2 (T2): Will take app. 50-52 days until the next big fall. The mid-period of bearish trend.
Triangle-3 (T3): Will take app. 40-45 days until the next smaller fall. The first messenger of the end of bearish trend.
Triangle-4 (T4): Will last 30-33 days until the End of Bearish Trend at the mid-Feb where MA200 exceeds MA50 which indicates a Golden Cross.
this is the hint ladies & gentlemens; monitor the momentum of the falling movements closely in order to forecast until which level it will fall.
if there are continuous - densely sharp falls, this means the btc price will reach its minimal at 5,5-6k's. However, if there is gradual decrease over time that we see nowadays, bearish trend might even end up at 4k's.
So, before taking long position, wait at least until price touches under 6.500 $.
***This information is not a recommendation to buy or sell. It is to be used for educational purposes only.***

Golden Cross on XLYThis setup has been a long time coming. The chart has been bullish ever since the Imperial Brands deal. The golden cross (of the 200MA/50MA) is a very strong indicator of bullishness. Given that this stock really didn't rally as much as it could have on the back of the IB deal, I expect this, plus any minor catalysts in the short term could send this stock on a run. Watching $1.00, $1.20 and $1.50 as targets.

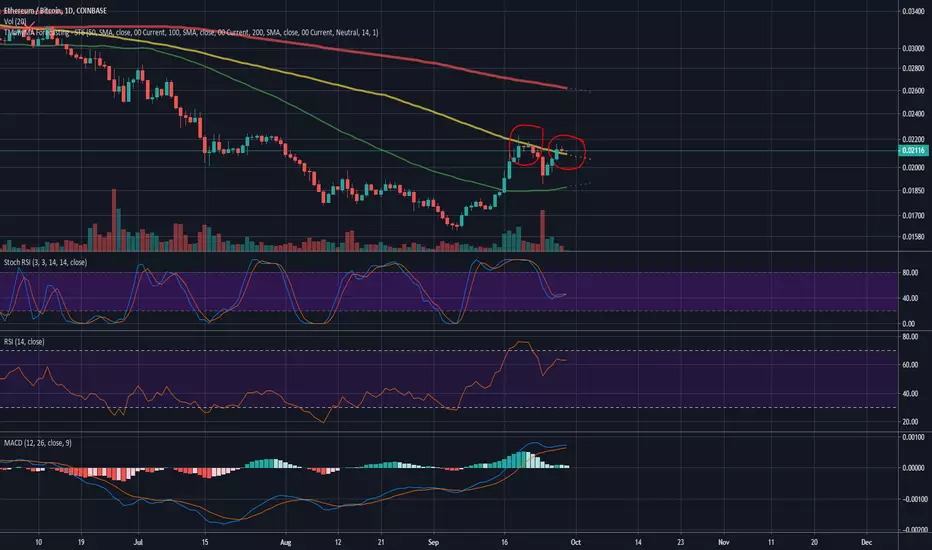
ETHBTC - Hoping to form new supportCOINBASE:ETHBTC has been looking pretty strong lately. On the weekly chart it appears to be one of the leading altcoins (as expected) in trading vs. BTC. The weekly chart has several indicators now trending towards bullish bias. The daily chart that I'm highlighting however is not as clear at this moment. I've circled two areas of interest on the price chart. The first is the first test of the 100 day moving average which was denied. The second area is where that same 100 day moving average was broken, and is now holding as support for the time being.
The unclear indicators on the chart are the MACD hovering above 0 having already made a bullish run, and the Stochastic RSI stuck in the middle of the range. RSI itself still shows fairly bullish.
Personally, I feel like averaging in on ETH. Granted, I already have been averaging in due to the weekly chart, this potential new support on the 100 day, if it can hold can produce a run at the 200 day which is substantially higher.
DISCLAIMER: For educational and entertainment purposes only. Nothing in this content should be interpreted as financial advice or a recommendation to buy or sell any sort of security or investment including all types of crypto. DYOR, TYOB.
XRP trying to break the 99 daily MAXRP trying to break the 99 daily MA, there might be a golden cross forming also.
Long Term BTC trend analysis Hello everyone, my name is CombJelliesAreCool, lets get to brass tacks.
Lets start off with the red and green curves i have surrounding the entirety of the price action for BTC, i started off with the first high and low back in Oct 2010 and connected the green curve with every subsequent rally high and connected my red curve with every subsequent rally low. Doing this, its clear to see that touching either of these curves is a trustworthy indicator for the end or beginning of a sustained uptrend. Due to the inherent volatility of the bitcoin market, its entirely possible for a downtrend to occur inside of an uptrend of vice versa. However, if your uptrend doesn't touch the green curve or the downtrend doesn't touch the red curve then the trend has not completed. This indicator has played out without fail for almost 10 years now and can be seen in action with the rallies of 2011 and 2013 and the down trends of 2014 through early 2015 and i posit for the downtrend of 2018 through the rest of 2019.
On this indicator i took my inspiration from @MagicPoopCannon but I came to a different conclusion on the shape of the curves, he posits that as time goes on the price of bitcoin will eventually stabilize, although I agree with him that price action will eventually stabilize as the market gets saturated, I highly doubt stability is coming anywhere in the near future with the increasing adoption and exponential amounts more money that's coming into the market so my bands increase in width as time goes on as opposed to decreases.
Lets move on to the SMA cross, it looks like there's an impending deathcross on the horizon coming to confirm this downtrend we've been in for two months, with this harsh of a downtrend in the past week I assume its coming sooner than later, especially looking at the shape of the 50 SMA up close.
Now for the NVT analysis, I noticed that the shape of the nvt during late 2012 through mid way 2014 has a lot of confluence with the NVT of mid 2017 through now. I first noticed that a new end of the downtrend wasnt confirmed until the NVT for a green oversold signal, one that we didnt have, even during out catastrophic drop in Nov 2018. If you look at the red lines you can see that the shapes of the NVT are basically symmetrical. You see a gradual rise into a steep rise followed by a monster of a dropoff, boom, green oversold signal, a gradual rise and plateau followed by yet another steep rise and another, albeit ever so slightly less of a dropoff than the previous, this takes us into the mid 70s of the NVT, we plateua, chop for a couple months than a decent uptrend and a very gradual drop off of the third red peak of the NVT, and finally our second green on the NVT since out first red peak and a touch of the red curve to signify the end of the downtrend. A majority of this trend is confirmed including the steepness of the angles and the timing of the plateaus in the trend. I would assume this would indeed be the case if we had good NVT data for our very first bull and bear cycle.
If this fractal plays proportionally our eventual low will likely be the high 2000s or low 3000s and our rally high in 2023 will be around 250000 - 300000 dollars per BTC. Shes going down boys.
Thank you for reading, Im open to ideas and criticisms.

Bitcoin Cash - Buy when it's cheap and sell when it's high.Hi friends, looking at the chart Bitcoin Cash price was playing in the range between two horizontal lines. And recently in med-term (4H timeframe I mean), it drew Falling wedge, and broke up finally.
So what can we do at current minor signal of altseason?
Binance coin finally got golden cross (50EMA, 200EMA). and the price is at the support line I think.
And why I think it's cheap, is my RSI pivot support/resistance line says it's oversold, and SToch also oversold.
Enjoy the trading with strict risk management.
Please press like button if my analysis is helpful.
Thank you guys!
BTC 4hr 9-12-19Well we have risen back up and topped out right at the 50 and 200 MA on this chart. Its pretty evident that these MA's are providing resistance for the time being. With them being so close to each other to the point where they are almost merged I would consider this area to be tough resistance. Much tougher than one single MA alone. Anyways we had a golden cross on this chart recently, but we had a death cross on the 1 hr and it looks to me as if this golden cross will be negated very soon. If we go up that wont be the case though. RSI isnt telling us too terribly much. IMO it could go either way if you are only paying attention to RSI. We are in the 4hr cloud as well which could mean we move sideways a bit. Right now BTC has a roof over its head that it needs to break through if we want to see higher highs. I dont think we see the higher highs til towards the end of the month... But WTFDIK?

1day candle closes inside bullpennant; 4hr goldencross .Bear trapped confirmed as the 1 day candle that dipped down ad filled the 10.1k gap last night bounced all the way back up to close inside the bull pennant as I was expecting. We also hav a 4hr golden cross due to occur in the next 4-8 hours which I think will instigate a bullish breakout from this pennant.
BTCUSD (4h): Multitude of Bullish signals triggered
Green "B": from PRISM Signals (my Buy/Sell strategy script based on pSAR-based oscillator set, with its own modified-RSI/StochRSI and Momentum/Acceleration/Jerk oscillator)
Large Green "BUY" signal: Generated from LIVIDITIUM V4 (bundled set-of-indicators script based on price interaction with dynamic levels constructed based on mathematical conjugation of the quadratic solutions of the golden ration equation, vs. historical trends for BTC; coupled with other tests).
Cyan "GX": 50/15 candles Golden Gross! -- from LIVIDITIUM V4
RED "GX": 200/50 candles Golden Gross! -- from LIVIDITIUM V4
Green "Bull Pivot Signal: -- from LIVIDITIUM V4 (Secret Sauce)
Green "Rev?" Signal: -- from LIVIDITIUM V4 (Secret Sauce)
(Waiting for confirmation on the 1D chart)
~ * ~ * ~ * ~ * ~ * ~ * ~ * ~ * ~ * ~ * ~ * ~ * ~ * ~ * ~ * ~ * ~ * ~ * ~ * ~ * ~
Note:
In no way is this intended as a financial/investment/trading advice. You are responsible for your own investment decisions and trades.
Please exercise your own judgement for your own trades base on your own risk-aversion level and goals as an investor or a trader. The use of OTHER indicators and analysis in conjunction (tailored to your own style of investing/trading) will help improve confidence of your analysis, for you to determine your own trade decisions.
~ * ~ * ~ * ~ * ~ * ~ * ~ * ~ * ~ * ~ * ~ * ~ * ~ * ~ * ~ * ~ * ~ * ~ * ~ * ~ * ~
Please check out my other indicators sets and series, e.g.
LIVIDITIUM (dynamic levels),
AEONDRIFT (multi-levels standard deviation bands),
FUSIONGAPS (MA based oscillators),
MAJESTIC (Momentum/Acceleration/Jerk Oscillators),
PRISM (pSAR based oscillator, with RSI/StochRSI as well as Momentum/Acceleration/Jerk indicators),
PDF (parabolic SAR /w HighLow Trends Indicator/Bar-color-marking + Dynamic Fib Retrace and Extension Level)
and more to come.
Constructive feedback and suggestions are welcome.
If you like any of my set of indicators, and it has benefited you in some ways, please consider tipping a little to my HRT fund. =D
cybernetwork @ EOS
37DzRVwodp5UZBYjCKvVoZ5bDdDqhr7798 @ BTC
MPr8Zhmpsx2uh3F5R4WD98MRJJpwuLBhA3 @ LTC
1Je6c1vvSCW7V2vA6RYDt6CEvqGYgT44F4 @ BCH
AS259bXGthuj4VZ1QPzD39W3ut4fQV5giC @ NEO
rDonew8fRDkZFv7dZYe5w3L1vJSE51zFAx @ Ripple XRP
0xc0161d27201914FC0bAe5e350a193c8658fc4742 @ ETH
GAX6UDAJ52OGZW4FVVG3WLGIOJLGG2C7CTO5ZDUK2P6M6QMYBJMSJTDL @ Stellar XLM
xrb_16s8cj8eoangfa96shsnkir3wctdzy76ajui4zexek6xmqssweu85rdjxrt4 @ Nano
~ JuniAiko
(=^~^=)v~

btc golden cross i posted a chart earlier an it was on the daily im redoing this one so here it goes...So as you can see the 50 an the 200 day ma have crossed giving us a golden cross!!! these in prior bitcoin price action have last two to three weeks before another cross this being in a bull market.. We are still moving sideways which is good since we have been going straight up for the first six months of 2019. We are also so in a pennant formation that we should have resolution on by the 15 of sept since bitcoin doesnt like to wait for the apex!! My current skin in the game is a 1250 con at 10400 sl at 10300 prior daily close tp 1 11k tp 2 11.2k happy trading an not fin advice so please dont try it
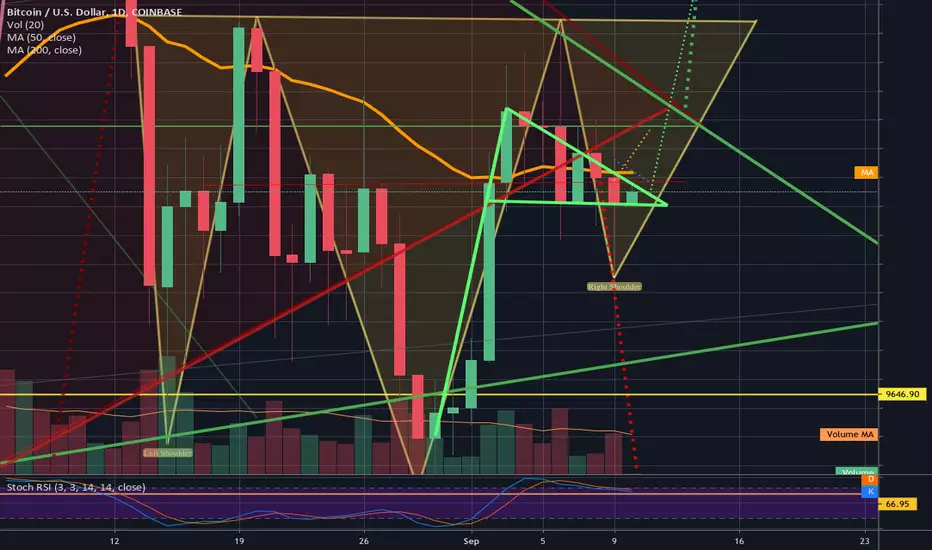
4hr gldncrss trajectory=September 9; Nearing inv h&s completionWe can see many positive signals here for the bulls on btcusd on both the 4 hour chart(shown here) and on the 1 day chart right now. On the 4hr we can see how price action has finally overcome the 4hr 200ma's resistance and we can also see that a 4hr golden cross is in the works with a current trajectory placing September 9th as the day of the cross. We can also see how both of the 2 current inverse head and shoulders in play(in pink and yellow) seem to now be completing their right shoulder as price action heads towards their respective necklines. Another big sign shown here for he bulls is that we are once again back above the ascending red neckline that belongs to a huge 3 day pattern bearish head and shoulders. This has been the 3rd consecutive time we have broken below it thats ended in a bear trap only increasing the probability of us breaking bullishly up from the 3day symmetrical triangle(in green). On the 1 day chart we also have the great bullish sign of closing our previous 1day candle back above the 1 day 50ma and the ascending red neckline(as well as two key horizontal resistances). All of this seems to suggest the bots, algos, and whales will likely try to at the very least finish painting he right shoulder on the charts before attempting any sort of bull trap fakeout dump of any kind to maximize liquidation. So I will wait until I see confirmation of either a breakout of the inv h&s pattern or confirmation of a fakeout bull trap to make my next move...even though I feel probability favors the bulls for now.
$126K Bitcoin by January 1st, 2022The last time bitcoin put out a golden cross on the monthly MACD (January 1st, 2016), there was a 14,819% return before the death cross (on June 1st, 2018). Bitcoin started at $430.89 and ended its run at $6385.71 with highs and lows between the two. The same return at our current golden cross would put us at $126,667.92 on January 1st, 2022.
This is if history were to completely repeat itself and as we all know, it doesn't work like that. Let me know what your price predictions for January 1st, 2022 are below! Would love to hear if you are #short or #long and the reason for your position.


This is more than beautiful, let's balls deep on it!!Hello fellas, I just found an altcoin that is very pretty. It suddenly made my heart beats so fast, and without further talk, let's hit the balls!
I personally feel very comfortable on Miota right now, the main reason is because I see the golden crossover on EMA occur at 4 hours chart. it can make a huge potential profit for us. Beside, the RR is very acceptable for me with maximum loss of 9% and potential profit of 22% making this set up very sexy.
Lime is the laddering zone and white is the first and second target.
Note : the dominance of bitcoin is slowly losing strength at the upside, this could be a good sign for altcoins. for further info about this, I will explain it very details on my telegram channel.
Thank you

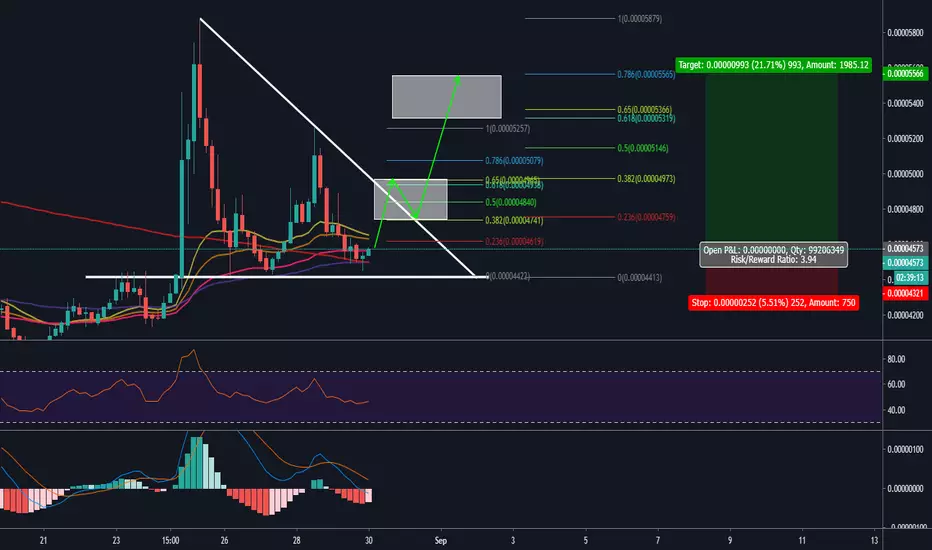
NULS, The validity of golden crossover and Fib rangeHello fellas, it has been a long time for me since I post my analysis about altcoin on Binance with alt/btc pair. and I try to have another fun with altcoins on binance universe again. This time I will share my idea about NULS.
Just like what you've seen, NULS is moving just inside of the descending triangle but an interesting point on this chart is at the EMA line. it has a perfect combination of golden crossover happening on the 4 hours chart and just like what we've known, the 4 hours chart is the most favorite time frame that is used by swing trader. At first, I was thinking to open buy position after the price breaks out of the resistance trend line but I realize that the room to the upper line is still wide and there is enough room for me to grow base on day trade so I decide to enter buy position.
Beside, I've seen the MACD histogram is growing strength and it is trying to tick to the positive side right now.
I put the target at the 2 white box for the 1st and 2nd target and put stop loss roughly under the horizontal support line. with sacrificing 5% loss to get 20% potential gain which produce a RR at 3.94 , I think it is a beautiful set up guys.
LTC going to 109 and then to 119?entry: 83-89
tp: 109
SL: no SL
Liq: 0
margin: 1:3
size: tiny->small
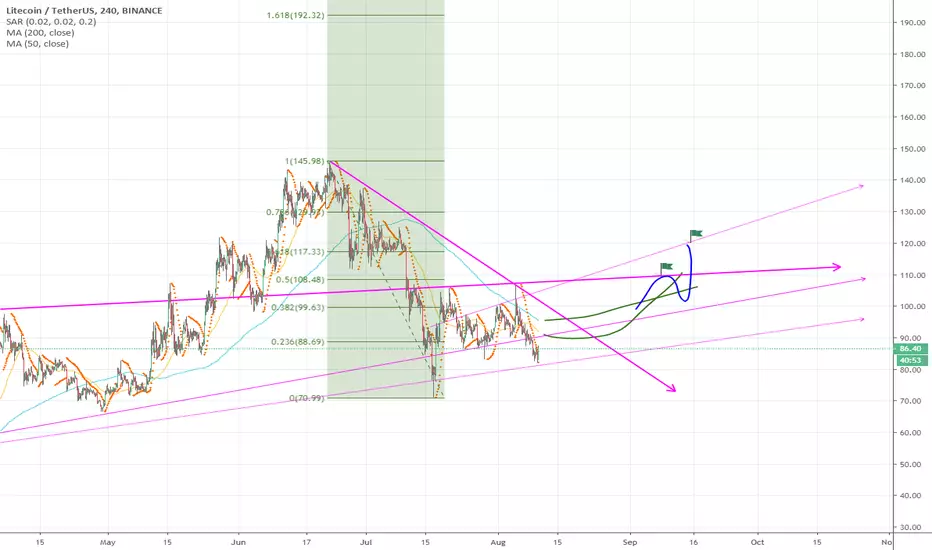
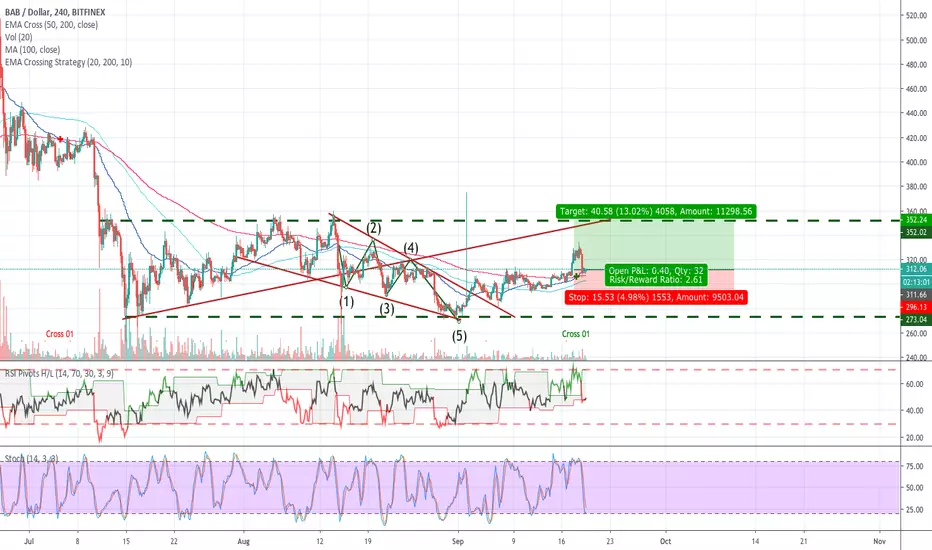
#litecoin - Support within reach, Quarterly Pivot 3DLitecoin is approaching the Quarterly Pivot and maybe due for the next Major Support, where we have to wait and see if it´s enough to make the reversal for LTC and guide it back up to bulls-zone above $100. Formerly mentioned the $60´s are possible, I wouldn´t wonder if we close a 3D further below.
We have changed from a weak uptrend to a weak downtrend on 3-day. At least the Golden Cross is probably going to bring back some life, as mentioned before usually with a delay. Also, bearish E-to-E is finished.
Targets and Supports remain all the same. I have added the diagonal downtrend resistance (yellow). Keep an eye on that.
______________________________________________
Warm regards,
Neru
Chainlink Potential Golden Cross/BreakoutIm bullish on this breakout. I hope we see the top of the channel after golden cross is confirmed. Time to get the popcorn out baby.
Second published idea. Ill keep my blue and green fingers crossed ;]]]]

$OSTK Bull trend resumes above Golden Cross for likely 3rd waveThe Bull Bear Trend oscillator back to bullish.
As much as shorts will have you believe that there is no reason for them to be concerned they are already covering and the number of shares sold short is down 17% from the highs.
Not covering here near the golden cross, 9% above the 200-day MA is very risky even from a TA perspective.
Additionally, the date of record on the new dividend is only 24 trading sessions away. A conservative estimate is that shorts not covered by the date of record may be on the hook for an additional $37,000,000.00 to cover the cost of TZero tokenized securities due to shareholders.
Even if the value of all of the Medici Ventures, patents and capital raised is taken out of the equation the shares are currently underpriced. The 2 analysts offering 12-month price forecasts for Overstock.com Inc have a median target of $44.00, with a high estimate of $48.00 and a low estimate of 40.00. The median estimate represents a +143% increase from the last price of $18.11 .

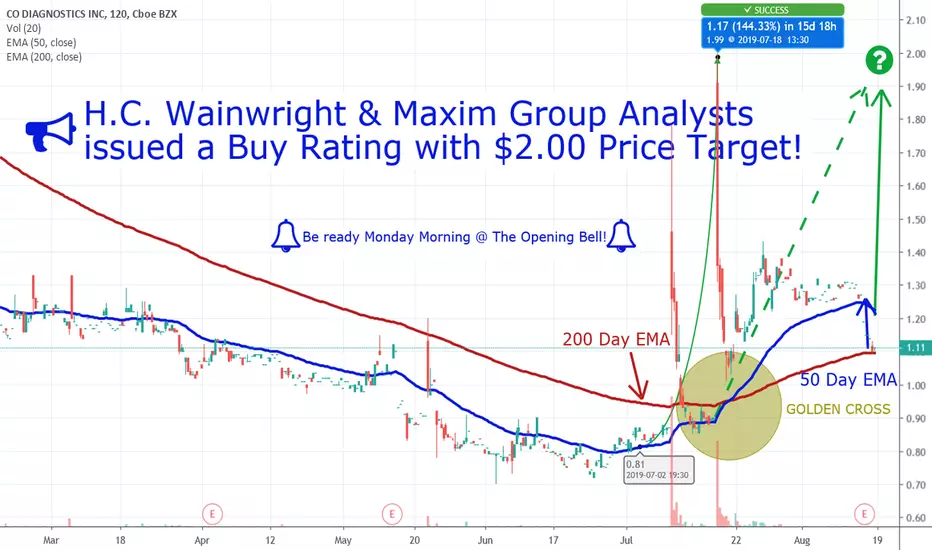
(Nasdaq: CODX) Bullish signal - GOLDEN CROSSThis could be the next NASDAQ Biotech ready to move in a big way, here's why...
(Nasdaq: CODX) displaying the Holy grail of Bullish signals - a GOLDEN CROSS.
The 50 Day EMA just crossed the 200 Day EMA, which most of you know by now is a bullish signal that indicates a potential breakout is on the Horizon.
Here Is Another Potential "Breakout Catalyst" In Play
Wall Street Analysts at H.C. Wainwright & Maxim Group have both given Co-Diagnostics (Nasdaq: CODX) Buy rating with a $2.00 Price Target, almost double its price at Fridays close, suggesting the stock has a potential upside of +80%.
TSLA hammer time.Lovely hammer on 200 MA support 15 minute chart
also Golden cross 50 MA over 200 MA

$OSTK touching down on 200-day MA. Golden cross in progressThe stock overcorrected due to the communication style of the eccentric CEO Patrick Byrne. The nature of what was communicated concerned shareholders but should have no bearing on the performance of the company. Search traffic is up meantime and the recent earnings conference call was positive. I see this as an overreaction on the part of many shareholders combined with a crash in the market and aggressive short-selling.
