goldencross/potential adam&eve dbl bttm brkout on ETH imminent?Keep a close eye on this one folks...we can see that we could have an official goldencross on ETHUSD as early as tomorrow and it just so happens to align with the price action currently peeking its head above the adam and eve patterns neckline....we can see stochrsi is perfectly positioned here for a bullish move as well...of course we need to see a big bullish volume surge here in the next 2 1 day candles to confirm this breakout and need to factor in the possibility of a fakeout until then but it does seem we have several bullish pieces aligning at once...also btc has already broken out of a similar pattern an reached the breakout target so it would make sense for eth to also do so in order to catch up with its big brother. As always I will wait for bullish volume for confirmation but I will also be laddering in conservatively here with smart stop losses until that volume confirmation...if we do confirm our target should take us above $240
Goldencross

Golden cross is very near! Good sign for BTC overall!Hello crypto traders and hodlers,
i have a great info for each of you :)
The golden cross is really near and this means we turning the trend longterm in the bullish direction!
This doesn´t mean that the price would never go more down, it´s more than likely that we generate a double bottom (near 3.100, +/- 500 USD).
So if you want to go for the longterm hold like me, the next few weeks, maybe 1-2 month could be the very last chance to buy cheap bitcoin.
No financial advise!
Hope you doing well so far, it was a long way to the downside, many of you would lost some hope, but i think there is a so bright future in front of us :)
If you want to see my longterm prediction, visit my other charts.
Greetings and wish you all good luck!

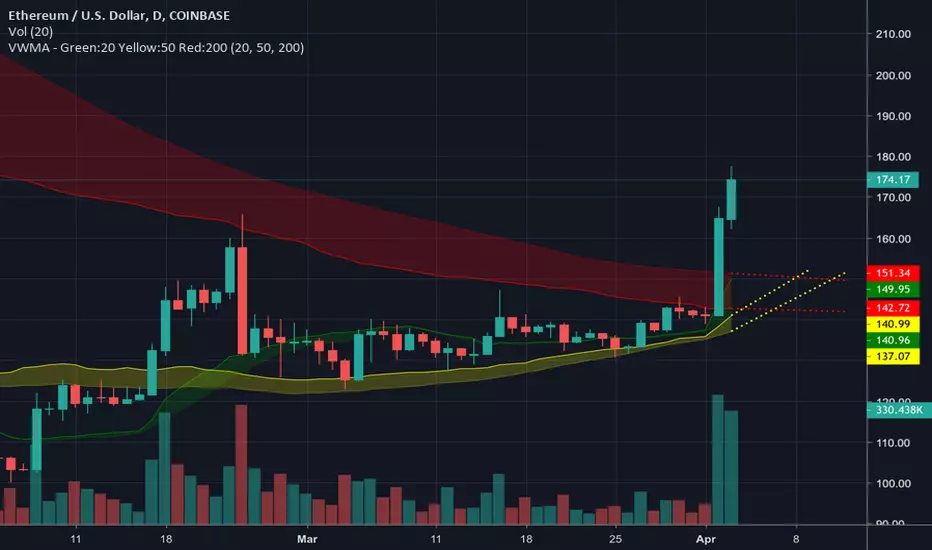
ETH Golden Cross formingThis recent surge in price has just decreased the timeline for the SMA 50 200 Golden Cross to form on many crypto charts. A conservative estimate puts the SMA to cross at the latest around April 11th. Note the Volume Weighted Averages moving up fast and in a similar fashion to the beginning of the 2017 bull run. The VWMA cross may happen in the next 24 hours at this pace.
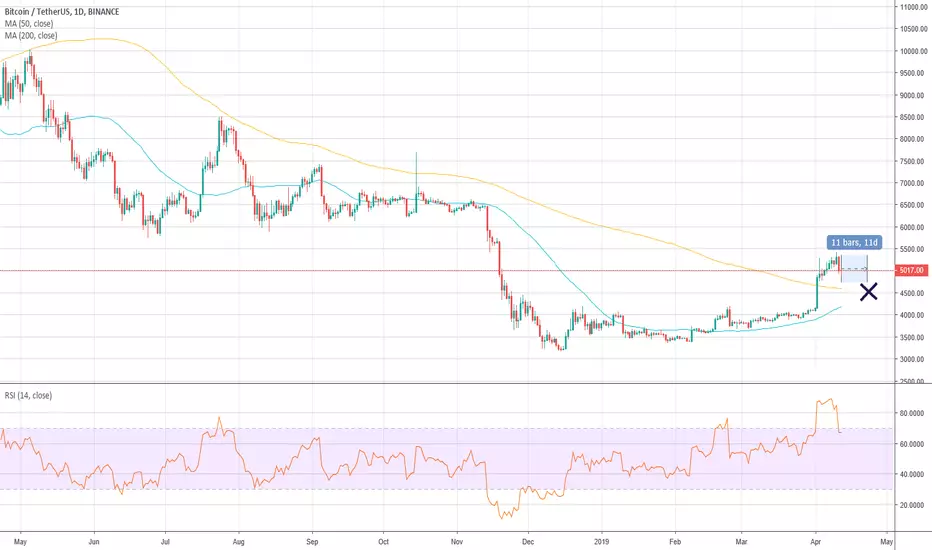
BTCUSDT Golden Cross approaching50 to cross 200MA in about 11 days on the daily chart. If this happens it will be a MAJOR confirmation of the next bull run.
The last time we saw a golden cross was in November of 2015. From that point on 50MA stayed above 200 until the death cross in April of 2018.
GOLD DIGGING IN ACTIONGold has been travelling in a very large ascending channel however it broke out to the downside, came back up to retest the channel at the 0.618 of the impulse wave and now price has broken out to the downside of the ascending trend line it was travelling above to retest the channel.
price is now going up to the 0.618 of the retest move to retest the trend line it was travelling above, we now believe price will drop to the -0.127 once it goes up to the 0.5 -0.618 of the previous wave

Golden cross bullish on LTCJust a snapshot of the daily LTC chart against USD and how previously golden cross and death cross proved to be strong indicators for trend changes.
If the recent golden cross provides the same result, we're in for much higher prices in the coming months.
#notfinancialadvice
Ascending triangle bull pennant + goldencross trajectorySimply a more zoomed in view of my last idea with the trendlines in place on the current ascending triangle consolidation pattern we are in. The triangle has many more touches than seen here on the 4hr chart to validate it.

BTC maintainin bullishness; golden cross now on track for 4/11I appears that the stoch rsi is finding excellent support on the strong ascending 3 year old trendline keeping momentum bullish for now and has helped to increase the northern trajectory of the 1 day 50ma(in orange) to where we currently have a golden cross on track for as early as April 11th. Of course any significant selling from now until then will likely push that expected cross date back but price action currently appears to be in a bit of and ascending triangle/bull pennant on the one day chart...so if we were to break up from that price action within the next day or 2 we could expect a golden cross even sooner. So as of now things still look quite bullish all around...the only reason to even consider a downward move that invalidates the goldencross and instead results in a fakeout is that because everything looks so obviously bullish that the exact opposite could happen to trick a majority of traders. However beyond that, everything else seems to be indicating probability is currently favoring the bulls. So while I'm prepared for either outcome my bias leans bullish. If we are to break upward from the current flag set up the next consolidation or correction zone is right around 6k but ultimately I still believe we will get pretty close to the big wedge breakout target of 7229 maybe even as high as the resistance at 7.4k if enough fomo kicks in before any sort of significant correction happens.

DASH/USD will soon have a golden cross; easy x100 over 2-4 yearsVolume increasing on average, MA's beginning to crossover, BTC/USD showing more than one or two signals that show that if we haven't bottomed already it won't be far lower than we've been already; these are, in my opinion, great reasons to presume a significant ROI on this asset over the next 2-5 years.
Let's have a little thought experiment by making conservative assumptions about how much the price of DASH could increase, based on current price versus presumed ATH, and presumed sell price for the open positions relative to this theoretical new ATH. Key point here is that once a new ATH is made, how much higher it will go from there is influenced by so many factors that one cannot simply assume they have a reliable guess of the next new ATH.
___
A pretty conservative minimum from ATH to ATH of most crypto assets seems to be at least x10. Currently, Dash is currently at about $136 USD per unit with a previous ATH of about $1683 USD per unit.
So, soon enough (on a week chart kinda timescale) we will see Dash make its way up to x10 current price ($1360 USD) and over the entire bull run making a conservative minimum x10 from the $1683 ATH to a new ATH of, of course, $16,830 USD per Dash coin. I gather that most reliable exit strategies (implying not exiting your positions too early or too late) would result in a sell price somewhere in the neighborhood of 10% - 35% below the new end of bull run ATH. To be conservative / having that nice risk management margin for error involved, let's say 35% below ATH.
$16,830 - 30% = $10,939.5 sell price.
$136 -> $10,939.5 = an x80.4375 multiplier on your investment (7943.75% ROI)
*Not financial advice; just a thought experiment / extrapolation that I strongly believe is reasonable to feel at least somewhat confident about*

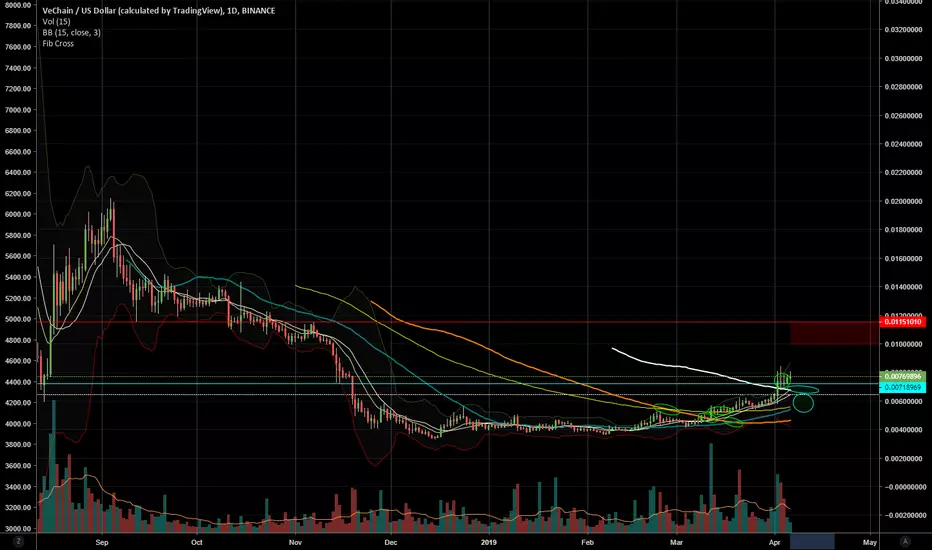
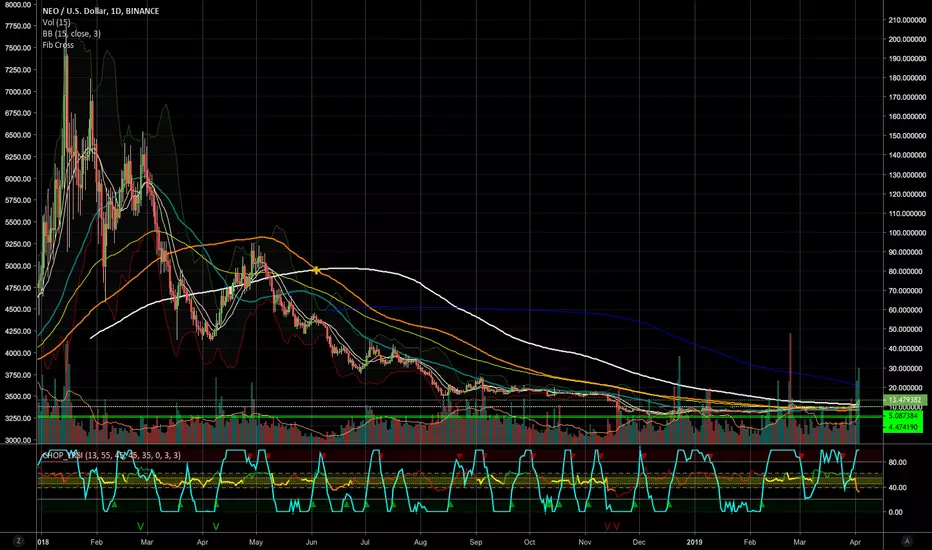
VET is well setup to Golden Cross versus. USDThe green ellipses represent basic but powerful MA and trend signals (bullish of course). The blue ellipses represent potential near-future bullish MA crosses, and the red zone represents long-term resistance for future prices (previous major long-term support; naturally). I think when BTC/USD begins its next bearish swing/retrace/consolidation, VET/BTC could rise significantly and also have its golden cross occur, pushing VET/USD into a much milder bearish retrace or possibly even sideways consolidation.
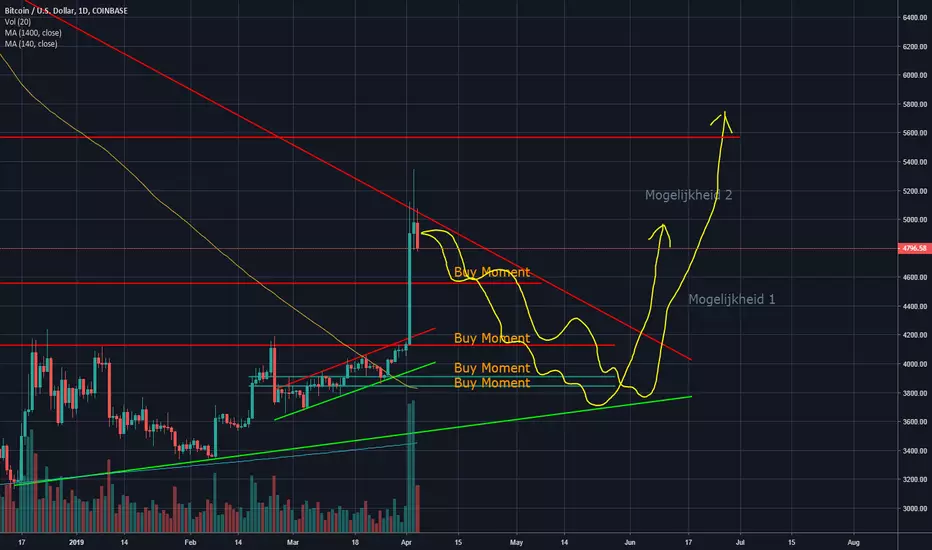
What's Gonna be next Miss BTCWhen history repeats itself; BTC will show somewhat of the following structure
It still needs to double bottom but it is sooner than anticipated
After that the way to 6k will me more clear; probably at the end of the year ... then the halvening will come near and 6k could be broken
2020 will be a good year
We will be in accumulation zone for the coming months
don't hessitate
Regards
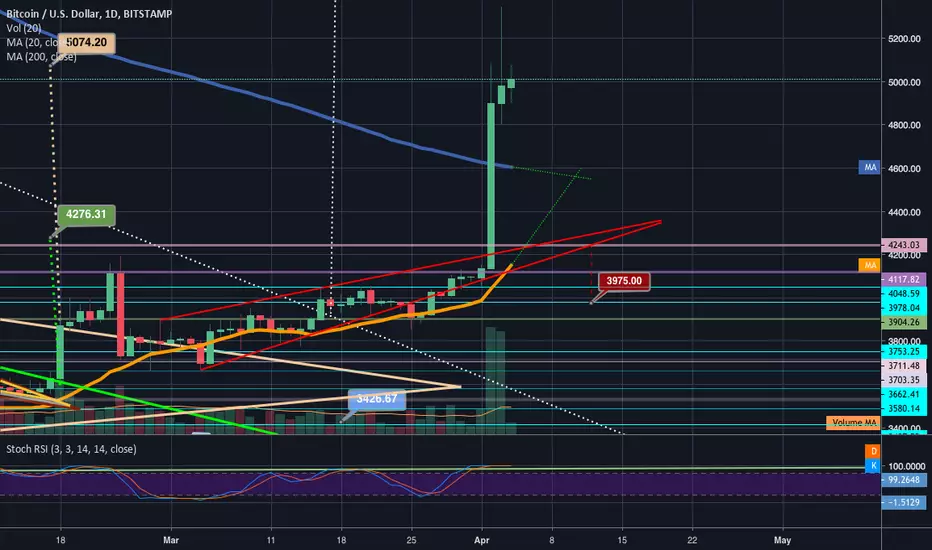
Possible goldencross after higherhigh-achieving bullish breakoutWe can see after the recent bullish breakout from the rising wedge we were in that BTC has finally achieved the ever elusive 1 day higher high a crucial move necessary to jumpstart the next bullmarket. We of course are eventually anticipating a higher low to follow it but we may keep forming this higher high a leg or 3 more upward before correcting downward to form the higher low...so while I anticipate we probably are more likely to continue up a leg or 3 I am leaving this idea neutral until I see a break one way or the other. Another crucial move to kick the bullmarket into gear is the 1 day golden cross. Because of the recent bullish breakout from the wedge we can now see the trajectory of the 1 day 50ma has bent very sharply north which has given us the potential for that ever important 1 day golden cross to occur by April 11th!! In fact we could just consolidate sideways in a bullflag for the next 7 days and we would likely see the goldencross occur! continuing upward would only make it occur sooner as well. Of course we could always bart back down before those seven days, or have a golden cross fakeout where the cross occurs but only lasts for 1 to 2 days before having a huge dump back down to the downside. Definitely a possibility to always anticipate. If we do end up having a sustainable solidified and confirmed 1 day golden cross then all thats left from there to fully confirm the bull market is that follow up 1 day higher low and one more 1 day higher high to follow it up. ('m already accumulating each time we trigger a new leg up in the meantime and will definitely be adding to my bags should I see a solidified golden cross confirmed.
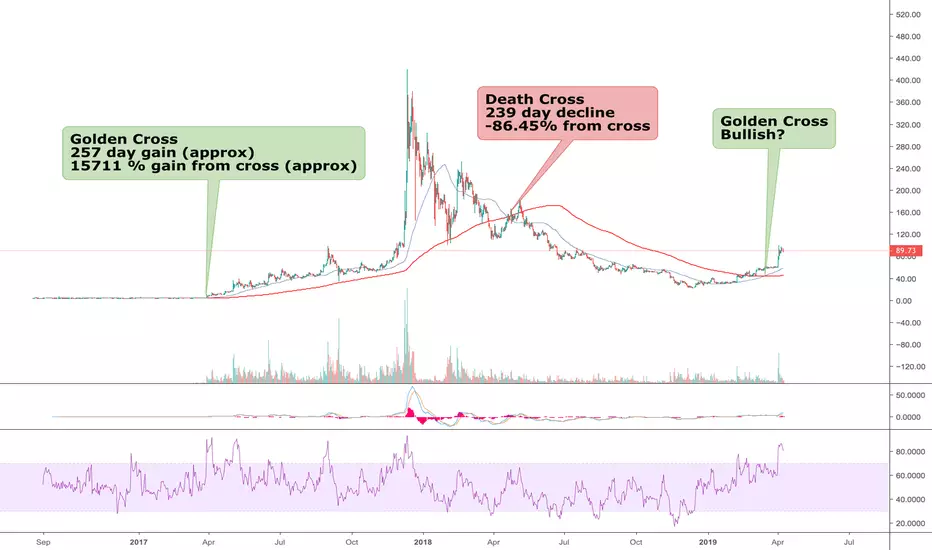
Bitcoin heading for Golden CrossWhile the current trend may be overextended, a Golden Cross of the 50 : 200 MA forming on the Bitcoin charts. Notable because for over a year, it has been generally trading below the 200 MA. These averages don't guarantee price movement, but for the first time in a long time, these averages are moving in a pattern that is favorable to sustain an uptrend.
This chart makes use of my first published script which plots Volume Weighted Moving Averages (VWMA). For reference, it plots the SMA. The VWMA tends to move faster & shows the convergence is coming up within 1, possibly 2 weeks at the most (the VWMA crosses first). Note: For my dotted projection lines, I eased off already charted upturn in the 50 MAs.
Many other coins are showing this pattern. Run my script on them and you will see some are even closer than bitcoin. This could be an exciting week coming up.

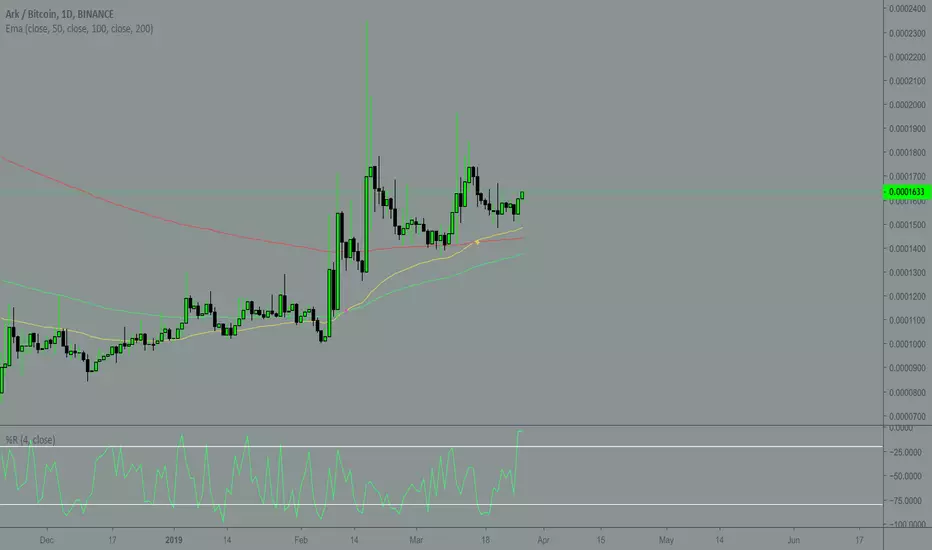
ARK Showing a golden cross followed by positive actionHello all,
ARK is one of the more interesting crypto projects in my opinion, as a long term outlook we can see a golden cross has now taken place on the daily time frame. ARK offers an iOS wallet that pays dividends weekly. With this type of compounding affect in a every growing world of crypto, this can potentially offer a great long term hold for the true HODLers that dont trade but rather value invest. As of now the estimate is 7% annual while weekly compounding.
I recommend waiting for a cool off period to pick a good amount of ARK at the 200 EMA (Red)
Thank you,
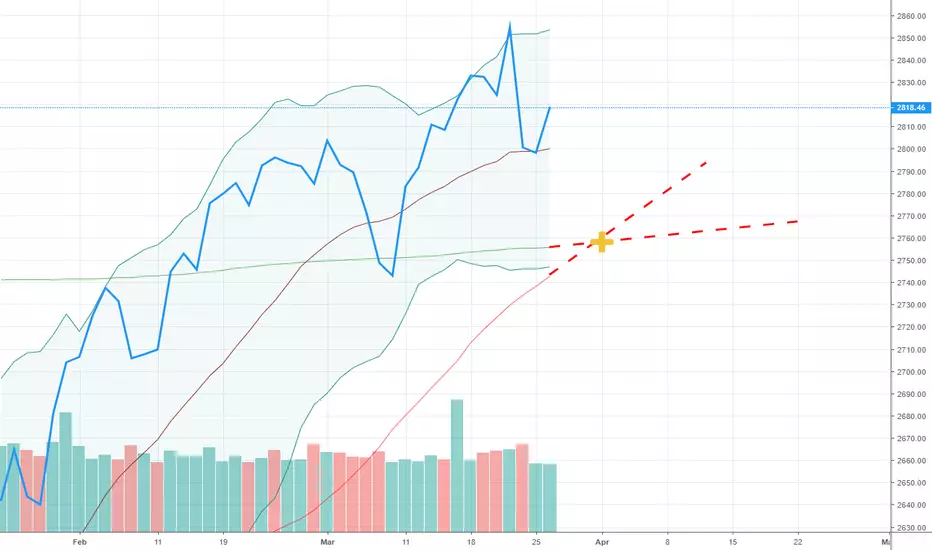
SPX 50 & 200 day MA Cross Imminent - Golden CrossThe S&P 500 index will form a golden cross formation on or about March 29th, this Friday. This is a bullish indicator when the 200 day moving average crosses the 50 day average after forming a death cross previously. A death cross is the opposite of what we're seeing here, where the 50 day MA crosses under the 200 day, which is a bearish indicator.
AXSM Going Parabolic!I first started tracking AXSM on Monday Jan 7th (Pre-market at approx. $5.00), and it has since Sky-Rocketed to a high of $17.05 today pre-market Tuesday March 26th representing 248% in Gains, locking in enormous profits.

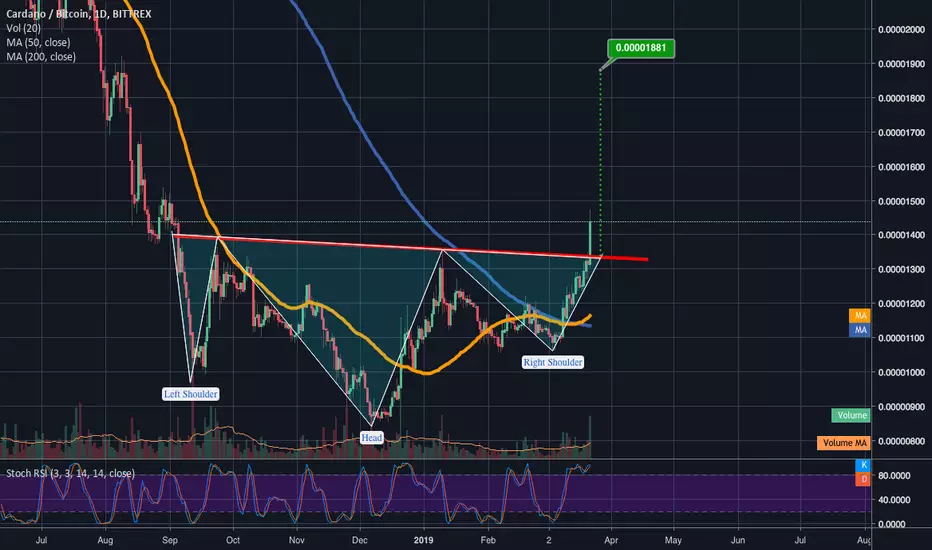
ADABTC completes 1 day golden cross/picture perfect ih&s patternWe can see here on the 1 day ADABTC chart that the price action is responding quite bullishly to the recent 1 day golden cross. Also we can see a picture perfect inverted head and shoulder pattern here which cardano has just now broken above the neckline with good bullish volume to match it. There is still a slight chance at a fakeout here but we should know by the next 1 day candle if this is a legitimate triggering of the inverted head and shoulder pattern. With the volume confirmation here probability favors a breakout more than a fakeout currently especially coupled with the recent golden cross and so I'm listing this idea as long. We also have talk of cardano being added to the ledger cold wallet and cardano also being next up to be added to coinbase...the coinbase rumor is not as solid as the ledger speculation but both are certain to be impacting price at the moment. If the ih&s breakout is triggered I have put a projected breakout price target here in green.
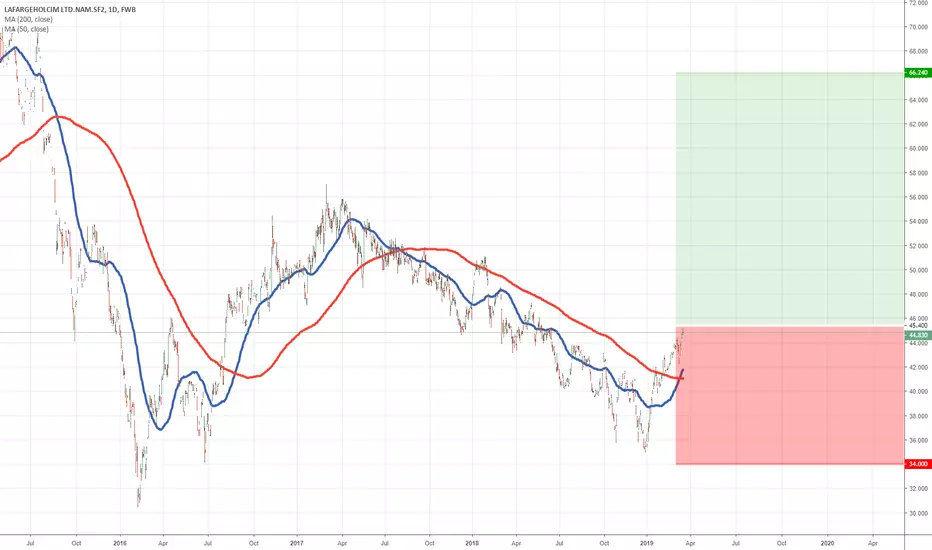
LAFARGE READY FOR UPTRENDCement firm LAFARGE,achieved golden cross last week. I
I personally see a lot of upside potential!

CRUUF "BULLISH" GOLDEN CROSSCRUUF is now displaying one of my favorite bullish signals - GOLDEN CROSS
Also, very bullish is its current buy opinion by one of Wall Street’s leading Technical indicators barchart.com, which just issued CRUUF an 80% "Buy" short term ! > Hence Time Sensitive?

CRUFF "BULLISH" GOLDEN CROSSCRUUF is now displaying one of my favorite bullish signals - GOLDEN CROSS
Also, very bullish is its current buy opinion by one of Wall Street’s leading Technical indicators barchart.com, which just issued CRUUF an 80% "Buy" short term! > Hence Time Sensitive?

DVLP "Predictable" Trading Patern DVLP has recently doubled in price multiple times . Back in Jan DVLP trended up 120%, trading from $.013 cents to $.029. And just over a week ago it Broke-out and ran up 160% , trading from $.019 cents to a high of $.05. It looks ready to potentially do it again.
