XRP ascending triangle with golden cross on 4hrXRP is out of the channel it has been riding in for the past couple months, looks to be on the move upward. Were the previous bottom hits a triple bottom? The ascending wedge seems to point to a greater breakout incoming, will bitcoin take a large value hit pushing people to xrp and other coins? Time will tell but I'm long on this one.
This is not investment advice, this is personal opinion of what I am seeing as what the current trend is.
Goldencross

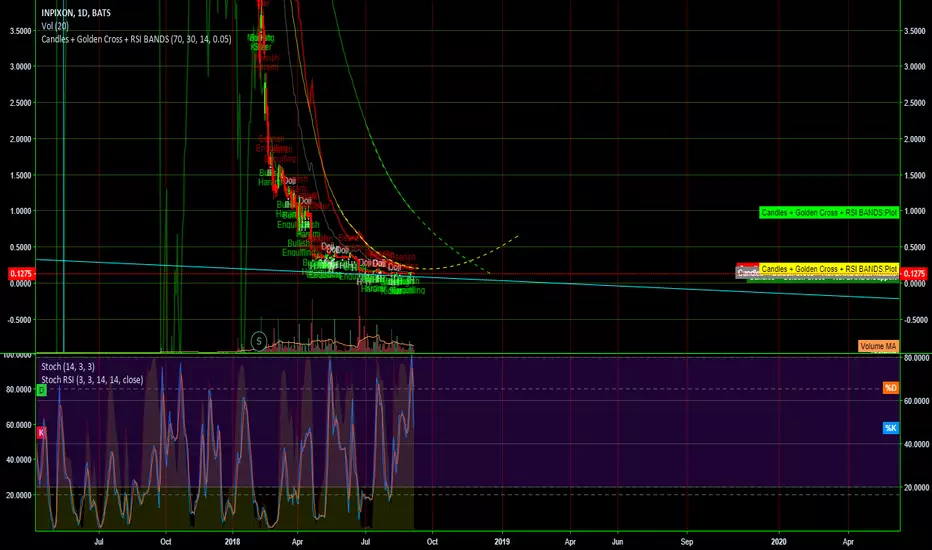
Golden Cross idea for INPXNovember looks like it will be an interesting month for INPX. The current trend points to a potential convergence of a golden cross in the middle of the month. Whether or not it plays out is a different story. The lines appear far apart, but given the price action of INPX this would not be an unwarranted move at the end of the year especially if Q3 earnings show some semblance of positive movement.
golden crosspositive divergence, min PT: 2.2, watch for breakout of flag since gap down in SEP17 could result in fast upward movement.
Looking at the past. We are not bullish yet.
Bitcoin broke through the 500 day MA resistance but as you see from 2014 it was later rejected and formed the consolidation cycle which broke market structure (the $5800 support) There are several factors why bitcoin will not be breaking out past $7200.
(1) RSI is overbought
(2) Price is still below the 200 day MA
(3) We have not made the golden cross (when the 200 day crosses upwards against 20 day MA)

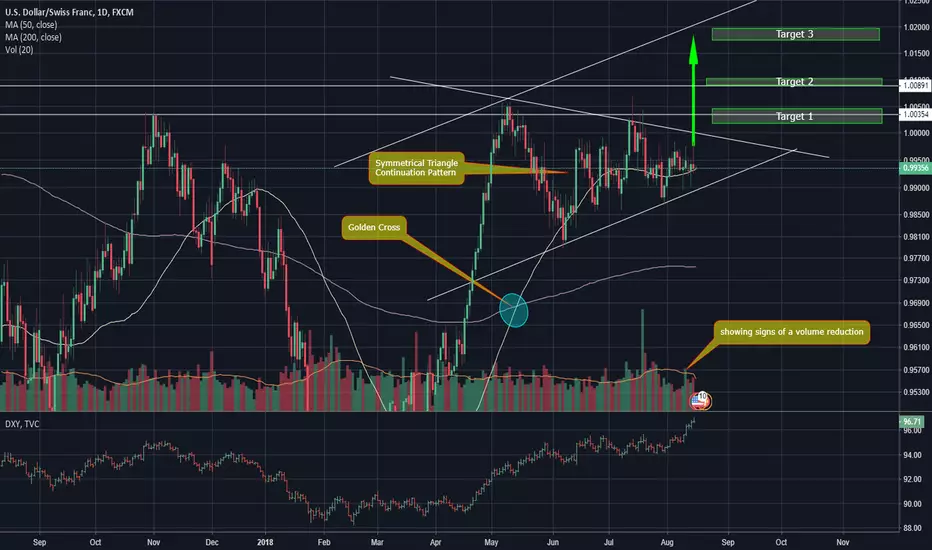
USDCHF (Long)Whats up Guys,
All of the information is on the chart - be sure to hover over the Note for fundamental analysis.
Ten Likes and I will update the chart
Intelligent disagreement welcome
Good Luck - See you on the trading floors
#Crypto #BTC #cryptocurrency #forex #USDCHF
-Nix

USDCHF (Netural / Long)Whats up guys,
Watching the USDCHF pair. Keep a close eye on this one - showing signs of a breakout.
Most of my explanation is on the chart, including target zones.
Ten Likes and I will update the chart
Intelligent disagreement welcome
Good Luck - See you on the trading floors
#Crypto #BTC #cryptocurrency #forex #USDCHF
-Nix
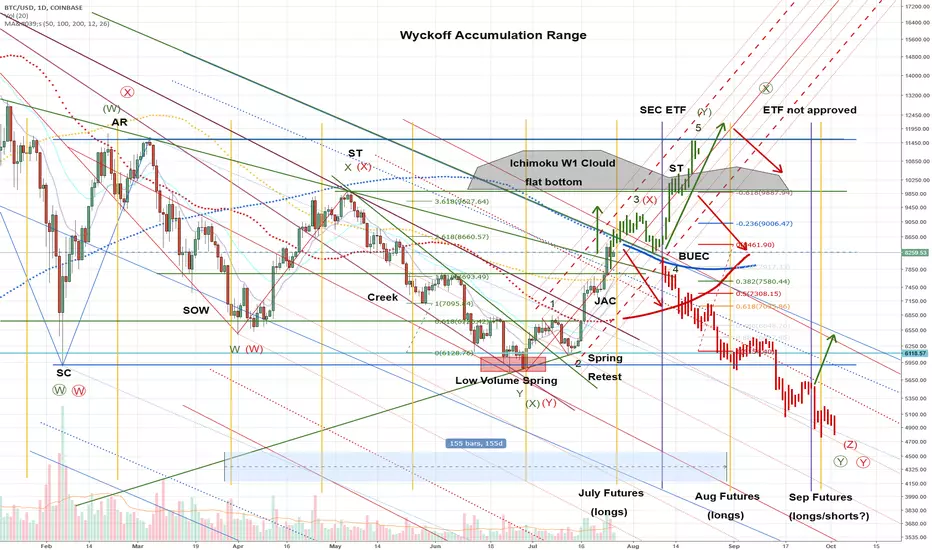
The Undoing Of BearishnessHere's a new macro view in response to the recently leaked news of a possible ETF approval by the end of Sep 2018 (nothing major, just some ex-SEC employee leaked stuff).
Bullish factors:
1. Wyckoff perspective: The whole 2018 Bear Market could be a Wyckoff accumulation trading range. We had a selling climax, automatic reaction, sign of weakness, secondary test, a low volume spring with a retest, a jump across the creek and now a BUEC with another ST could follow. Usually you buy the Spring Retest or BUEC pullback (if it retraces <50%). According to Wycoff, spring is not required but may be present in the accumulation range giving it away. We could go to around 9600. Right now we could be in a similar accumulation sideways range on a smaller scale.
2. Elliott Wave: Bulls are not done yet. Next targets for wave 3 are 8700, 8900. It seems that we need another leg up on a daily, otherwise the cycle in not complete, does not have a proper top.
A move to 9600 is also one of the possibilities in EW - a WXY flat upwards correction.
Bitcoin has stopped at 65% of the prev high. To definitively shift bias to bullish we need to break 8500.
Right now a bearish scenario with a return below 8000 could still play out. This pump could be wave X with wave Y going down.
3. MAs: We have breached all major MA resistance and Supply Lines except the D1 SMA200 at 8700. We're very close, SMA200 is declining and Bitcoin could break it soon after some sideways consolidation.
In 2014/2015 Bear Market there was a major sell-off after the 1st breach of D1 SMA200 with a bull run starting after the 2nd, so this is an important level.
The curving of all major MAs now allows for a Golden Cross on a Daily in late August. This could mean the start of a new bull run.
The MA Cross on D1 usually gives us on avg 4-6 months of a new trend in general. August will be the 5th month of bear. So, this could imply a bullish reversal.
4. Ichimoku: There's a weekly cloud with a flat bottom till Sep 17. We might not break it and bounce down.
5. Futures, ETF: July futures were obviously long, August futures will also likely be long due to rumors/expectations of a possible ETF approval as early as September.
So, we could have 1-2 green months ahead in BTFD mode.
On the other hand, this whole ETF thing could be just hype to manipulate the market into FOMO and dump bitcoins on retail investors.
They could always say that ETF rumors are fake and make the price drop towards the September futures, then in another leak say that ETF's coming in Q1 2019 and drive the price up again etc.
And this news could be aligned with the futures expiration dates. So, look out for any BTC ETF news - it will become a major price driver.
No major sell-off after July 27th will prove that the hype is real and not tailored to a particular futures expiration date.
6. The alts are slowly bleeding and dying. The alt season will begin once Bitcoin enters consolidation. Usually when Bitcoin's done, major alts will start their own accumulation cycles.
Right now the Bitcoin Dominance is 47%, the highest since Feb. Historically this aligns with extreme prices and RSI or a bull run and makes BTC the best performing asset, so people sell alts for BTC and sell BTC for alts after the bull run ends. Don't expect them all run at the same time.
7. How to spot a pump/bull run? Wait for a trend change on a daily after a cross of faster 12 and 26 EMAs. All smaller TFs should also cross to make it possible. Use a Golden cross to confirm.
Good Luck!
This is not a financial advice. Use at your own risk!
Bitcoin - Closing in on a big golden cross on the weekly MACD#BTC now closing in strongly towards a golden cross on the MACD on the weekly chart. Together with a break-out of the triangle formation and hopefully some more green volume behind it, we might be in for a treat. Next resistance at $8.200-ish!
ZRX potential BULL FLAGHey guys,
As i promised a couple days ago,it's time to take a look at ZRX,compared to BTC.
We've recently witness a lot of upward movement on ZRX,influenced especially by the possibility of of this token to be listed on Coinbase (overrated,government-controlled platform).
As the technical analysis would suggest,we are currently right in the middle of a BULL FLAG .
HOW TO TRADE
1.Set alerts and prepare to see a breakout from the parallel channel.
2.Place a buy order after the breakout takes place.
3.Set a stop-loss anywhere around the 15k satoshi levels,depending on the amount of money you are comfortable with risking.
4.Set a take-profit at roughly 21k satoshis,as the projected uptrend of a bull flag is supposed to be almost equal to the length of the flag POLE .
Unfortunately,we've left the 200 MA way behind,meaning we are a little overbought,even though we are under the influence of a Golden Cross ,a very bullish signal.
Altogether,my position on this token is bullish on the short term ,but i wouldn't be surprised if the bears would take over after we reach the 20-21k satoshi mark(if we reach it,of course,as we've bounced of the 18k sats levels multiple times in the past)
Keep in mind that if BTC keeps growing,money will start flowing into altcoins again,making it possible to see uptrends similar to December 2017 levels.
As always,i hope you found this helpful,both financially (if you are active traders) and educationally (if your goal is to learn something new). I am open to any comments,suggestions,observations or questions on this topic.
Have a nice day guys !


STRAT about to break outHey guys,
I am happy to be back after a long time gone,waiting for the bears to leave.
I decided to post more often,hoping you might see some value in my work,but i will let the tehnical analysis do the 'talking'.
To get to the point: STRAT is about to finish it's long bearish movement.Hopefully,the triangle that has been formed will break out sooner than you might expect.
How to trade: Wait for the golden cross to be done by the MA's,or set a trade right now,with a stoploss at 3.4k sats.
Target: The .5 and .618 on the fibonacci retracement pattern
None of this is trading advice,as it only represents my opinion on how things will evolve.
If this has been helpful to you in any way,please feel free to drop some change in my piggy bank, or just leave me a review in the comment section.(It would mean the world for me ;) )
BTC: 1FT5eALCLpTKtQDiwQrEvuq51ScXJQqDEZ
ETH: 0x3d2966f2cd842dd4c63cb42991d234b8f07e78b5
For any questions,leave a comment down below and i will answer as soon as i get to see it.
Cheers!
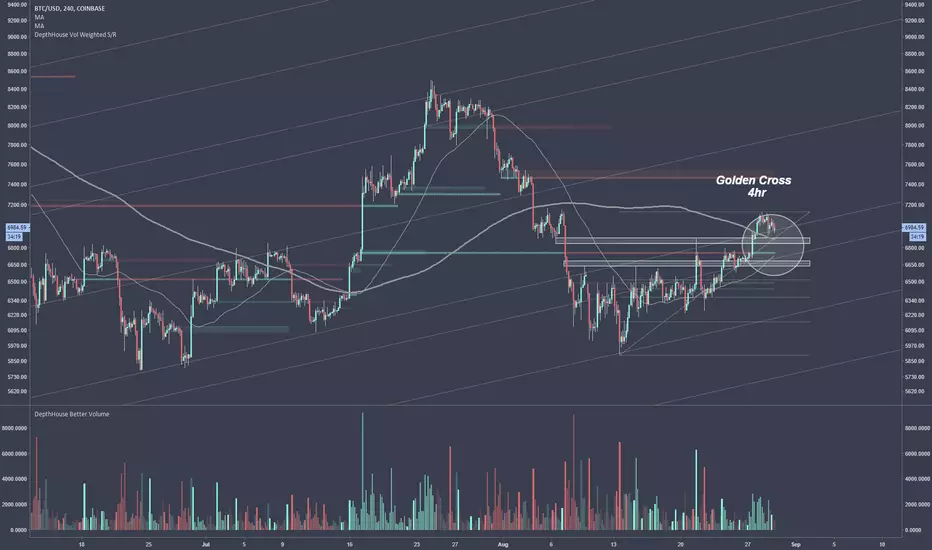
BTC:USD 4 hour chart DAILY UPDATE (day 130)Yesterday we narrowed in on major areas of resistance and outlined why I believe $7,770 - $8,150 will be a great area to build a short. Since then we have shown weakness as the price failed to rally through $6,800. Today we will be checking to see if it still looks like the rally can get to $7,700+ as well as going over the reasons why I am staying out of the market while waiting for further development.
The Ichimoku Cloud on the 4 hour chart just had a kumo breakout , combined with a bullish TK cross and a bullish kumo twist . Please note: I have not found the 4 hour cloud to be reliable enough to trade by itself, if that was on the daily chart I would open a long.
The 50 and 200 period MA ’s on the 4 hour chart are posturing for a golden cross . The price is finding resistance at the 200 MA while the 50 MA postures upward. This is similar to what Bollinger Bands illustrate. The price getting squeezed in between the two MA’s before crossing over is a very bullish indicator for the short term (1-2 weeks). The last time those crossed was on 4/18.
Before the moving averages can cross on higher time frames they must first do so on lower time frames. Therefore we would expect the 1 hour, 2 hour and 3 hour charts to crossover before the 4 hour. As you can see below the shorter time frames have already fallen in line.
The Bollinger Band on the 4 hour chart is starting to tighten and indicates that some volatility is on the horizon.
The Ichimoku Cloud on the 1 day and the 3 day are indicating oversold conditions and suggest that a return to equilibrium is imminent. That is due to the C-Clamp that is evident on the 3 day and widening on the daily.
With so many bullish indicators it can be difficult to remain on the sidelines. I seriously considered opening a small long position on the 4 hour golden cross and adding to it on the daily 12 & 26 EMA crossover that is expected.
While I do believe that this rally has enough legs to get back to $7,770 - $8,150 there are two specific reasons that are making me hold off from opening a long. The first is the visible range volume profile which shows resistance stacked up from here to $8,500.
There are two basic rules to trading which apply here:
1) Trade with the trend
2) Buy support ($5,000) and sell resistance ($6,700 - $8,500)
We are in a bear trend and we are under a ton of resistance. Therefore I am going to stay away from a long. The second reason which led me to this decision is the TD Sequential which is currently on a green 6 out of 9. That indicates that the entry was missed and this rally could coming to an end.
Thank you for your time! Have something to say? Leave a comment! Smash the follow so that you don’t miss out on future updates and remember that clicking the like is good karma!

BNB/BTC 4HAccording to the signals of Ichimoku, the medium-slip signals to the Fibonacci Fan Fibonacci, Fibonacci Fagots. We see several signals for the purchase of BNB. A special important signal is the appearance of the "Golden Cross" by Ichimoku and the predominance of purchases over "Komu" and "Kijun-Sen". With price signals.

$BYOC Continues pushing Up with Threw the Roof Accumulation.$BYOC Beyond Commerce has made huge strides in the last 9 months, successfully acquiring a major revenue producing company with over $25 Mil in revenues uplisting to pink current, publishing a brand new website and reducing the float of the share structure by 300 mil. However that is just the tip of the iceberg of updates to come, and as can be seen by the technicals of the chart the accumulation is threw the roof with every technical in bullish territory.
I anticipate the start of the next leg has formed a comfortable base right now down between .08-.10 and is gearing up for the next push past .25 and into the .50's territory with the next set of updates to come. After that it's $1 then eventually by this time next year I anticipate us to be in the $5+ territory with a newly reduced O/S and A/S coming down the road as well in addition to several more acquisitions and uplistments.
Overall the future looks very bright for $BYOC

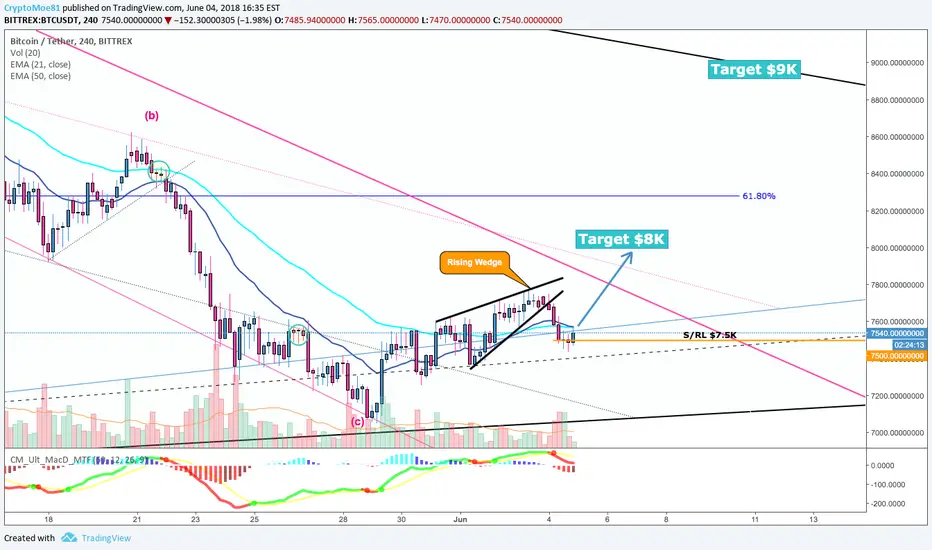
BITCOIN (#BTC): Daily UpdateToday, We saw huge dropdown occured by bearish Rising Wedge pattern. BTC dropped down, below EMA21 and EMA50 again. It can be seen that these two trend lines are a strong opponents for BTC. We saw some false attempts to break EMAs trend lines, but the true breakthrough still did not happen.
Today's goal is to close above $7550, above EMA trend lines. Then targets at $8K and $9K are still reachable. If BTC fails again, we will have new opportunity to buy some BTC at price around $7150.
I hope you enjoy my charts, please writte your comments, hit that like button or follow me. Thank you!
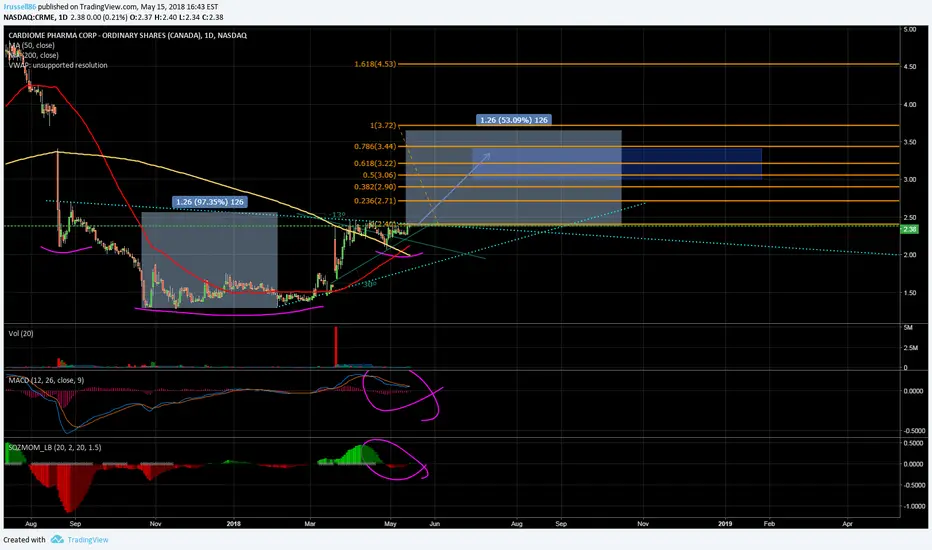
H&S Inverse ***ON WATCH***W/ Confirmed breakout, PT ≈ 3.7.
Correvio completed CRME aquisition effective today. Also Q1ER w/ EPS miss, but REV beat. HS inverse w/ + daily detected momentum and MACD ready to cross, right after golden cross of 50 & 200 DMA on 09MAY.
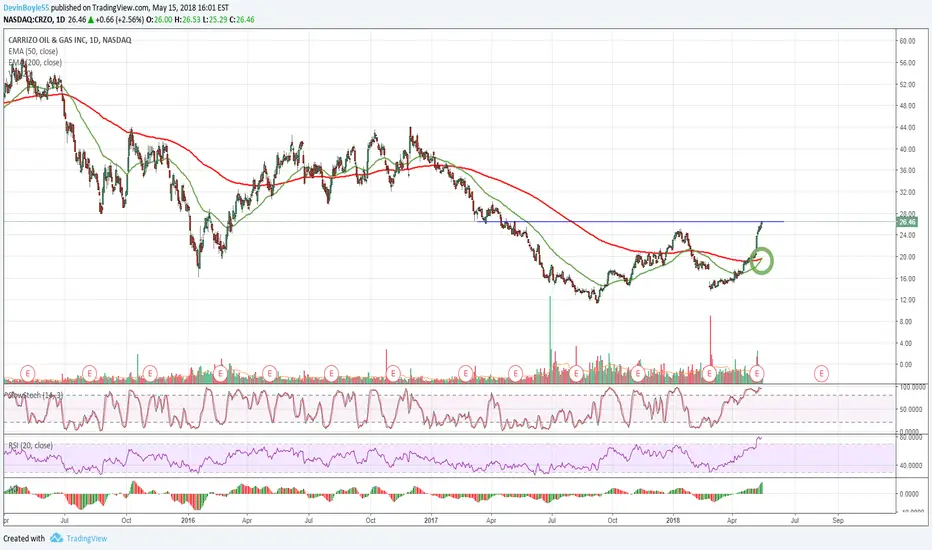
$CRZO Golden Cross$CRZO Golden Cross 50d/200d
Monitoring for break-through minor resistance at 26.50. Overall energy looking strong and doesn't appear to be slowing down.
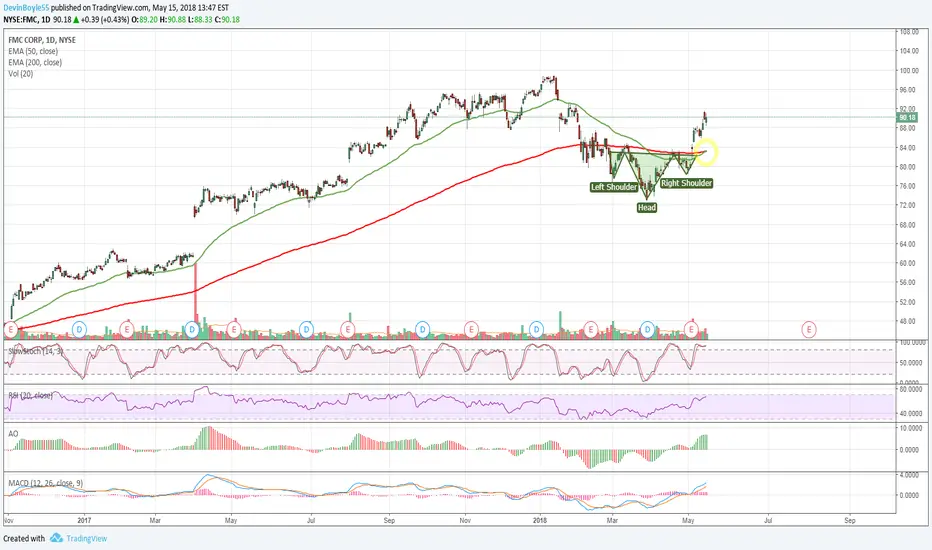
$FMC Inverse H&S / Golden Cross$FMC Inverse H&S / 50d/200d Golden Cross
Headed back to upper 90s in near term

The Last Dead EndWe are now in wave 5 of an up trend and we have 3 scenarios:
1) Bullish Blue count
We will have the EMA golden cross on D1 tomorrow and will smash 10000 and MA 200 resistance with a huge pump and parabolic volume on a strong candle.
The target for massive wave 5 must be at least 10560 (1.618 of wave 1), ideally 11640 (2.618 of wave 1) for the 23.6-38.2% correction to end above 10000 and above MA 200.
Will they do it? We don't know.
2) Bullish Green count
We can pullback in subwave ii (circle) of wave 5, find support on EMAs 50-200 or the rising green trend line, move up to break 10000 and the purple trend line in wave 3 (circle) in a few days with targets 10900 and 11640.
3) Bearish Red count
We will test/break 10000, but will be rejected by MA 200 (currently 10050) and go down to 7750. We might have a weak golden cross (will cross back down immediately) or a near miss of EMAs on D1.
We can also start correcting any time now since 9900 is 100% of wave 1 and we have hit the purple trend line.
Breaking the rising green trend line and 8800 will invalidate bullish scenario and confirm the ABC correction.
Resistance levels on the way up that can bounce:
10000
10050 MA 200
10850 resistance level
11180 or 11500 38.2% retracement depending from which wick you draw the fibs.
In favor of the up trend:
- we started making a golden cross on D1
- $10 bln daily volume
- we also have breakouts from the down channel/golden cross on D1 in all cryptos (see Litecoin, Ethereum):
BTC - breakout, below MA 200, golden cross
ZEC - breakout, below EMA 200, no golden cross, but possible soon
DSH - breakout, below EMA 200, no golden cross, but possible soon
BCH - breakout, recent golden cross
ETH - breakout, recent golden cross
XRP - breakout, recent golden cross
IOTA -breakout, no golden cross, but possible soon
EOS - breakout, no cross, EMAs fanning up
LTC - breakout, no cross, EMAs nearly missed, goes up
OMG - breakout, no cross, EMAs nearly missed, goes up
TRX - breakout, no EMA 200, EMAs fanning, goes up
NEO - no breakout, no cross, but possible soon
XMR - no breakout, recent golden cross
These prior moves/pumps on alts are inexpensive compared to Bitcoin. The market makers use them to shift the market bias to the bullish side and instill confidence in traders in the up trend of Bitcoin.
Also watch volume on ETHBTC and LTCBTC. They may be trading BTC for alts to dump them and get more USD to pump Bitcoin.
Good Luck!
This is just an idea of things to come, not a financial advice. Please do your own research, I'm not responsible for possible losses.

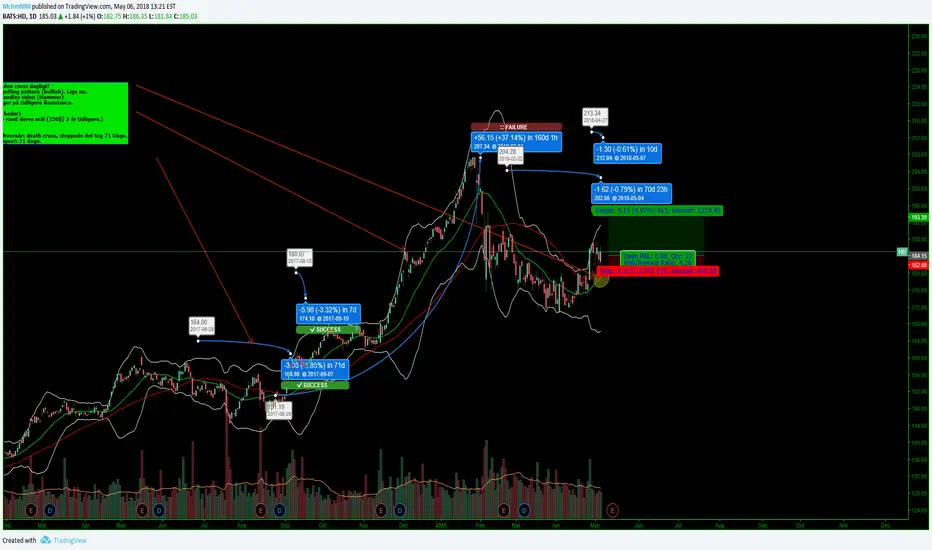
HD- Dailey long! Golden cross.Got a golden cross!
Engulfing pattern.
And 71 days after the (dead cross).
Let's move up!
Wait (Hope) for a pullback
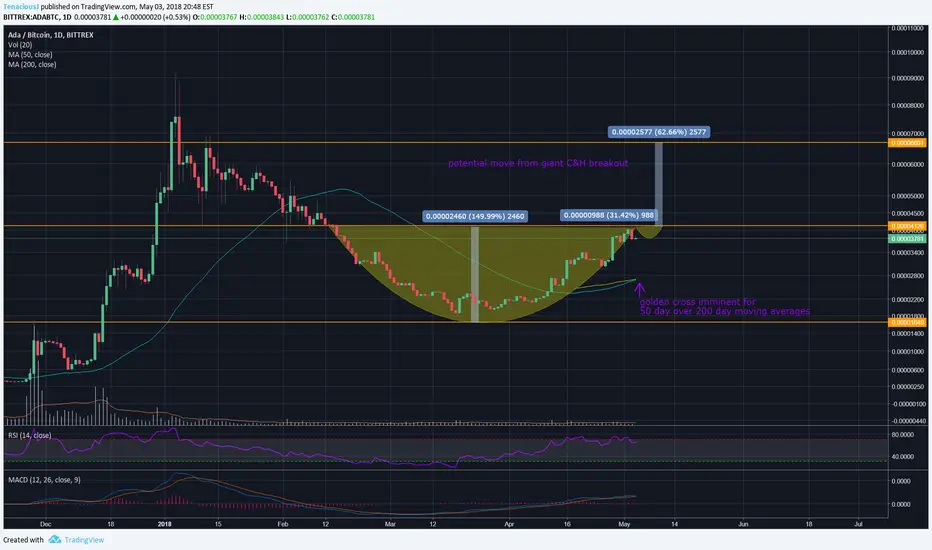
$ADA C&H and golden cross forming on the daily candlesThis chart is starting to look REALLY good... the cup is formed, and now the handle looks promising. The fact that it coincides with the first ever daily golden cross for Cardano is extremely bullish in my view.
We may see a slight pullback while the handle forms, then I expect the subsequent rally to be fast and intense. #fingerscrossed
Let me know what you think in the comments.