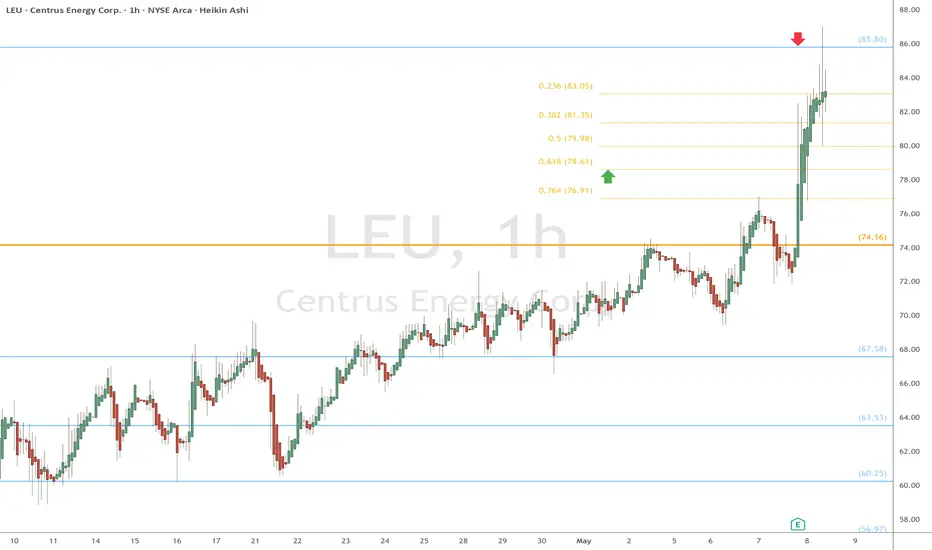
LEU watch $85.80 above 78.61 below: Wide Range looking to break LEU earnings report pumped to a minor Genesis fib at $85.80
If we get a fade of the pump then look for .618 retrace to $78.61
Next fib above is close so ideally a Dip entry gives better reward.
Goldenratio
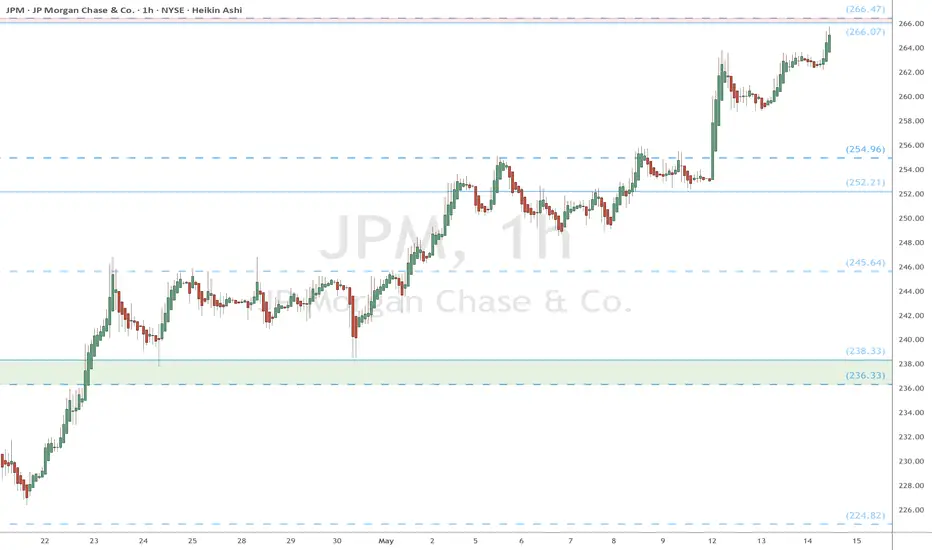
JPM eyes on $266: Double Fib resistance could POP or DIPJPM rebounding with all banks but now at resistance.
Watching double fib confluence at $266.07-266.47 now.
Break could run to $280 above, dip to $254.96 or 252.21
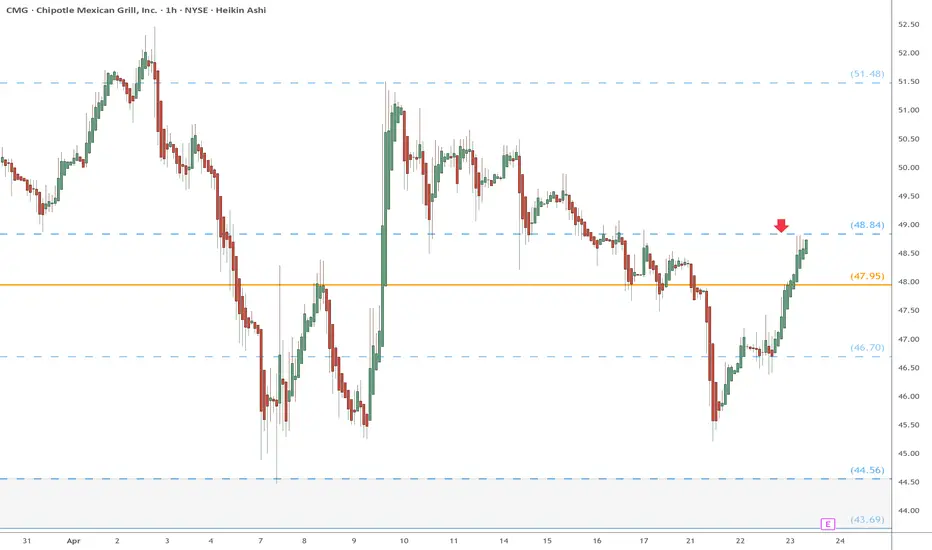
CMG watch $48,84 above 47.95 below: Key Range to determine trendCMG trying to recover with the general market.
Testing a Semi-Major Covid fib above at $48.94
If dip bulls MUST hold Golden Genesis at $47.95
CDNS watch $325.10: Golden Genesis Fib ceiling for over 2 yearsCDNS has topped here many times over the last 2 years.
Golden Genesis fibs are massive landmarks for any asset.
This one has marked THE TOP for over 2 years thus far.
It is PROBABLE that we "Orbit" this a few times.
It is POSSIBLE that we reject for another top.
It is PLAUSIBLE to Break and run to new ATH.
=================================================
.

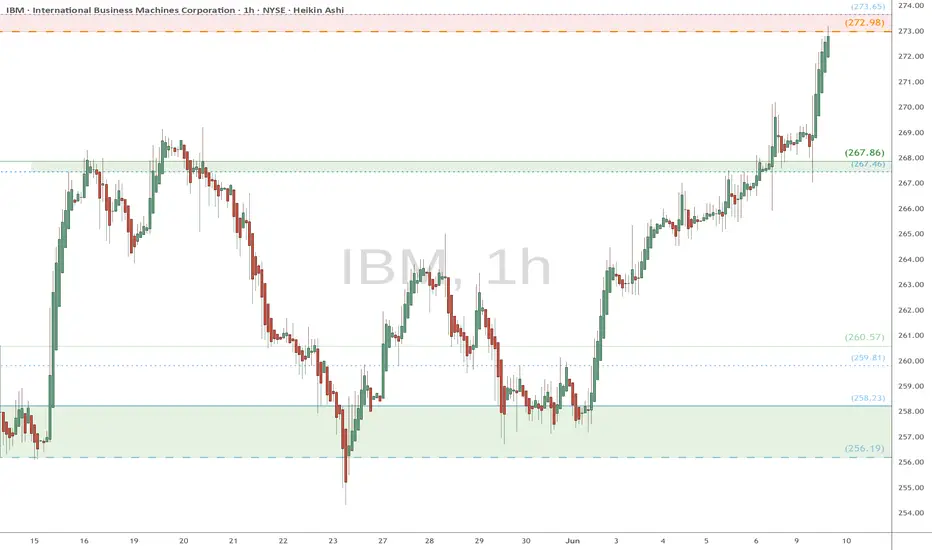
IBM heads up at $273: Serious Resistance may give a Dip-to-Buy IBM has been flying to new All Time Highs (finally)
Now testing a serious resistance at $272.98-273.65
It may need to retest support zone $267.46-267.86
.
Previous Analysis that caught the EXACT BOTTOM:
Hit the BOOST and FOLLOW to encourage more such PRECISE ideas.
==========================================================
.
UPS eyes on $98.xx: Double Golden fib zone KEY to End DownTrendUPS feels to have been dropping forever because it HAS :(
Currently testing Double Golden fib zone at $98.38-98.99
Hoping for consolidation in the zone then a big break out.

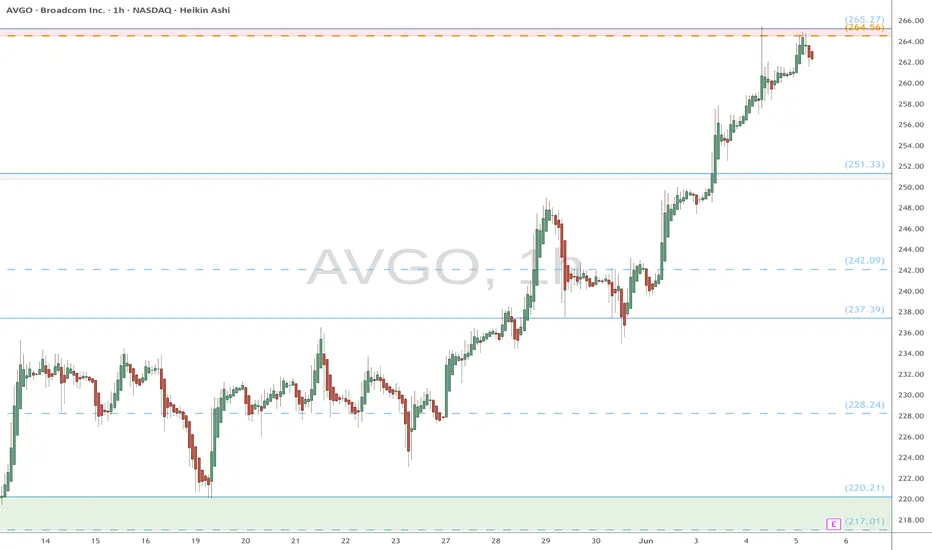
AVGO heads up at $265: Take Profits at this Major Resistance ?AVGO has hit our target from last idea below.
Golden Covid + Minor Genesis at $264.56-265.27
Likely a dip here, or Break-n-Retest as surprise.
.
Last Plot that caught the BreakOut:
.
Hit the BOOST and FOLLOW to encourage more such a PRECISION
.
CRM watch $262-265: Major Support that will call Bull or BearCRM gave us a nice long and exit in last idea below.
Now retreated to a major support $262.54-265.36
Bottom bound is a Golden Genesis, most important.
Above this zone is Bull, below is more Bear hell.
Look for a clean bounce or rejection for next leg.
.
Last Plot that gave perfect Entry/Exit:
Earlier Plot that gave PERFECT BOTTOM entry:
Hit the Follow and Boost to encourage more such PRECISE trade calls.
.

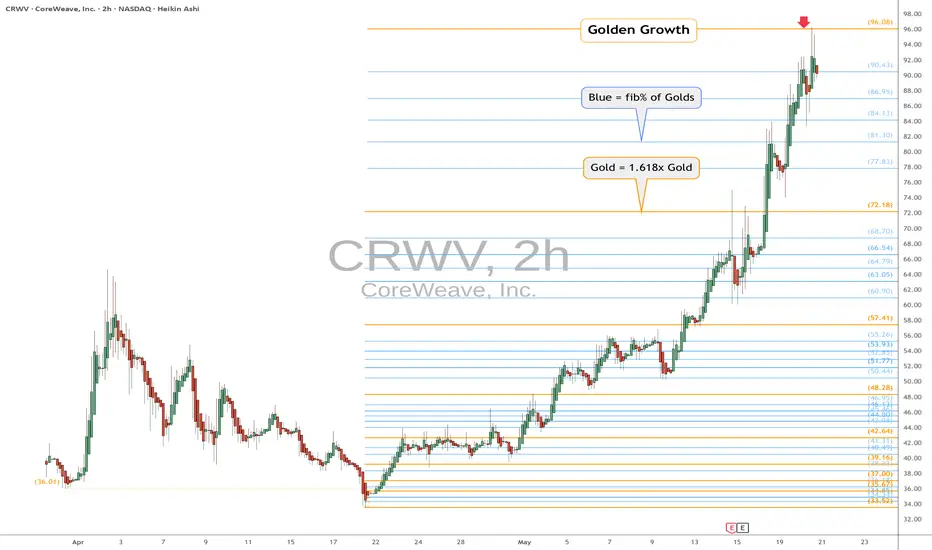
CRWV eyes on $96.08: Golden Genesis fib Ends 60% trade now DIP? Our last plot (see below) gave a nice 66% gain.
Now looking for a decent dip to re-enter longs.
Each fib below is of interest, especially Goldens.
Previous trade that just closed with 66% gains
=============================================
.
TGT watch $96.48/97: Proven Resistance could Mak / Break bottomTGT trying to paint a bottom to its huge downtrend.
About to test a key resistance zone at $96.48-96.97
Looking for Dip-to-Fib or Break-n-Retest to go long.

QUBT watch $8.64/75: Key Resistance after quantum sector rallyQUBT rallied with all quantums, into a serious resistance.
Looking for a Dip to Buy or a Break-n-Retest entry for longs.
Some companies are apparently close to commercial usage.
$8.64-8.75 is the exact zone of interest.
$9.36 would be first target for a breakout.
$8.16 then 7.65 are supports below if needed.
====================================================
.

APP watch $310-313: Key Resistance before next Target at $350APP recovering well but watch key resistance at $310.50-313.14
If we get a dip then we look to support below at $289.58-291.00
Break and run has some blue skies above it until the $350 area.

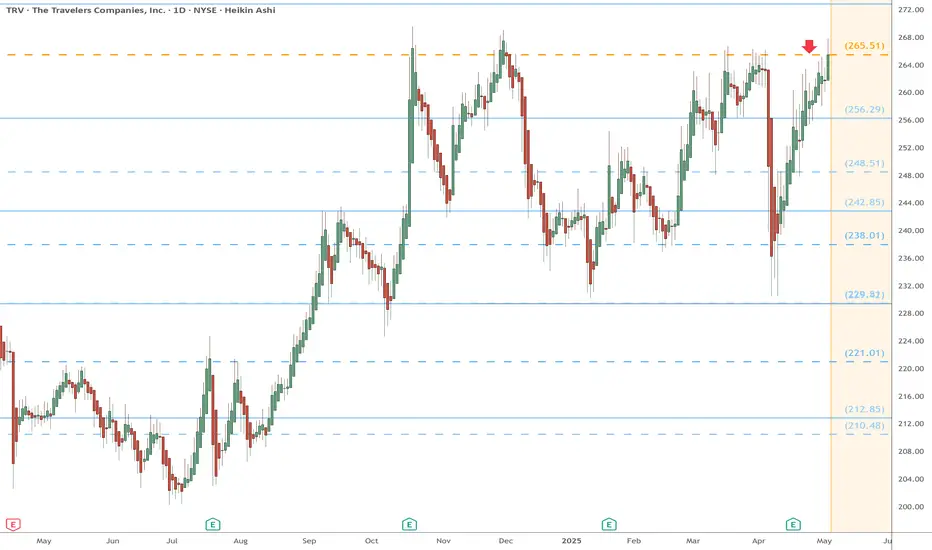
TRV eyes on $265.51: Golden Fib break should run to new ATHTRV has been struggling with a Golden Covid fib at $265.51.
This is a MAJOR landmark. proven by the many rejections.
This break may be the ONE, the one to hit All Time Highs.
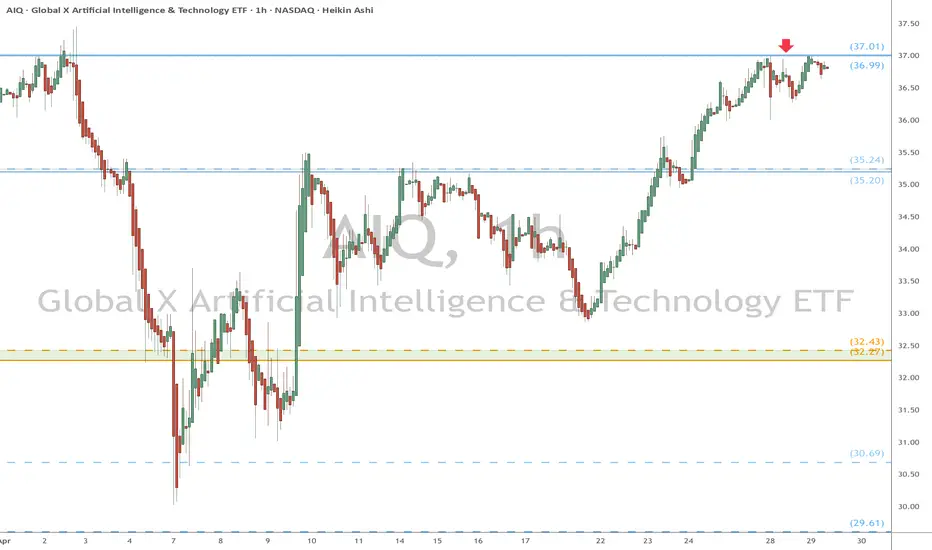
AIQ eyes on $37: Double Fib resistance to Break or Reject AIQ recovering nicely after AI demand show to continue.
Currently testing a double fib resistance at $36.99-37.01
Looking for a Brean-n-Retest or if dips to $35.20-35.24
AUDJPY Begins Elliot Correction After Wave 5 Impulse EndsOANDA:AUDJPY seems to have started a Elliot Correction Wave after the Impulsive Elliot Wave came to a finish once Wave 5 ended this morning @ 93.774.
Now after an Impulsive Wave ends, its theory that a Correction comes next and with Price having Retraced to the Golden Ratio creating a Lower High, this is the beginning signs of that theory in the works!
The Sequence will be confirmed once Price Breaks below Point A @ 93.248 where then we should suspect Price to find itself back down into the 92 range where the Correction Wave should come to an end.
RSI is trading back below 50 confirming Price has room to move lower strengthening the Bearish Bias.

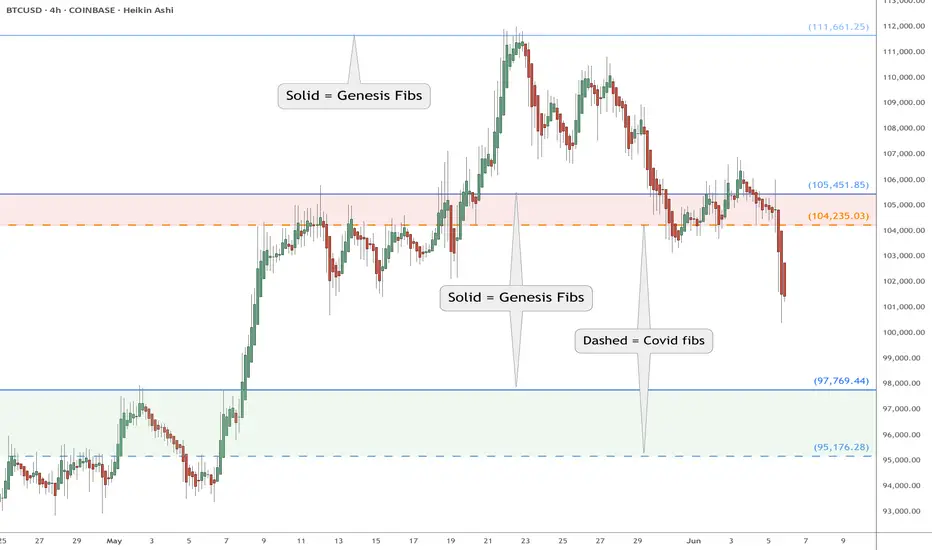
BTC eyes on 97.8k then 95.2k: Next major Support Zone incomingBTC now watching 97.8k then 95.2k: Next support zone incoming
BTC pulling back hard from our 111.7k Top call (see below).
Loss of 104/105k has opened the next major support zone.
Sub-100k stop hunt was expectable and looking likely now.
==================
Previous Plots below
==================
TOP call at 111.7k:
Subsequent warning about 105k:
Hit the BOOST to encourage more such PRECISE publications ======================================================
.
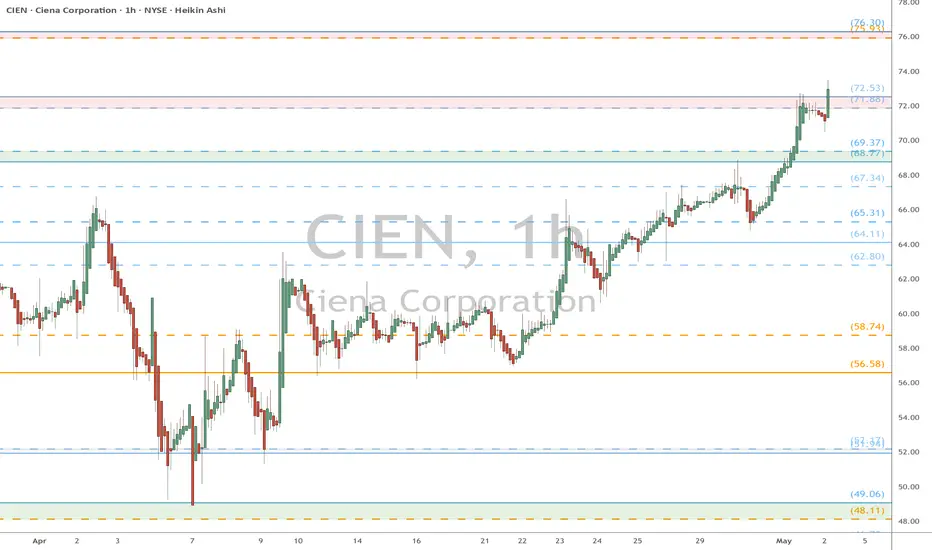
CIEN watch $72 then 76: Serious Resistance zones that cause dip CIEN coming back ferociously from the tariff bottom.
About to break second Major Resistance, one more to go.
Very likely to see a dip from one of these major zones.
$71.88-72.53 is the immediate resistance breaking
$75.93-76.30 is the next resistance to try shorting.
$68.77-69.37 is the first support in case of a dip.
=================================================
.
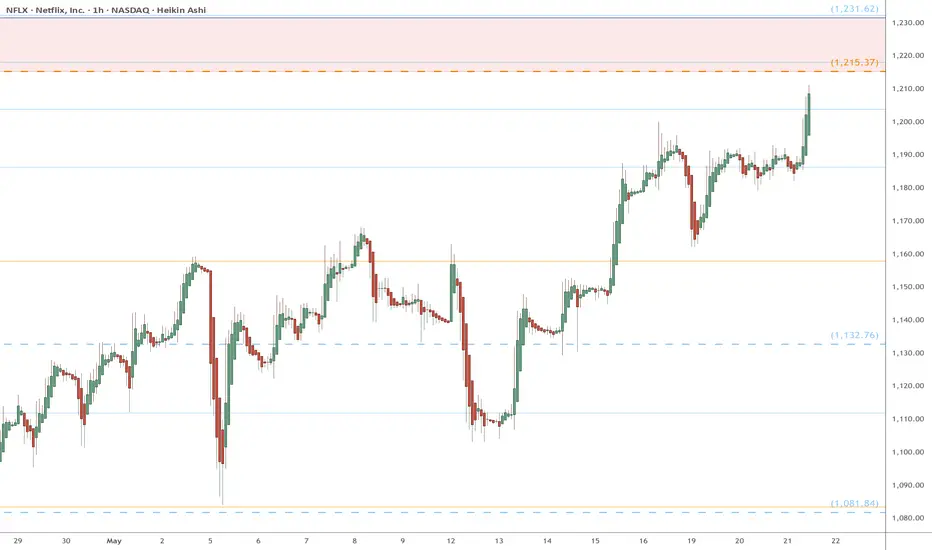
NFLX heads up into $1230: Major Resistance zone may give a DipNFLX has been on a tear but nearing a major resistance.
$1215.37 is a Golden Covid fib forming bottom bound.
$1231.61 is a minor Genesis fib forming the top bound.
It is PROBABLE that we see a dip from there.
It is POSSIBLE to consolidate within the zone.
It is PLAUSIBLE to break-and-retest to go more.
.
Previous Analysis that caught the BOTTOM
==================================================
.
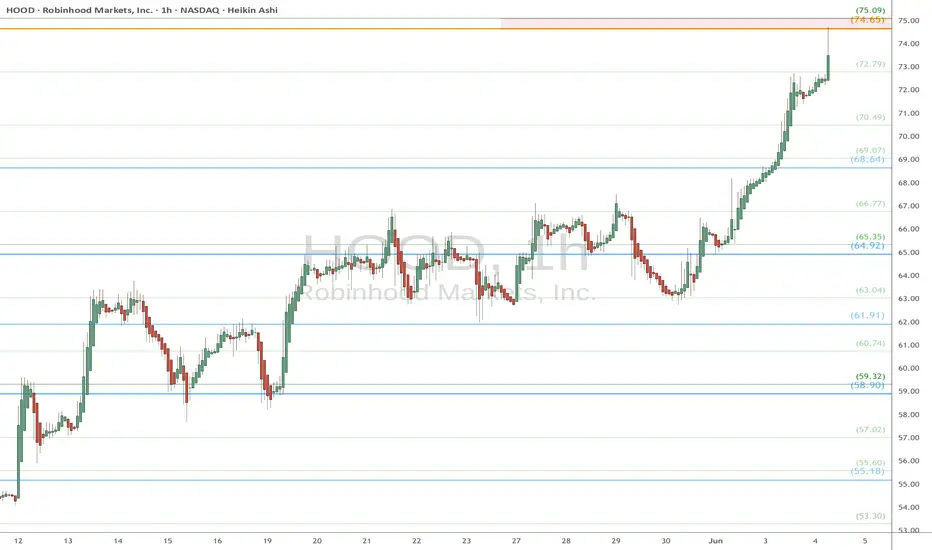
HOOD watch $75: Golden Genesis + Local fib zone may cause a DipHOOD has been flying from various company news.
Just hit a Golden Genesis zone at $74.65-75.09
Look for a Dip-to-Fib or Break-n-Retest for entries.
.
See "Related Publications" for previous EXACT plots ------------->>>>
.
EBAY heads up into $76: Major Resistance zone could mark a TOP EBAY has been relentlessly grinding away Northward.
About to test a serious resistance zone $75.76-76.26
Expecting a dip to possibly the Golden Covid at $69.87
.
Previous Analysis that caught a HUGE breakout:

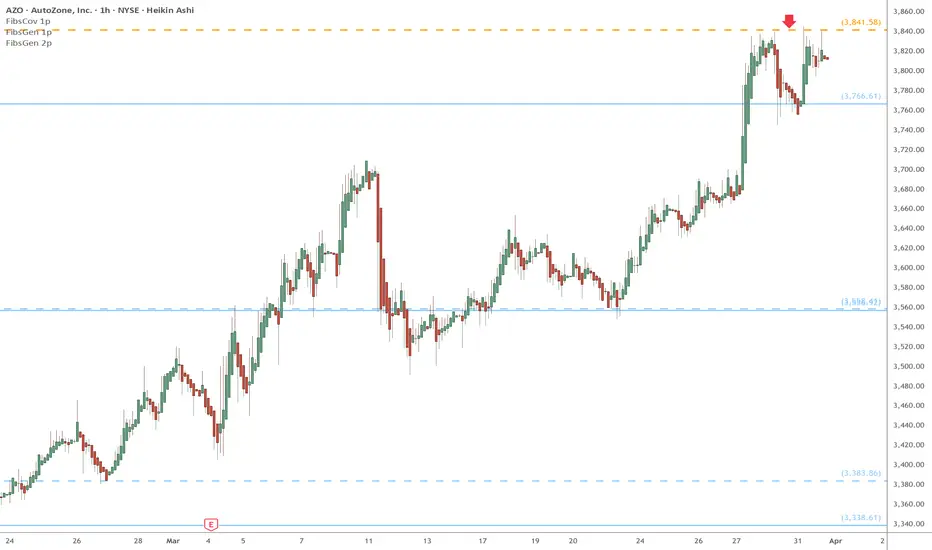
AZO eyes on $3841: Golden Covid roof, awaiting Trump tariffsTariffs on new cars expected to boost used car upkeep.
AZO is bobbing up against a Golden Covid fib at $3841.58.
Break could be powerful, or reject as a top if tariffs wimper.
=====================================================
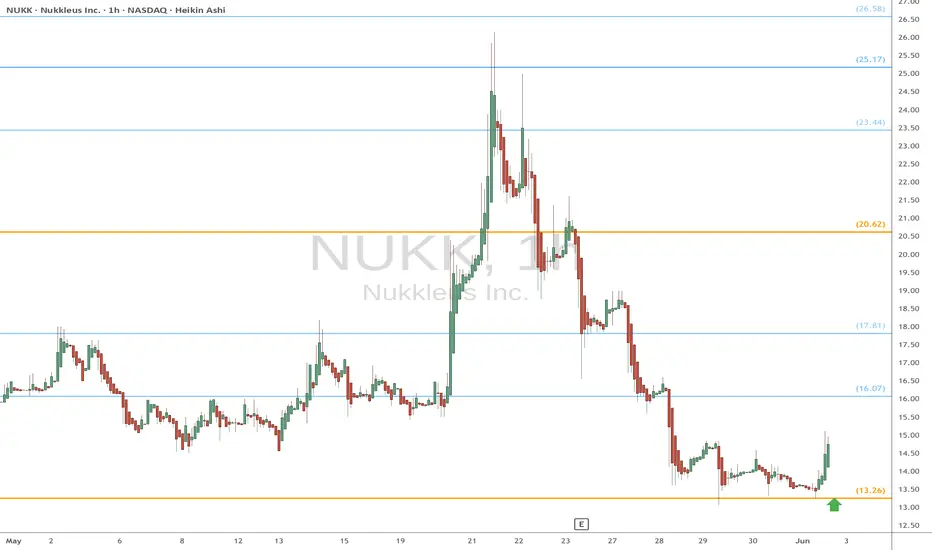
NUKK bottomed at $13.26? Golden Genesis fib for the ideal BOTTOMNUKK has been getting nuked all year (lol).
Just bounced off a Golden Genesis fib at $13.26
There is a good chance that was 'the" bottom.
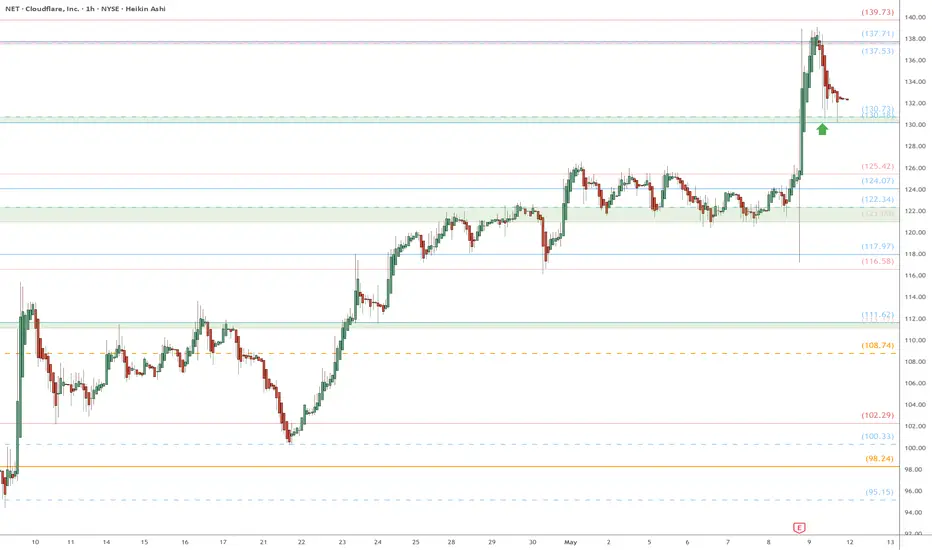
NET eyes on $130: High Support after Earnings bump and retrace NET got a nice boost after last earnings report.
The retrace is now at first support $130.38-130.73
IF that fails then we might drop to $122.34-124.07