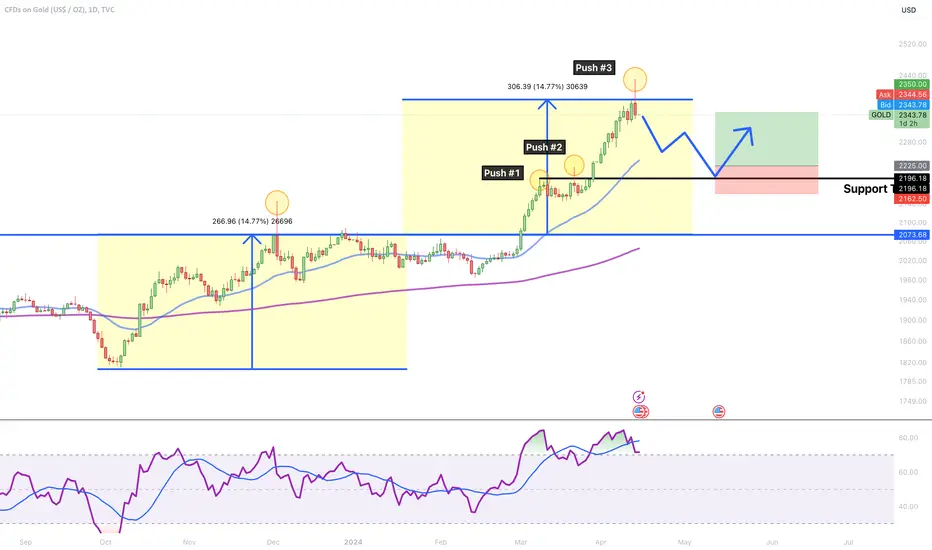
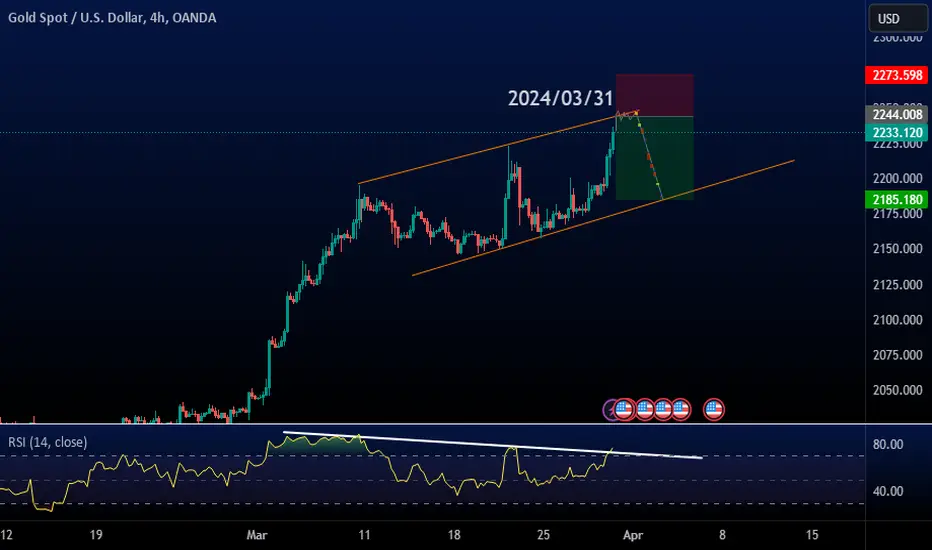
GOLD → Measured Move Complete!? Pullback to $2,200? Let's AnswerGold had a strong breakout above $2,075 on March 24th, 2024, leading to a measured move target of roughly $2,400. Gold overshot to $2,430 and ended last week with a strong sell signal at the target. Should we short here?
How do we trade this? 🤔
This is an optimal time to short on the lower timeframes given we see a confirmation candle on the hourly chart. I would remain bullish on Gold given the macro trend on the higher timeframes like the Daily and Weekly. After three pushes up post-breakout, hitting the measured move target, and the Daily RSI being overbought for about 6 weeks, we should wait for the price to pullback from the breakout, likely a standard 50% pullback toward the price of the first push up; $2,200.00.
Look for a buy signal candle and confirmation off of this area to enter a 1:2 long trade targeting a take profit around the measured move high of $2,350. Taking half profits at this target is reasonable then swing the latter half of the position until we see a sell signal. After the completion of that measured move target, I would be cautious that the price wants to go any higher before hanging around in this area of price via trading range.
💡 Trade Idea 💡
Long Entry: $2,225.00
🟥 Stop Loss: $2,162.50
✅ Take Profit: $2,350.00
⚖️ Risk/Reward Ratio: 1:2
🔑 Key Takeaways 🔑
1. Breakout of long-standing $2,075 resistance
2. Three pushes up to complete the measured move target
3. Strong sell signal after hitting that target, look for 50% pullback to Push #1 Support area
4. Look for a strong buy signal and confirmation bar, targeting a 1:2 Risk/Reward ratio trade
5. RSI at 72.00 and below the Moving Average. Has been overbought for 6 weeks on the Daily timeframe, supports pullback.
💰 Trading Tip 💰
The longer a trend continues after 3 legs, the probability of that trend continuing lessens. Because of this decreased probability, we ought to reduce our risk when entering trades.
⚠️ Risk Warning! ⚠️
Past performance is not necessarily indicative of future results. You are solely responsible for your trades. Trade at your own risk!
Like 👍 and Follow to learn more about:
1. Reading Price Action
2. Chart Analysis
3. Trade Management
4. Trading Psychology
Goldforecast
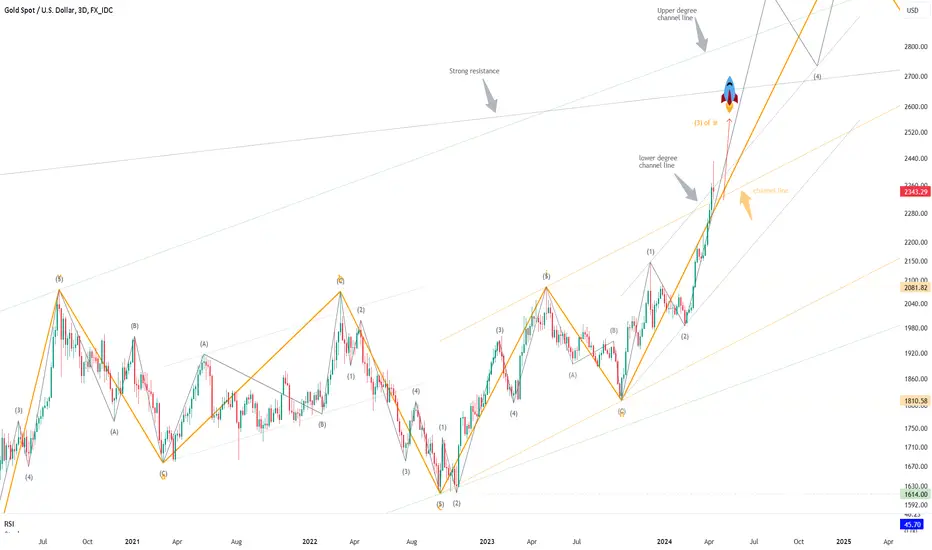
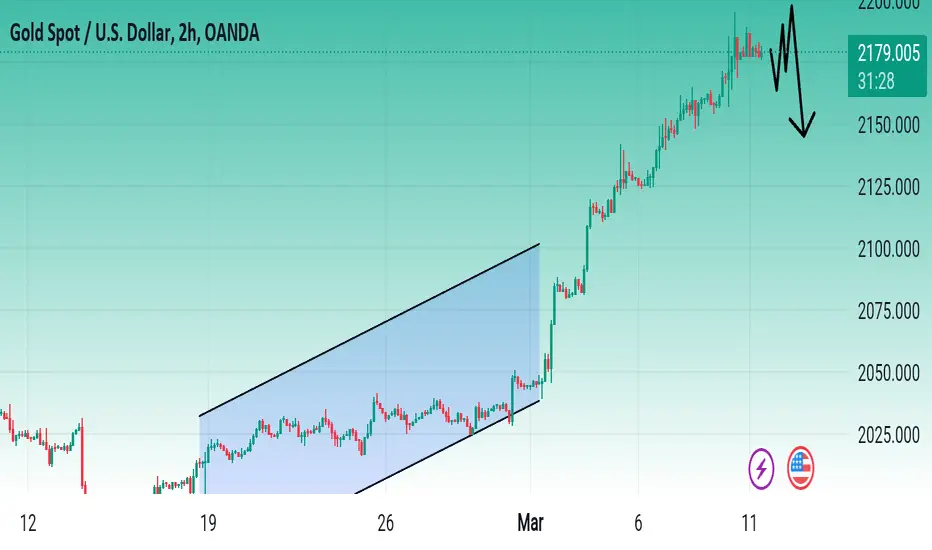
XAUUSD, Elliott wave analysis■Outlook of XAUUSD on 3D chart.
I think We are in sub-wave (3) of wave ⅲ.
Wave ⅲ, shown by the orange line, will probably become a 3rd wave extension impulse.
Sub-wave (3) is supported by two channel lines, and the trend will continue.
Last time my idea.
■Feb 13, 2024. 1M, Long-term analysis.
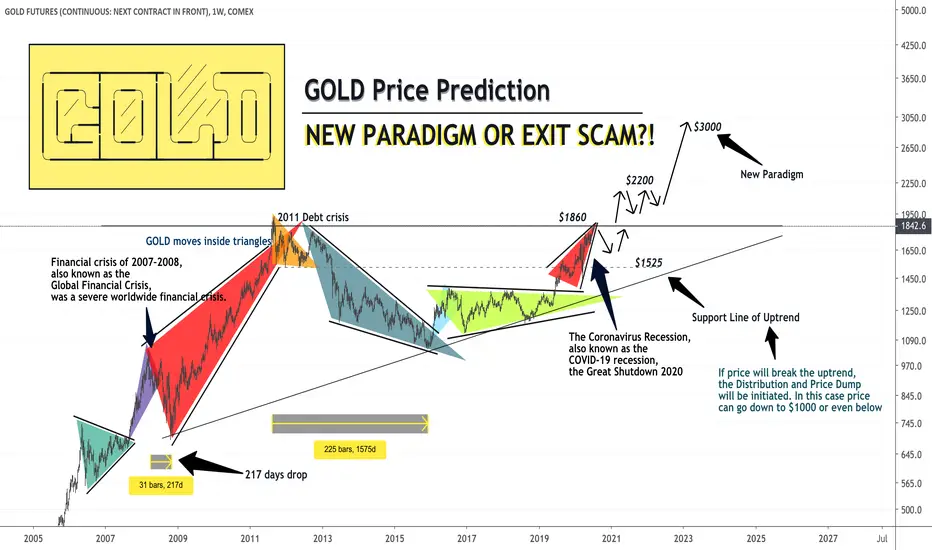
GOLD Price Prediction: NEW PARADIGM OR EXIT SCAM?!Here is the 14 years of GOLD price history and action. Looking at it we can locate a lot of triangle shaped during its movement.
📌 Nowadays we facing resistance zone of $1860 (2011-high) and this is important zone for the whole world.
Here is the chart of GOLD (XAUUSD) as pic:
Price consolidate in triangles over and over from 2007 and this is quite interesting. Now price in the upward triangle shape, which can be broken down according to 2011 same shape of triangle.
In 2011 we faced European Debt Crisis and price of gold surged down to 1000 low in 2015.
So now, price in upward triangle and what it will do next? I see very high possibility to breakdown at see small retracement, before breakout from 2011 highs $1860 reistance zone.
But there is a chances for bullish breakout now, so be careful.
There is a quite good chances for price rise over next 5-10 years to $3000.
Thanks for attention
This is Artem Crypto
GOLD (XAUUSD): "Front Rally" Continues 🥇
Multiple time frame analysis for Gold.
The speculations about the next potential resistance.
Trading plan, trading recommendations.
Thoughts.
❤️Please, support my work with like, thank you!❤️

GOLD (XAUUSD): Bullish Pattern Again?! 🥇
Multiple time frame analysis for Gold.
Price action & important key levels.
Trading recommendations.
Potential scenarios.
❤️Please, support my work with like, thank you!❤️

What you see?!Gold can face the resistance of the ascending channel at the current price and it will be pushed back. Therefore, the best offer can be to enter short position at the upper Dynamic Resistance after the collision and confirmation of the candle.
XAUUSD top-analysis todayHello traders, this is a complete multiple timeframe analysis of this pair. We see could find significant trading opportunities as per analysis upon price action confirmation we may take this trade. Smash the like button if you find value in this analysis and drop a comment if you have any questions or let me know which pair to cover in my next analysis.

Gold Sell Today Confirm Gold price (XAU/USD) struggles to capitalize on the overnight modest gains and oscillates in a narrow trading band through the early part of the European session on Tuesday. Traders opt to wait on the sidelines ahead of the release of the US Personal Consumption and Expenditure (PCE) Price Index on Friday. The crucial data might influence expectations about the Federal Reserve's (Fed) rate cut path and provide a fresh directional impetus to the non-yielding yellow metal.

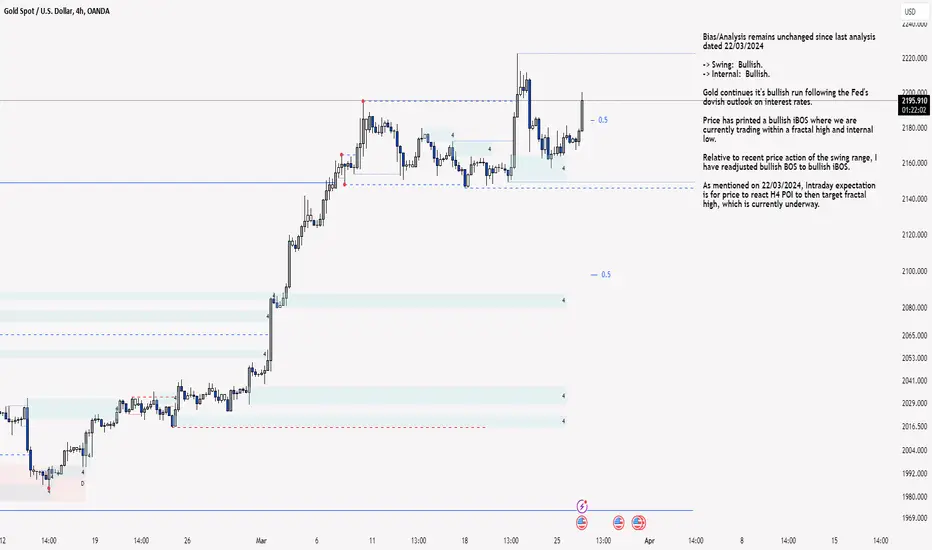
XAU/USD 26 March 2024 Intraday AnalysisH4 Analysis:
Bias/Analysis remains unchanged since last analysis dated 22/03/2024
-> Swing: Bullish.
-> Internal: Bullish.
Gold continues it's bullish run following the Fed's dovish outlook on interest rates.
Price has printed a bullish iBOS where we are currently trading within a fractal high and internal low.
Relative to recent price action of the swing range, I have readjusted bullish BOS to bullish iBOS.
As mentioned on 22/03/2024, Intraday expectation is for price to react H4 POI to then target fractal high, which is currently underway.
H4 Chart:
M15 Analysis:
-> Swing: Bullish.
-> Internal: Bullish.
-> Sub-Internal: Bullish.
Price printed a bullish iBOS followed by bullish BOS following the Fed's dovish outlook on interest rates last week.
Price printed a bearish CHoCH, indicating, but not confirming, that pullback has initiated. This is also a requirement for all HTF's
Analysis on 22/02/2024 was for price to indicate initiation of pullback by printing a bearish CHoCH which was denoted with a blue dotted line. Price printed this.
Due to the size of the internal range I plotted sub-internal range, which is denoted in red, to gain a micro-view of price action.
Sub-internal structure has now switched bullish in-line with internal and swing structure.
Intraday expectation is for price to target weak internal high which is denoted by blue dashed line.
M15 Chart:
XAUUSD Top-down analysis Hello traders, this is a complete multiple timeframe analysis of this pair. We see could find significant trading opportunities as per analysis upon price action confirmation we may take this trade. Smash the like button if you find value in this analysis and drop a comment if you have any questions or let me know which pair to cover in my next analysis.

GOLD H1 / Potential Small Retracement / Looking for a Long 💡Hello Traders!
This is My idea related to Gold H1. The bearish sentiment is still strong for short positions, that's why I will look for a long entry after I see a small retracement. I expect a confirmation of closing a FVG on a smaller timeframe.
Traders, if my proposal resonates with you or if you hold a divergent viewpoint regarding this trade, feel free to share your thoughts in the comments. I welcome the opportunity to hear your perspectives.
____________________________________
Follow, like, and comment to see my content:
tradingview.sweetlogin.com

XAUUSD Top-down analysis Hello traders, this is a complete multiple timeframe analysis of this pair. We see could find significant trading opportunities as per analysis upon price action confirmation we may take this trade. Smash the like button if you find value in this analysis and drop a comment if you have any questions or let me know which pair to cover in my next analysis.

XAUUSD top-down analysisHello traders, this is a complete multiple timeframe analysis of this pair. We see could find significant trading opportunities as per analysis upon price action confirmation we may take this trade. Smash the like button if you find value in this analysis and drop a comment if you have any questions or let me know which pair to cover in my next analysis.

Gold Sell Analysis Gold (XAU/USD) gathered bullish momentum and reached a new record high above $2,180 this week, boosted by falling US Treasury bond yields and the broad-based selling pressure surrounding the US Dollar (USD). The pair stays technically overbought ahead of next week’s key inflation data from the US.
Gold is downExpect weakness from gold. Gold will start going up when fed decides to cut rates. I expect it could happen in H2 of 2024.

XAUUSD Top-down analysis Hello traders, this is a complete multiple timeframe analysis of this pair. We see could find significant trading opportunities as per analysis upon price action confirmation we may take this trade. Smash the like button if you find value in this analysis and drop a comment if you have any questions or let me know which pair to cover in my next analysis.

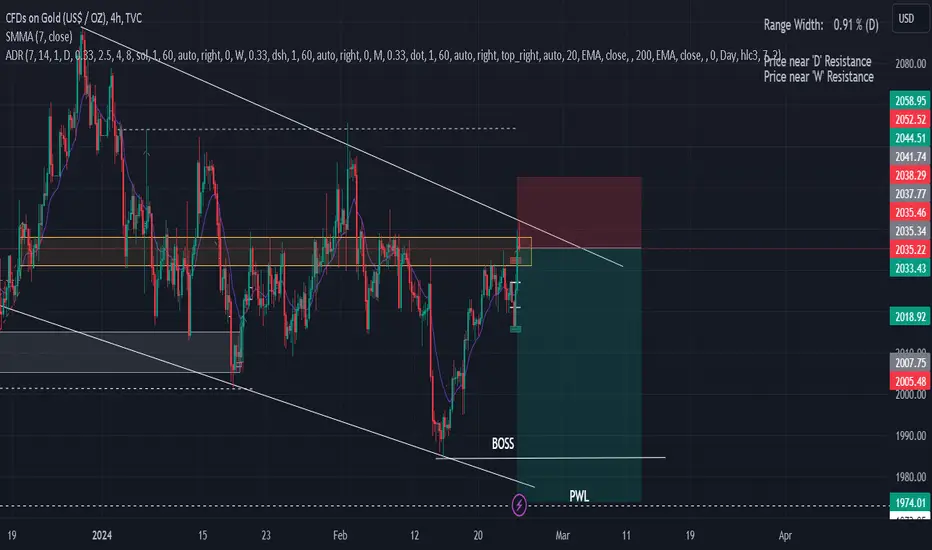
GOLD H1 / Short Trade Opportunity / Target Price 1975 ✅💲Hello Traders!
This is my idea related to GOLD H1. I see that we are in a bearish channel and at the moment, I would like to see a retracement from the resistance level. I will look for a short entry if I will see a confirmation of a bearish market structure. I expect that we will reach the PWL and my target is 1975.
Traders, if my proposal resonates with you or if you hold a divergent viewpoint regarding this trade, feel free to share your thoughts in the comments. I welcome the opportunity to hear your perspectives.
____________________________________
Follow, like, and comment to see my content:
tradingview.sweetlogin.com
GOLD (XAUUSD): Detailed Technical Analysis 🥇
Daily/4h time frames analysis on Gold.
Candlestick analysis,
price action analysis.
Bearish forecast explained.
❤️Please, support my work with like, thank you!❤️

XAUUSD Top-down analysis Hello traders, this is a complete multiple timeframe analysis of this pair. We see could find significant trading opportunities as per analysis upon price action confirmation we may take this trade. Smash the like button if you find value in this analysis and drop a comment if you have any questions or let me know which pair to cover in my next analysis.

XAUUSD Top-down analysis Hello traders, this is a complete multiple timeframe analysis of this pair. We see could find significant trading opportunities as per analysis upon price action confirmation we may take this trade. Smash the like button if you find value in this analysis and drop a comment if you have any questions or let me know which pair to cover in my next analysis.

GOLD H1 / Potential Short Trade / Valid Entry in Supply Area❗️💲Hello Traders!
This is my idea related to Gold. My previous forecast hit the target of 5R, now I expect a retracement, to the FVG and I will look for a confirmation in the supply area. The structure is still bearish, and my bias is for short entries.
Traders, if you liked my idea or if you have a different vision related to this trade, write in the comments. I will be glad to see your perspective.
____________________________________
Follow, like, and comment to see my content:
tradingview.sweetlogin.com

Gold: Don’t Slacken! 💪To follow our primary scenario, Gold must not slacken on its way further up the chart! We still expect the turquoise wave B to reach a new all-time high, which requires more (corrective) rises. However, our alternative scenario could still prevail with a probability of 40%. In this case, the turquoise wave alt.B would have already been finished with the last prominent high, and Gold would, therefore, turn down earlier to dive below the support at $1935.

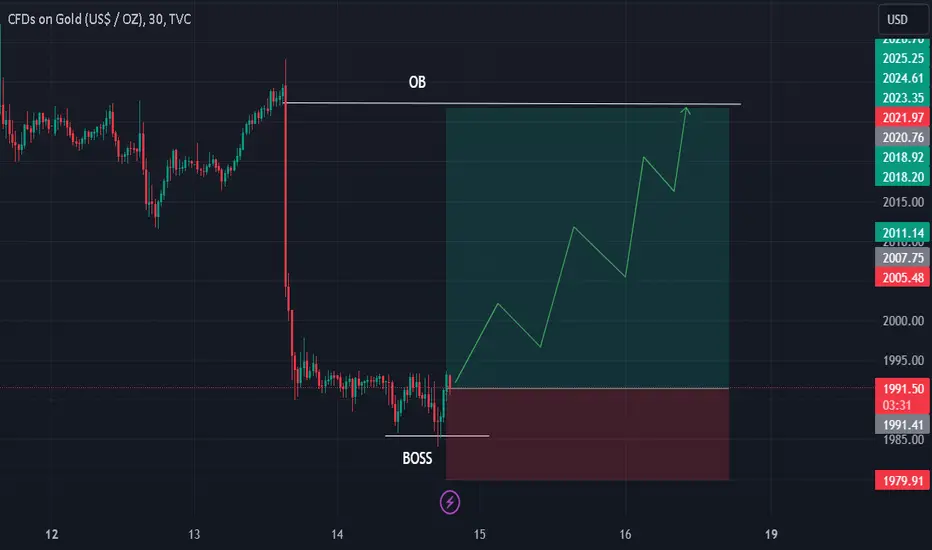
GOLD M30 / LONG TRADE EXECUTION ALERT ❗️💲Hello Traders!
This is my idea related to Gold M30. I expect a bullish move to close the FVG. The bearish sentiment on the market is still bearish, and I consider this indicator a good chance to look for long entries.
My target is under the OB level.
Traders, if you liked my idea or if you have a different vision related to this trade, write in the comments. I will be glad to see your perspective.
____________________________________
Follow, like, and comment to see my content:
tradingview.sweetlogin.com