XAUUSD Bearish SetupThe has arrived at the previous strong support zone when we expand this expand zone we see a clear FVG. Gold has tapped the FVG and started to move bearish. Plus for verification we also added the Fibonacci confluence we can enter the trade and can book some good profit.
Follow for more updates
Goldidea
XAUUSD Top-down analysis Hello traders, this is a complete multiple timeframe analysis of this pair. We see could find significant trading opportunities as per analysis upon price action confirmation we may take this trade. Smash the like button if you find value in this analysis and drop a comment if you have any questions or let me know which pair to cover in my next analysis.

XAUUSD Analysis Today : Trend Following Trading StrategyHello traders, this is a complete multiple timeframe analysis of this pair. We see could find significant trading opportunities as per analysis upon price action confirmation we may take this trade. Smash the like button if you find value in this analysis and drop a comment if you have any questions or let me know which pair to cover in my next analysis.

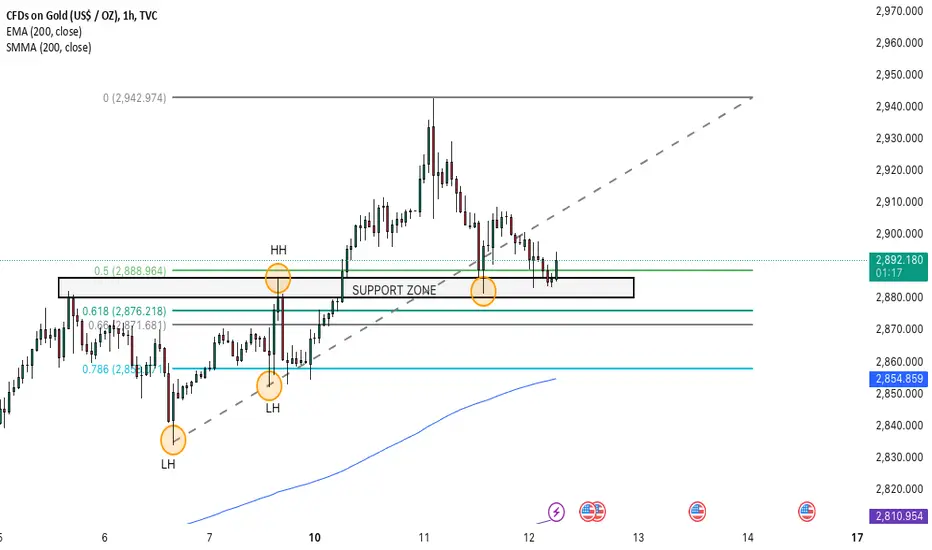
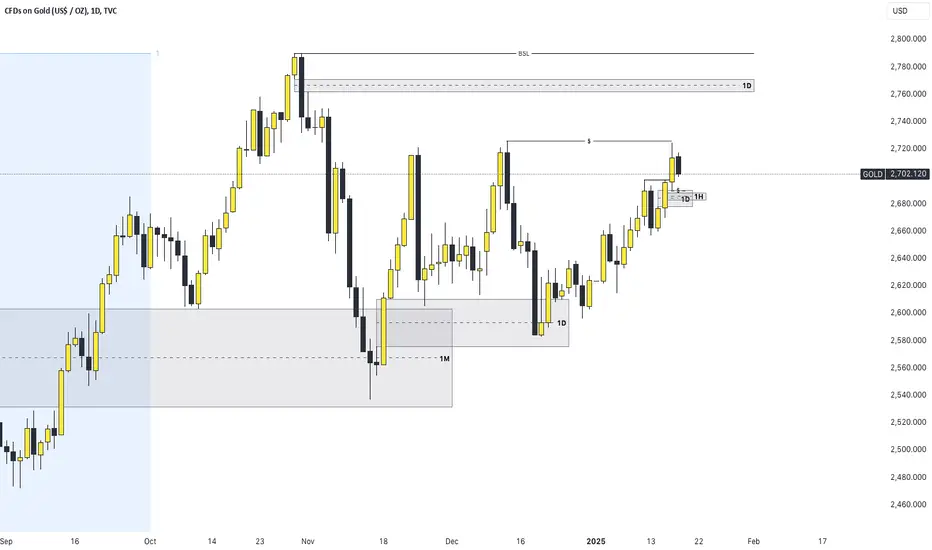
Gold price analysis February 7⭐️Fundamental Analysis
Gold prices maintained a slight upward trend in today's European trading session, hovering near the all-time high reached earlier. Safe-haven demand for gold continued to increase due to concerns about US-China trade tensions and the negative impact of the Trump administration's hawkish policies.
Meanwhile, the USD struggled as the market bet that the Fed would cut interest rates twice this year. US Treasury yields plunged, further strengthening the appeal of non-yielding gold. Investors are now focused on the US NFP employment report to determine the next trend of the market.
⭐️Technical Analysis
Gold prices continue to head towards all-time highs. The 2873 area has attracted a lot of attention from sellers before the ATH. resistance zone above note around 2898. more predicted downtrend for gold specifically a sharp fall to 2811 or deeper to 2786. pay attention to noted resistance zones for best trading strategy.

XAUUSD Top-down analysis Hello traders, this is a complete multiple timeframe analysis of this pair. We see could find significant trading opportunities as per analysis upon price action confirmation we may take this trade. Smash the like button if you find value in this analysis and drop a comment if you have any questions or let me know which pair to cover in my next analysis.

Gold trading zones: 05-Feb-2025Today's Gold trading zones: For educational purposes only. Use at your own risk.

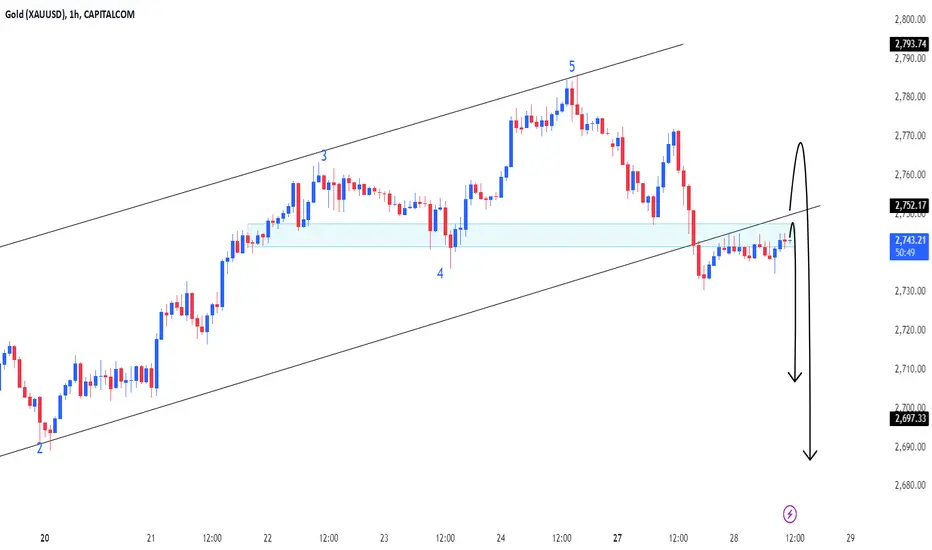
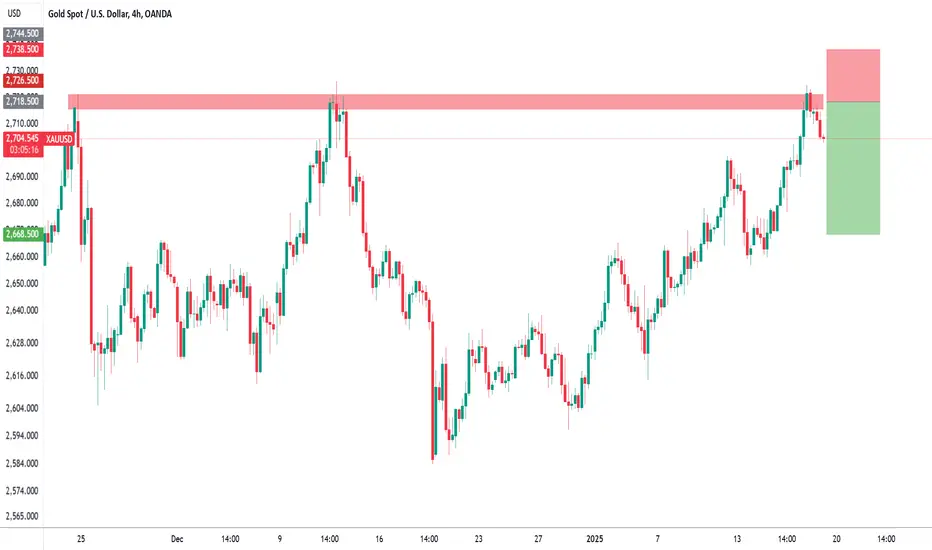
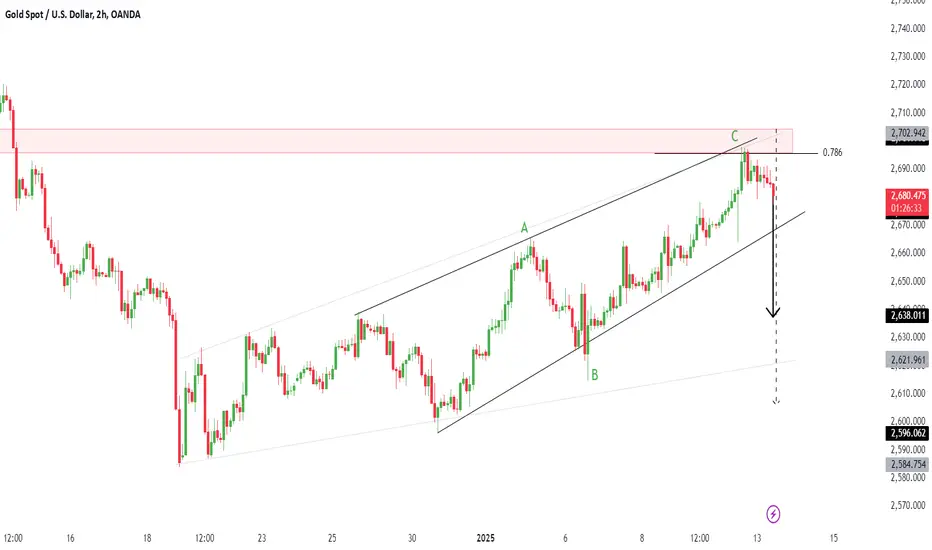
Gold Struggles at Trendline Resistance: What’s Next?Gold Weekly Analysis
Trendline Resistance:
Gold's price has repeatedly struggled to break above the rising trendline, signaling strong resistance in this area.
Support Zone Strength:
The previous resistance zone has flipped into a solid support level, providing a safety net for any pullbacks.
Next Move:
A breakout above the trendline could trigger a strong bullish continuation.
A rejection here may lead to a pullback, with support near $2,387 acting as the critical level to monitor.

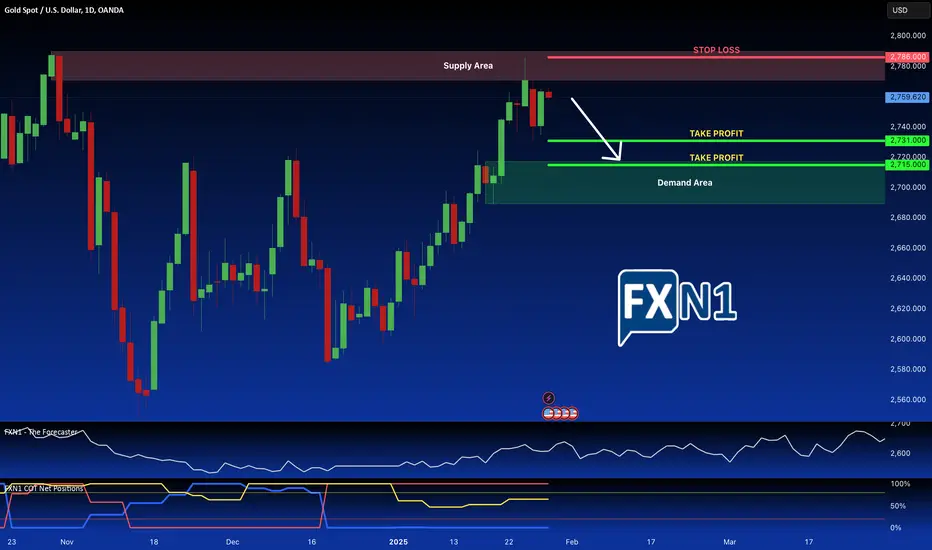
XAU: Gold's Supply Area: A Short Opportunity?As the market for gold fluctuates, there may be an opportunity to consider a speculative short position. Currently, gold appears to be retesting a supply zone, an area where selling pressure could drive prices lower. This retest may signal a shift in market sentiment, potentially leading to a retracement back to prior demand zones.
Technical Indicators: Observing price action and key technical indicators can reveal signs of weakness in gold's bullish momentum, supporting the case for a downward move.
Risk-Reward Ratio: Although taking an aggressive stance comes with risks, a well-placed stop-loss and clear profit targets can create a favorable risk-reward scenario.
Conclusion
Given these market dynamics, a speculative short position in gold, targeted at previous demand zones, could be worth considering. As always, it's essential to stay informed and manage risks effectively. What are your thoughts on this approach?
✅ Please share your thoughts about XAU in the comments section below and HIT LIKE if you appreciate my analysis. Don't forget to FOLLOW ME; you will help us a lot with this small contribution.
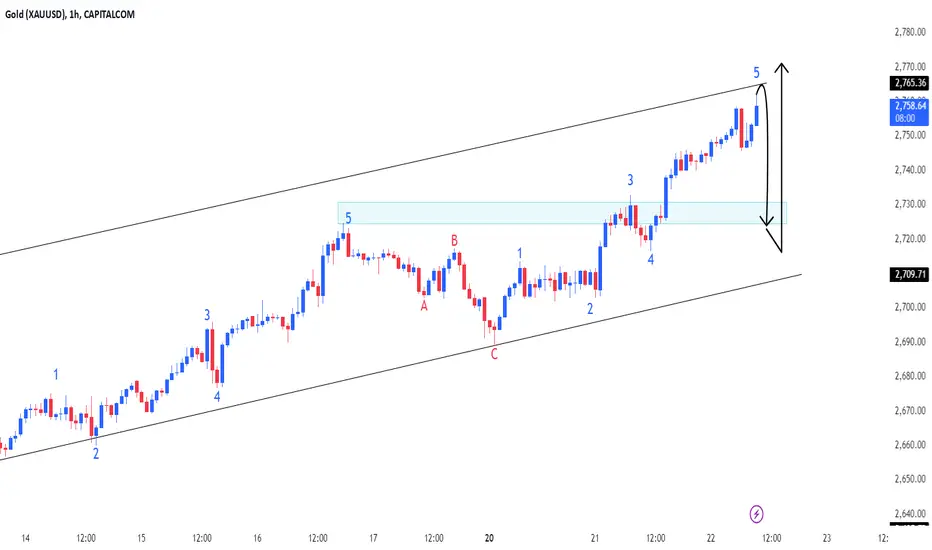
GoldXAUUSD ( Gold / U.S Dollar )
Bullish Channel as an Corrective Pattern in Short Time Frame
Change of Characteristics
Fibonacci Level - 23.80%
Completed " 12345 " Impulsive Waves and " A " Corrective Waves
Demand Zone
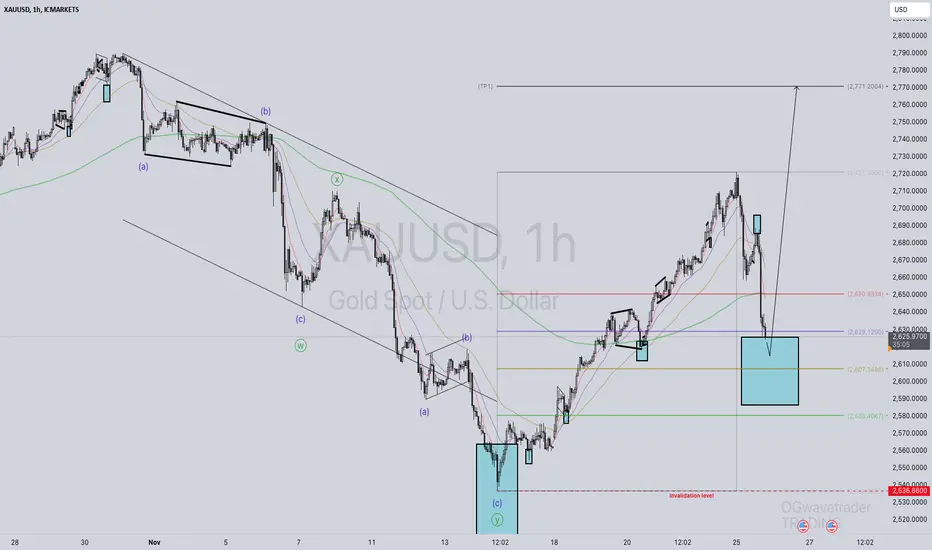
XAUUSD catch the next impulse!Hi fellow traders, XAUUSD will be ready to make a move higher from the blue box after completing the ZIGZAG correction. Let it slide deeper into the blue box and look for an entry. Target the 2771.20 level. Good luck and trade safe!
~ OGwavetrader
Gold (XAU/USD): Analyzing the 4-Hour ChartAs we delve into the gold market, it's clear that the recent economic and geopolitical developments are having a profound impact on XAU/USD. The 4-hour chart provides an insightful snapshot of the current market dynamics and potential future movements.
Currently, gold is trading at $2,760.790, reflecting a slight decrease from its opening price of $2,762.960. The highest price reached in this session was $2,763.680, with a low of $2,753.618, showing some volatility in the market. The closing price stands at $2,760.790, marking a minor decline of -0.08%.
The chart highlights several critical support and resistance levels. Resistance is noted at $2,795.558, $2,721.846, and $2,696.912, while support levels are identified at $2,790.417, $2,739.758, $2,666.224, and $2,633.618. These levels will be crucial in determining future price movements, as traders look to these points for potential reversals or continuations of the trend.
A notable feature on the chart is the upward trend channel, formed by two black trend lines. This channel indicates a bullish trend in the gold market, suggesting that prices are likely to continue their upward trajectory. However, the presence of two red arrows projecting potential future movements indicates a possible short-term correction before the trend resumes.
At the bottom of the chart, the Relative Strength Index (RSI) stands at 66.03, signaling that the market is approaching overbought conditions. This is important for traders to consider, as it may indicate a potential pullback in the near term before gold resumes its upward march.
In conclusion, the 4-hour chart of XAU/USD reveals a bullish outlook for gold, driven by the ongoing economic uncertainties and geopolitical tensions. The weakening US dollar, inflationary pressures, and safe-haven demand for gold are key factors supporting this trend. Traders should keep a close eye on the support and resistance levels, as well as the RSI, to make informed trading decisions. As always, staying informed and considering all aspects of the market will be crucial for navigating the gold market successfully.
follow for More ideas.

GoldXAUUSD ( Gold / U.S Dollar )
Fibonacci Level - 261.80%
RSI - Divergence
Break of Structure
Completed " 12345 " Impulsive Waves
Bullish Channel as an Corrective Pattern in Short Time Frame
XAUUSD Top-down analysis Hello traders, this is a complete multiple timeframe analysis of this pair. We see could find significant trading opportunities as per analysis upon price action confirmation we may take this trade. Smash the like button if you find value in this analysis and drop a comment if you have any questions or let me know which pair to cover in my next analysis.

TRUM VS GOLDAttention traders! 💥 XAUUSD is on fire, setting new highs with precision! ⚡ Check this out:
XAUUSD Insight: 📉 Locked in a fierce contest between 2700 and 2706. 🧐 Is a breakout near?
🔻 Downside Watch: 🔻 Stay cautious for potential drops if it dips below this range! 🎯 Targets: 2696
💹 Upside Watch: 💹 Look for buying signals if it rises above! 🎯 Target 2712, 2716
💬 Engage with Us: 💬 Share your thoughts as we navigate this exciting market! 📢 Let’s achieve greatness together! 🚀✨
Gold Idea 📈 Market Bias: Bullish
Analyzing the daily timeframe on Gold, we see clear signs of bullish momentum. The price action suggests a potential move upward, targeting the liquidity above the current levels.
Key insights:
✨ Liquidity Grab: Watch for price to sweep above significant highs, triggering buy-side liquidity.
✨ Daily FVG (Fair Value Gap): A critical imbalance lies above, making it a probable magnet for price action.
The narrative aligns with bullish order flow, indicating a high likelihood of continuation to fill the daily FVG. Stay patient and wait for confirmations if you're planning to enter.
💡 Trading Reminder: Always follow your trading plan and manage risk effectively. The market often surprises, so protect your capital!
What’s your bias on Gold? Bullish or bearish? Drop your thoughts below!
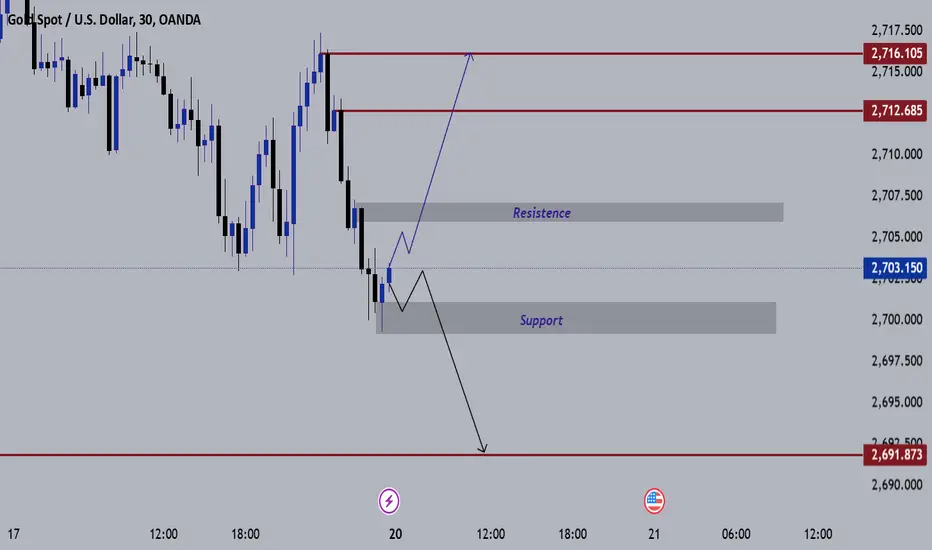
Gold to stall at previous highs?Gold - Intraday
Selling posted close to the previous high of 2726.0.
2721.3 has been pivotal.
Offers ample risk/reward to sell at the market.
Bearish divergence is expected to cap gains.
Early optimism is likely to lead to gains although extended attempts higher are expected to fail.
We look to Sell at 2718.5 (stop at 2738.5)
Our profit targets will be 2668.5 and 2658.5
Resistance: 2724.5 / 2735.0 / 2750.0
Support: 2709.7 / 2700.0 / 2690.0
Risk Disclaimer
The trade ideas beyond this page are for informational purposes only and do not constitute investment advice or a solicitation to trade. This information is provided by Signal Centre, a third-party unaffiliated with OANDA, and is intended for general circulation only. OANDA does not guarantee the accuracy of this information and assumes no responsibilities for the information provided by the third party. The information does not take into account the specific investment objectives, financial situation, or particular needs of any particular person. You should take into account your specific investment objectives, financial situation, and particular needs before making a commitment to trade, including seeking advice from an independent financial adviser regarding the suitability of the investment, under a separate engagement, as you deem fit.
You accept that you assume all risks in independently viewing the contents and selecting a chosen strategy.
Where the research is distributed in Singapore to a person who is not an Accredited Investor, Expert Investor or an Institutional Investor, Oanda Asia Pacific Pte Ltd (“OAP“) accepts legal responsibility for the contents of the report to such persons only to the extent required by law. Singapore customers should contact OAP at 6579 8289 for matters arising from, or in connection with, the information/research distributed.
XAUUSD Top-down analysis Hello traders, this is a complete multiple timeframe analysis of this pair. We see could find significant trading opportunities as per analysis upon price action confirmation we may take this trade. Smash the like button if you find value in this analysis and drop a comment if you have any questions or let me know which pair to cover in my next analysis.

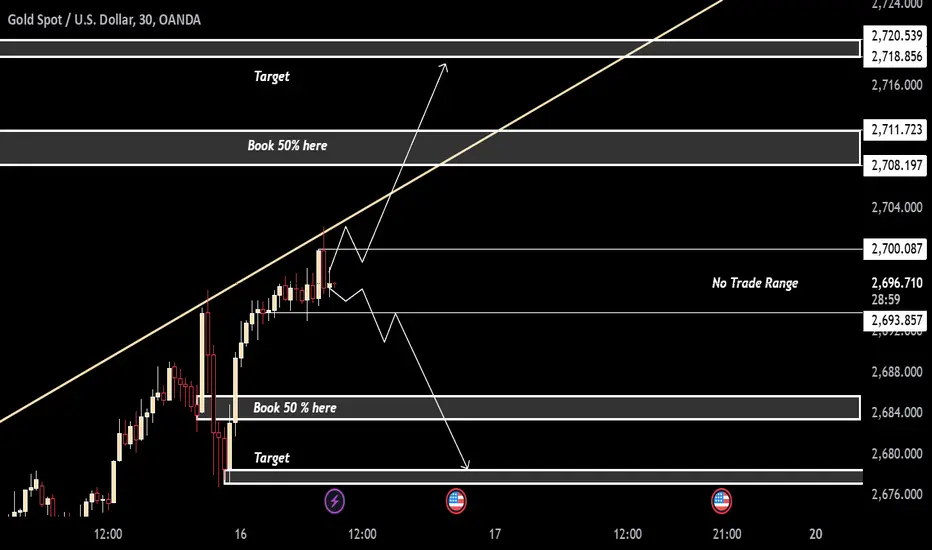
WHERE WILL GOLD MOVE?Hello my dear friends
Gold will decide its next move after breaking our "no trade range" it breaks through above our range or below
If any candle breaks and close above our range and next candle breaks its high then we can take long shot easily
Same if any candle break and close below our range and next candle breaks its low then we can take Short entry
GOOD LUCK WITH THAT !
XAUUSD Trade LogXAUUSD Daily/Monthly Long Setup
Trade Logic:
- Setup: Long position initiated within a high-confluence zone supported by multiple technical and structural factors.
- Confluence Factors:
- Daily/Monthly Buy Signal: Higher timeframe signals indicate strong bullish momentum and continuation potential.
- Trendline Support: Price has respected a long-term ascending trendline, acting as dynamic support.
- Fair Value Gap (FVG): Entry aligns with a daily FVG in a discount zone, offering a high-probability long opportunity.
- Kijun Support: Both daily and weekly Kijun lines provide additional support confluence.
- Liquidity Zone: Recent sweep of liquidity below equal lows clears the path for a bullish reversal.
- Risk-Reward Ratio (RRR):
- Stop-loss set below the trendline and daily FVG for tight risk management.
- 1:3 RRR targeting the weak high at 2,910 , with secondary targets near 3,000 for extended profits.
Macro Context:
- Market Sentiment: Safe-haven demand for gold is rising amid geopolitical and economic uncertainty, aligning with bullish technical signals.
- Dollar Weakness: Weakening USD supports upside momentum in XAUUSD.
- Volume Profile: Strong buy-side volume near key support levels indicates institutional participation.
Execution Plan:
- Long entry near the confluence zone of the trendline, FVG, and Kijun support.
- Maintain stop-loss below the daily FVG to manage risk effectively.
- First target near 2,910 , with extended targets at 3,000 for partial or full profit-taking.
- Reassess position if price closes below the trendline or invalidates the daily buy signal.
Extra Note: Monitor macroeconomic events such as interest rate announcements or geopolitical developments that could affect gold prices. Let me know if further adjustments are needed!

GoldXAUUSD ( Gold / U.S Dollar )
Completed " 12345 " Impulsive Waves and " ABC " Corrective Waves
Fibonacci Level - 78.60%
Impulse Correction
Break of Structure
Rising Wedge as an Corrective Pattern in Short Time Frame
GoldXAUUSD ( Gold / U.S Dollar )
Break of Structure
Symmetrical Triangle as an Corrective Pattern in Short Time Frame
RSI - Divergence
Change of Characteristics
Completed " 12345 " Impulsive Waves
GoldXAUUSD ( Gold / U.S Dollar )
Symmetrical Triangle with the Breakout of UTL and Retest
Strong Resistance Level
Change of Characteristics
Completed " 12345 " Impulse Waves
Bullish Channel as an Corrective Pattern in Short Time Frame
Gold next push to the upside or downside. 😌 Price has bn playing around last week high.
🫴🏻If price breaks the previous week high 2658.40 and a close above it, there's a higher probability 💯 that price is going to clear the liquidity above 2692.76 and get to the daily point of interest 2706.89 💫
🫴🏻If price did not breaks the previous week high with a candle closure above it. I am anticipating price to clear both this current week Monday's Low 2614.76 and previous week Monday's Low 2596.12.
🫵🏼 Watch out for this. The simple thing is to let price do what it wanted to and you trade what you see.
Please bost if you find this one insightful.
