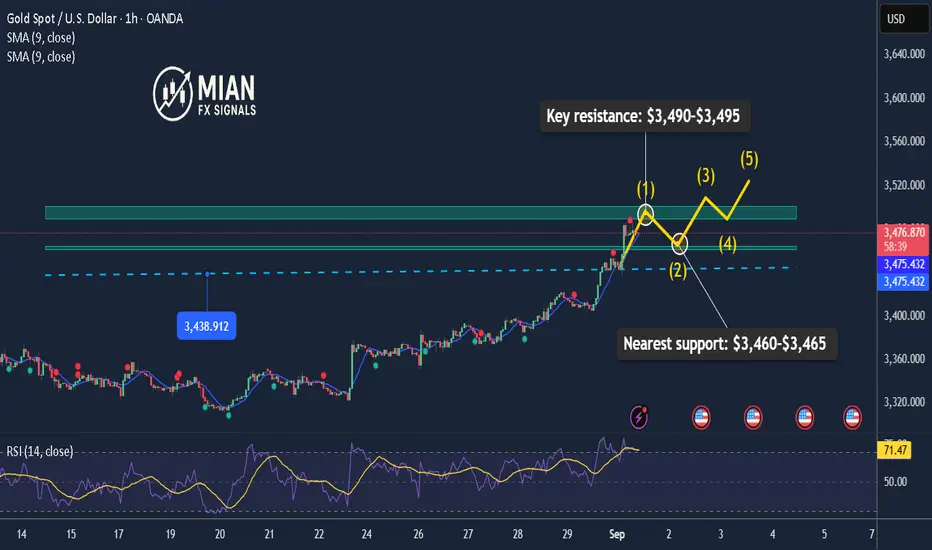
Gold Consolidates Below $3,500📊 Market Overview
Gold trades near $3,487/oz, supported by Fed rate-cut bets and a weaker USD. Traders await this week’s NFP for clearer direction.
📉 Technical Analysis
• Key resistance: $3,490–$3,500
• Nearest support: $3,465
• EMA 09: Price remains above EMA 09 → short-term uptrend still intact.
• Momentum: High RSI, signaling risk of a short-term pullback.
📌 Outlook
Gold remains in a short-term uptrend, but volatility around $3,490–3,500 will define the next move.
💡 Suggested Trading Strategy
Base Scenario
• 🔻 SELL XAU/USD at $3,490–$3,493 → TP $3,470, SL $3,496
• 🔺 BUY XAU/USD at $3,464–$3,467 → TP $3,485, SL $3,461
Goldinvesting
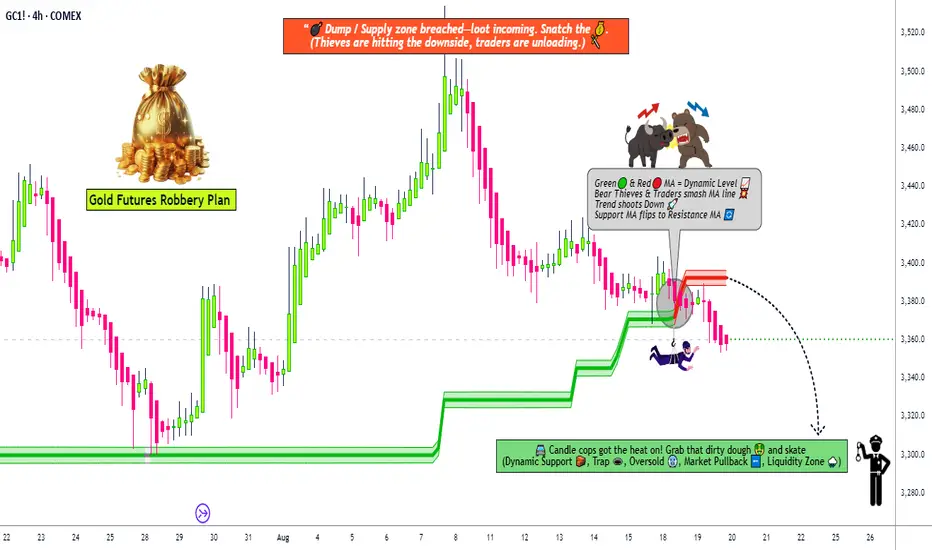
GC1! Thief Trader Mission – Short Gold, Grab the Loot🚨💰 Thief Trader Gold Heist Plan – GC1! "The Gold" Metal Market 🎭🔒
🌟Hey Robbers & Money Makers!🌟
Welcome back to another OG Thief Trader Robbery Plan — today we’re targeting the shining vault of GC1! "The Gold".
This time, the mission is BEARISH. The vault doors are heavy, but with layered sell entries, we’re breaking in! 💣💸
📜 The Plan (Swing/Day Trade)
Entry 🏴☠️: Any price level — but real thieves don’t rush! Use layered sell limit entries like a pro:
🔹 3360.0
🔹 3370.0
🔹 3380.0
(Add more layers if you’re greedy enough 👀💰)
Stop Loss 🛑: Thief SL @ 3400.0 (but remember, OG’s — adjust your SL with your own risk appetite & strategy).
Target 🎯: Police barricade spotted near 3300.0 — our final escape point is 3310.0. Grab the gold & run before the cops catch you 🚔💨.
📊 Thief Strategy 🕵️♂️
We don’t enter with just one order — layering strategy is the art of the heist. Multiple entries = multiple chances to loot the market. Scalpers & swingers both welcome to join this robbery.
📰 Thief’s Outlook (Gold Market Status)
Trend: Bearish bias 🐻
Setup: Short the rallies 🔥
Sentiment: Overloaded bulls = perfect robbery target 🎯
Fundamentals & Macros: Inflation heat & policy shifts keeping gold shaky ⚖️
⚠️ Robbery Warning 🚨
Avoid getting trapped during major news releases 📢.
Protect your loot with trailing stops 🛡️.
Never risk your whole bag on one entry — spread it thief-style.
💖 Support the crew! 💖
Follow, like, and share this heist plan with your robbery gang 🤝. The more OG’s we got, the bigger the score 💎💰.
See you after the escape, thieves — with pockets full & smiles wide 🏆🤑🐱👤
Gold Faces $3,430 Resistance – Minor Pullback Likely📊 Market Dynamics:
Following the PCE report, gold rallied sharply and is now trading around $3,427/oz, testing a major resistance zone. Buyers remain in control, but profit-taking emerges near $3,430.
📉 Technical Analysis:
• Key Resistance: $3,430 – $3,435
• Nearest Support: $3,418 – $3,415
• EMA 09: Price holds above EMA09, keeping bullish bias intact.
• Candlestick / Momentum: H1 candles show long upper wicks around $3,430 → signaling short-term selling pressure.
📌 Outlook:
A clear break above $3,430 could extend gains toward $3,440 – $3,450; failure to hold may trigger a pullback to $3,418 – $3,415.
💡 Suggested Trading Strategy:
• 🔻 SELL XAU/USD: $3,437 – $3,435
🎯 TP: 40/80/200 pips
❌ SL: $3,442
Gold Extends Rally on Rising Rate-Cut Expectations📊 Market Developments:
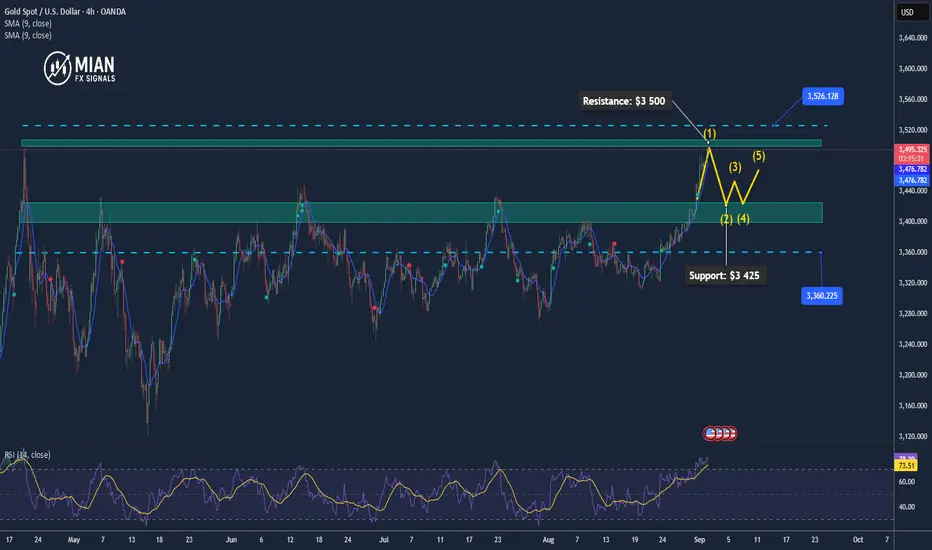
Gold hit an all-time high around $3 508/oz before easing to about $3 494/oz, driven by a weaker U.S. dollar and growing expectations for a Fed rate cut in September. Markets are pricing in roughly a 90% probability of a rate cut this month.
📉 Technical Analysis:
• Resistance: $3 500 – $3 525 – $3 560
• Support: $3 425 – $3 400
• EMA: Price remains above EMA 09 → bullish trend
• Candlestick / Momentum: Indicators (RSI, MACD, CCI) all show strong buy momentum.
📌 Outlook:
Gold is in a clear short-term uptrend. A breakout above $3 500 may lead to $3 525 – $3 560. On the downside, strong support sits around $3 425 – $3 400, ideal for potential pullback entries.
💡 Trading Strategy:
🔻 SELL XAU/USD
Entry: $3 522 – $3 525
🎯 TP: 40/80/200 pips
🛑 SL: $3 528
🔺 BUY XAU/USD
Entry: $3 425 – $3 428
🎯 TP: 40/80/200 pips
🛑 SL: $3 422
Gold Tests $3,401 – Breakout or Pullback Ahead?📊 Market Dynamics:
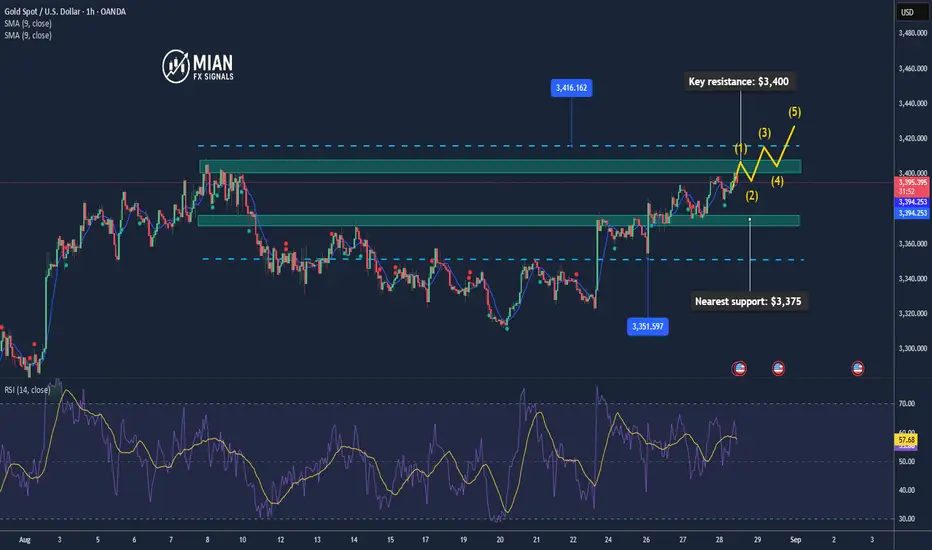
Gold is trading around $3,401/oz, testing a key technical resistance.
The upcoming U.S. PCE data is in focus, with markets pricing in over 88% probability of a 25 bps Fed rate cut, which supports bullish sentiment for gold.
RBC maintains a long-term bullish outlook, forecasting gold could reach $3,722 – $3,813 by 2025–2026.
📉 Technical Analysis:
• Resistance: $3,401 → $3,416 – $3,435
• Support: $3,374 – $3,389 (pivot $3,350 – $3,375)
• Indicators: RSI has eased from overbought; MA50 still supports short-term upside; overall MA signals: Strong Buy.
📌 Outlook:
• Above $3,401: potential extension to $3,416 – $3,435, possibly $3,440.
• Failure to break: a pullback toward $3,374 – $3,389 is possible.
💡 Trading Strategies:
🔻 SELL XAU/USD
Entry: $3,401 – $3,404
🎯 TP: 40 / 80 / 200 pips
❌ SL: $3,407
🔼 BUY XAU/USD
Entry: $3,394 – $3,398
🎯 TP: 40 / 80 / 200 pips
❌ SL: $3,391
Gold Testing 3375 – Watch for Reversal or Breakout📊 Market Overview:
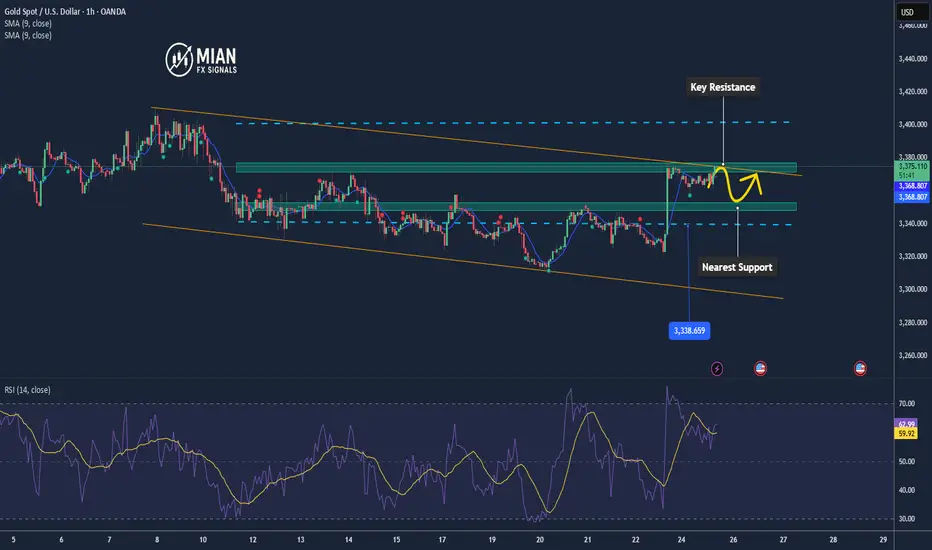
• Gold touched the $3,375 resistance zone, its highest level in two weeks, as the US dollar showed slight recovery.
• However, expectations of a Fed rate cut in September remain supportive for gold after Powell’s dovish remarks at Jackson Hole.
📉 Technical Analysis:
• Key Resistance: $3,375 – $3,378
• Nearest Support: $3,350
• EMA 09: Price trading above short-term EMA → bullish momentum intact
• Candle / Volume / Momentum: Indicators (RSI, MACD) show strong buy signals, but the 3375 level is a decisive barrier.
📌 Outlook:
Gold may continue upward if it breaks above $3,378 with strong momentum, targeting $3,392–$3,400.
If price fails at $3,375 and closes below $3,370, a short-term correction toward $3,355–$3,350 is likely.
💡 Suggested Trading Strategy:
🔻 SELL XAU/USD
Entry: $3,377 – $3,380
🎯 TP: $40/80/200 pips
🛑 SL: $3,385
🔺 BUY XAU/USD
Entry: $3,350 (support zone)
🎯 TP: $40/80/200 pips
🛑 SL: $3,344
Gold Holds Steady Amid Consolidation Phase📊 Market Overview:
Gold is holding steady around $3,342/oz, slightly lower by ~0.1% as investors await Fed Chair’s speech at the Jackson Hole symposium. Meanwhile, geopolitical risks continue to support gold as a safe-haven asset.
📉 Technical Analysis:
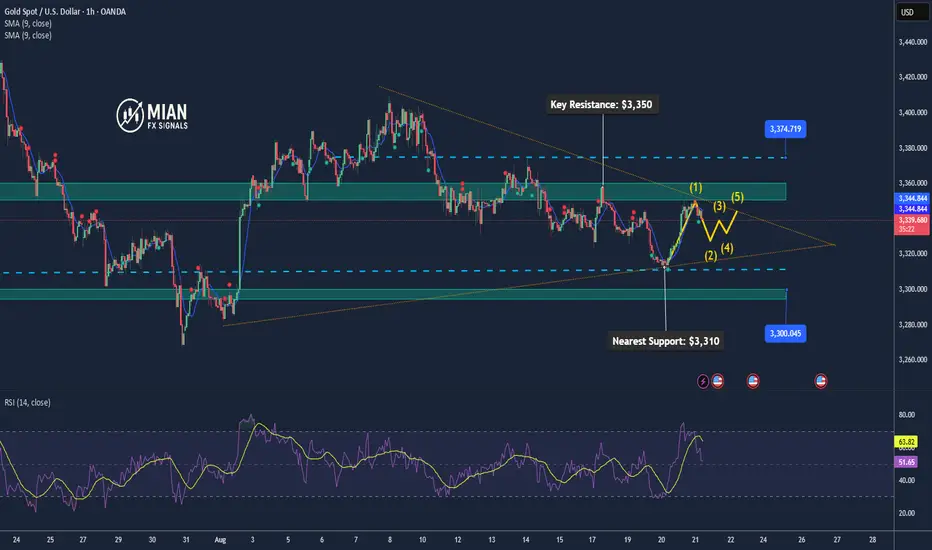
• Key Resistance: $3,350 – $3,435
• Nearest Support: $3,300 – $3,310 (100-day MA)
• EMA: Price is trading above the 100-day MA but still below the 200-hour MA, signaling short-term recovery momentum but resistance ahead.
• Candle / Momentum: Market remains in a tight consolidation range; RSI shows potential cooling before the next move.
📌 Outlook:
Gold may edge higher in the short term if the Fed signals a dovish shift (rate cut), targeting the $3,400 zone. If policy remains unchanged, gold could consolidate further or retrace toward $3,300.
💡 Trading Strategy Suggestions:
🔻 SELL XAU/USD : $3,370 - $3,373
🎯 TP: 40/80/200 pips
🛑 SL: $3,376
🔺 BUY XAU/USD : $3,310 – $3,313
🎯 TP: 40/80/200 pips
🛑 SL: $3,307
XAUUSD/BUYIt seems that bulls have seized a good opportunity. 3345 appears to have stabilized. Long positions can be more firmly established.
Buy at 3345, TP3360, SL3330
XAUUSD/BUYSure enough, gold prices rebounded after retreating to 3338, resulting in a short-term price increase of $8 per ounce.
The gold market is awaiting news to drive a rally. Just now, when it was about to hit 3350, it retreated. I interpret this as a tentative rise, as bulls are currently in control. This test is merely a test to see if bears will launch a counterattack. As expected, the bull-bear game is a tug-of-war. Both bulls and bears are now vying for the crucial 3345 level. This level serves as a short-term reversal point for the month. If bulls seize this level, the market will continue to rise. If bears seize this level, the market will experience short-term downward fluctuations.
In the latter half of the New York market, I believe the market will fluctuate within a range of approximately $10. The Swing Trading Center recommends continuing to buy.
XAUUSD/BUYAfter the New York market opened, the gold price hit 3350 before retreating. This indeed reached the profit target set by the swing trading center. The current price has retreated to 3342, but the decline has not continued. This is because the previous resistance level of 3345 has formed a certain support level after breaking through this level and then retreating. In short, the short-term focus should be on whether the 3340-3345 range stabilizes. If so, gold prices may rise again after the upcoming Federal Reserve news.
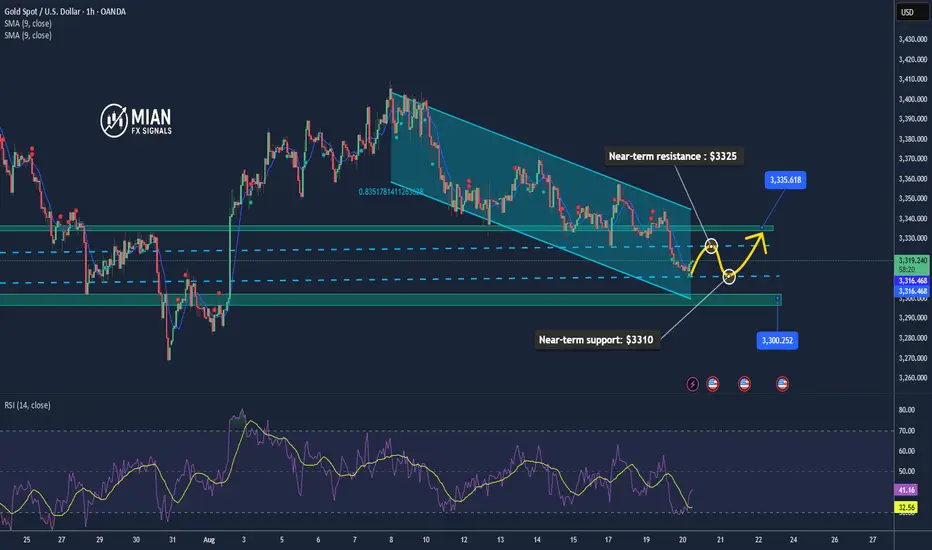
Gold Holds $3310 Support, Trading Around $3319📊 Market Overview
Gold dropped to the $3311/oz zone (near a technical bottom) and then rebounded, currently trading around $3319/oz. This indicates buying interest emerging at a key support, while overall market sentiment remains cautious ahead of Fed signals.
📉 Technical Analysis
• Near-term resistance: $3325 and $3335
• Near-term support: $3310 and $3300
• The rebound from $3311 shows that the $3310 level is acting as strong short-term support.
• EMA20 on H1 still points downward, indicating selling pressure remains, but RSI shows an oversold condition, signaling a potential short-term technical rebound.
🔎 Outlook
In the short term, gold is likely to range between $3310 – $3330. Holding above $3310 could allow price to retest $3325 – $3335. If $3310 breaks, the decline could extend toward $3300.
🎯 Suggested Trading Strategy
🔺 BUY XAU/USD
Entry: 3300 – 3297
🎯 TP: 40 / 80 / 200 pips
🛑 SL: 3394
🔻 SELL XAU/USD
Entry: 3327 – 3330
🎯 TP: 40 / 80 / 200 pips
🛑 SL: 3333
The downtrend hasn't bottomed out. Will it follow the breakout?Gold experienced a breakout on Tuesday, rebounding to a peak near 3345 before retreating under pressure. It fell to 3314 in the US session before stalling, a 41-point drop.
Overall, while the decline isn't significant, key support levels have been broken one after another, suggesting the possibility of continued breakdowns and further downside potential. The 1-hour chart also shows a relatively strong bearish trend. The slight rebound in the early Asian session could well trigger a short-term correction. Support has also shifted down to the 3300 mark, a key resistance level for a top-to-bottom reversal.
At present, the main upward pressure remains near the previous support level of 3325-3330. If the price rebounds near this position today, you can still choose to short and wait. The first target below is 3310. If the resistance in the European session is strong, then it may be necessary to adjust the short selling point. Judging from the current market situation, the bears are in a strong advantage.
Trading strategy:
Short around 3325-3330, stop loss at 3340, profit range 3310-3300.
If you're looking for a safe trade, wait for the price to stabilize above 3330 before implementing a short position strategy.
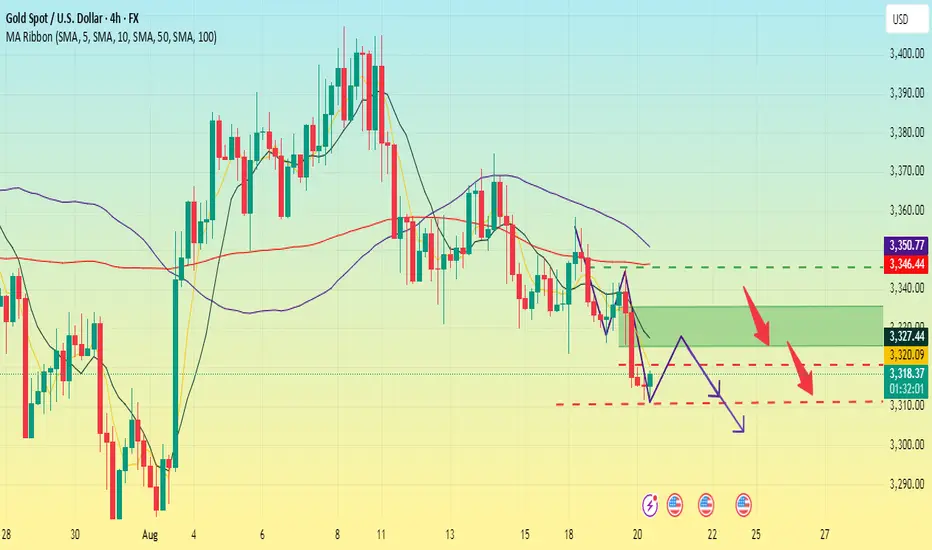
Volatility gathering momentum. A downward trend?Information Summary:
On Tuesday, the White House was finalizing the location for the Russia-Ukraine summit. As traders began betting on a possible end to the conflict, gold prices fell, hitting a new low of 3314.8, a drop of 0.51%. On Thursday, investors focused on the Federal Reserve meeting minutes, which could be a catalyst for a turnaround in gold's performance.
Market Analysis:
On Tuesday, gold rebounded slightly in the Asian session, but faced resistance at the 3345 level before retreating and fluctuating downward. The downward trend continued in the European session, with the market even breaking through the key support level of 3320, completely opening up short-term downside potential. This week has emphasized gold's weakness, and the current trend is in line with my expectations.
From the 4-hour chart, upward resistance is expected around 3330-3335. We will continue to short on a rebound to this level today, waiting for a pullback. The short-term dividing line is around 3345. If the daily chart fails to break through and stabilize above this level, we will maintain our strategy of shorting on rebounds.
Trading Strategy:
Short at 3330-3335, add to your position when it rebounds to 3340-3345, stop loss at 3350, profit range 3320-3310-3300. If it falls below 3300, hold a small position and wait for a new low.
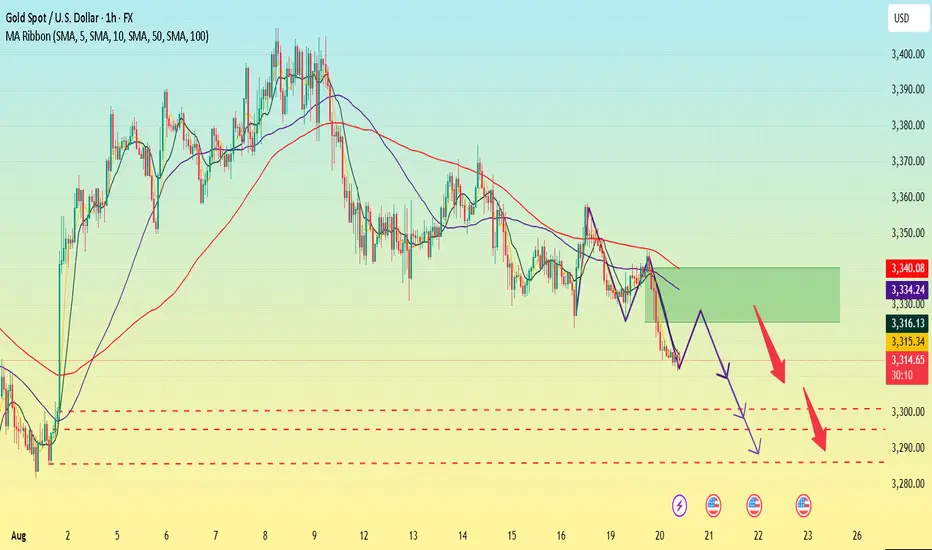
Gold's rebound is weak. Will it continue to fall?Gold prices were stable in early Asian trading on Wednesday, currently fluctuating around 3315. Gold prices experienced a surge and then decline in both of the first two trading days of this week, but the upward momentum was insufficient, preventing it from breaking through the upward pressure. This decline was driven by the combined influence of a stronger US dollar, geopolitical uncertainty, and expectations for Federal Reserve policy.
Gold prices fluctuated downward, breaking through the weekly low to set a new low. The daily chart shows a bearish trend, with the moving averages forming a downward crossover, and the Bollinger Bands opening downward in the short term.
From the 4-hour chart, the upper short-term resistance has moved downward and is currently around 3330-3335. The lower support is around 3300. The overall main tone of high-altitude participation is maintained.
Gold's 1-hour moving average is also continuing its bearish divergence, indicating that bears still have downward momentum in gold, and the rebound is beginning to weaken. If the Asian market rebound fails to break above 3330, it will be extremely weak, and any small rebound in gold will continue to be dominated by bears.
Trading Strategy:
Long around 3290, stop loss at 3280, profit range 3320-3340;
Short around 3330, stop loss at 3340, profit range 3300-3280;
Key Points:
First Support Level: 3300, Second Support Level: 3295, Third Support Level: 3285
First Resistance Level: 3325, Second Resistance Level: 3330, Third Resistance Level: 3340
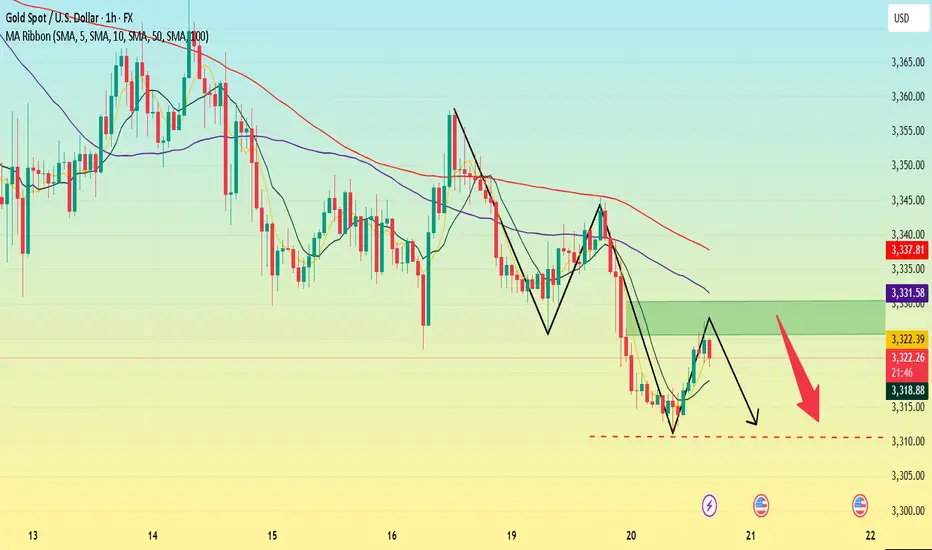
Gold Rises to 3339 – Awaiting Pullback to 3317📊 Market Overview
After dipping to 3326, gold rebounded sharply and reached 3339 in the latest session. The upside momentum came from safe-haven demand as the USD temporarily weakened. However, ahead of the Jackson Hole symposium, the market remains cautious with no clear trend established.
📉 Technical Analysis
• Key Resistance: 3338–3341 (fresh intraday top)
• Nearest Support: 3326–3328, deeper support at 3317 (major level)
• EMA: Price is trading above EMA9 on the H1 timeframe, indicating short-term bullish momentum still intact
• Candles & Momentum: Continuous bullish candles from 3326 → 3339, but limited volume suggests a potential pullback ahead
📌 Outlook
In the short term, gold is likely to face selling pressure near 3338–3341. A break below 3326 could open the way toward the key 3317 support zone for a retest of buyers’ strength.
💡 Suggested Trading Strategy
🔻 SELL XAU/USD at: 3338–3341
🎯 TP: 40/80/200 pips
🛑 SL: 3344
🔺 BUY XAU/USD at: 3317 - 3314
🎯 TP: 3332 / 3340
🛑 SL: 3311
The bulls are powerless. Continued decline?Gold hit a low near 3326 in early Asian trading. Despite repeated downward pressure to build upward momentum, it hasn't broken through. Bullish attacks have been fruitless, and the pressure from the highs has shifted downward. While it has once again bottomed out and rebounded, it still hasn't broken through the upward pressure zone. The current resistance level is around 3345, the site of Monday's rapid decline, which also represents a previous top-bottom reversal.
Analysis of the 1-hour chart shows that gold prices have fallen to the key support level of 3330-3320. The moving averages are crossing downward, with upper resistance at 3345 near the MA100. A breakout could see the second resistance level of 3350-3360. The current range is oscillating between 3320-3360. We recommend caution in chasing orders within this range and patiently wait for key entry points.
Trading strategy:
Short around 3350, cover shorts at 3360, set a stop-loss at 3370, and profit range between 3330-3320. Below this level, target 3300.
If gold falls below 3320, try a light long position around 3315, with profit range between 3340-3350.
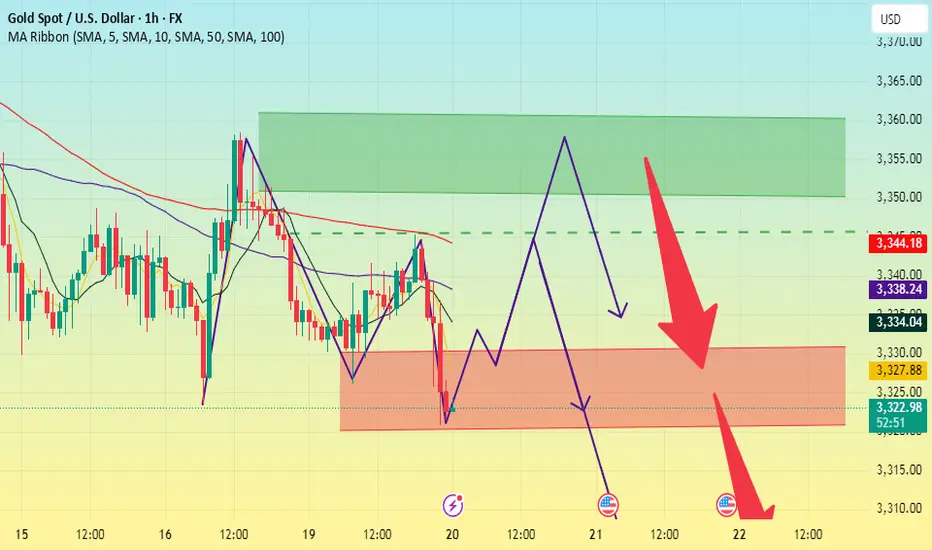
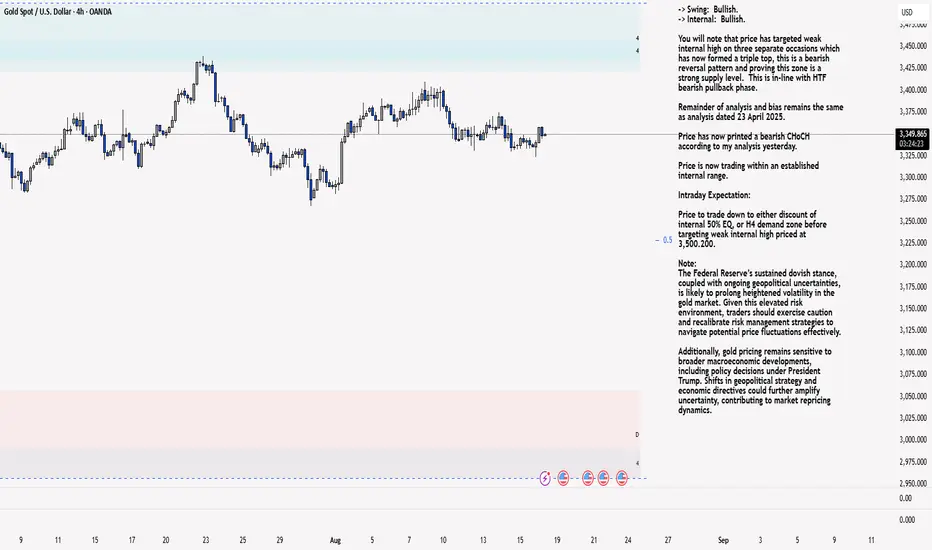
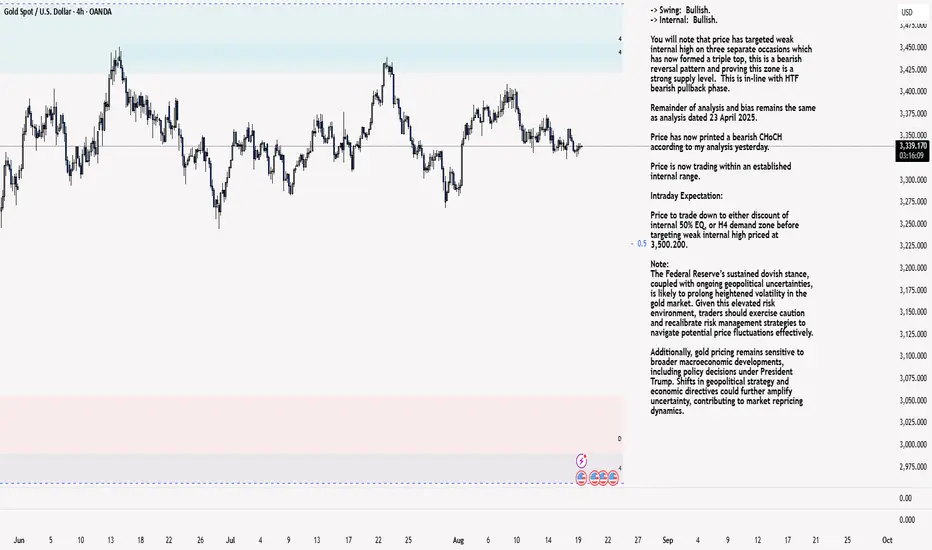
XAU/USD 19 August 2025 Intraday AnalysisH4 Analysis:
-> Swing: Bullish.
-> Internal: Bullish.
You will note that price has targeted weak internal high on three separate occasions which has now formed a triple top, this is a bearish reversal pattern and proving this zone is a strong supply level. This is in-line with HTF bearish pullback phase.
Remainder of analysis and bias remains the same as analysis dated 23 April 2025.
Price has now printed a bearish CHoCH according to my analysis yesterday.
Price is now trading within an established internal range.
Intraday Expectation:
Price to trade down to either discount of internal 50% EQ, or H4 demand zone before targeting weak internal high priced at 3,500.200.
Note:
The Federal Reserve’s sustained dovish stance, coupled with ongoing geopolitical uncertainties, is likely to prolong heightened volatility in the gold market. Given this elevated risk environment, traders should exercise caution and recalibrate risk management strategies to navigate potential price fluctuations effectively.
Additionally, gold pricing remains sensitive to broader macroeconomic developments, including policy decisions under President Trump. Shifts in geopolitical strategy and economic directives could further amplify uncertainty, contributing to market repricing dynamics.
H4 Chart:
M15 Analysis:
-> Swing: Bullish.
-> Internal: Bullish.
H4 Timeframe - Price has failed to target weak internal high, therefore, it would not be unrealistic if price printed a bearish iBOS.
The remainder of my analysis shall remain the same as analysis dated 13 June 2025, apart from target price.
As per my analysis dated 22 May 2025 whereby I mentioned price can be seen to be reacting at discount of 50% EQ on H4 timeframe, therefore, it is a viable alternative that price could potentially print a bullish iBOS on M15 timeframe despite internal structure being bearish.
Price has printed a bullish iBOS followed by a bearish CHoCH, which indicates, but does not confirm, bearish pullback phase initiation. I will however continue to monitor, with respect to depth of pullback.
Intraday Expectation:
Price to continue bearish, react at either M15 supply zone, or discount of 50% internal EQ before targeting weak internal high priced at 3,451.375.
Note:
Gold remains highly volatile amid the Federal Reserve's continued dovish stance, persistent and escalating geopolitical uncertainties. Traders should implement robust risk management strategies and remain vigilant, as price swings may become more pronounced in this elevated volatility environment.
Additionally, President Trump’s recent tariff announcements are expected to further amplify market turbulence, potentially triggering sharp price fluctuations and whipsaws.
M15 Chart:
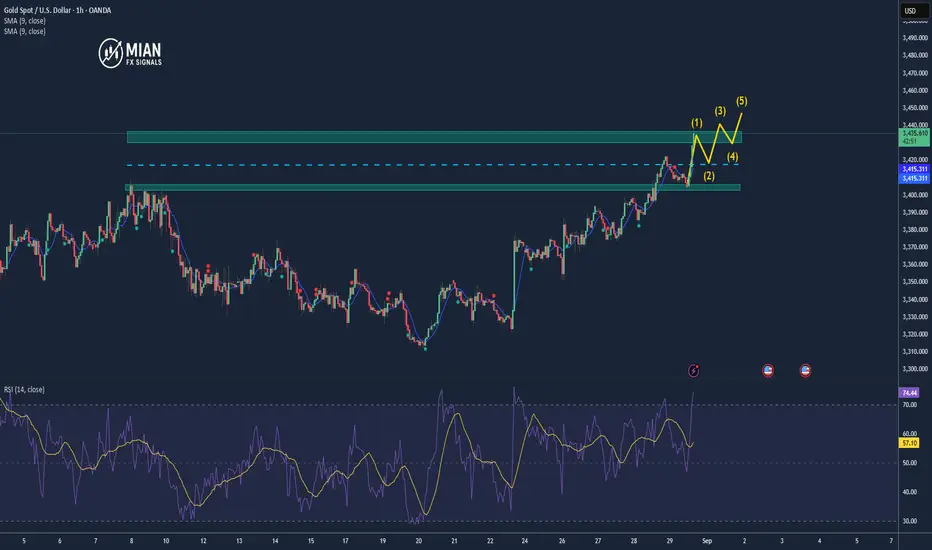
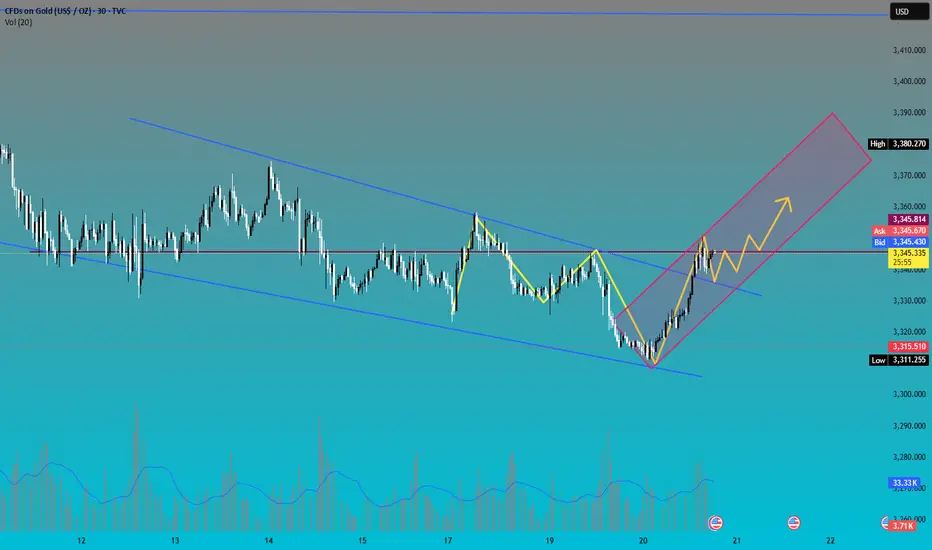
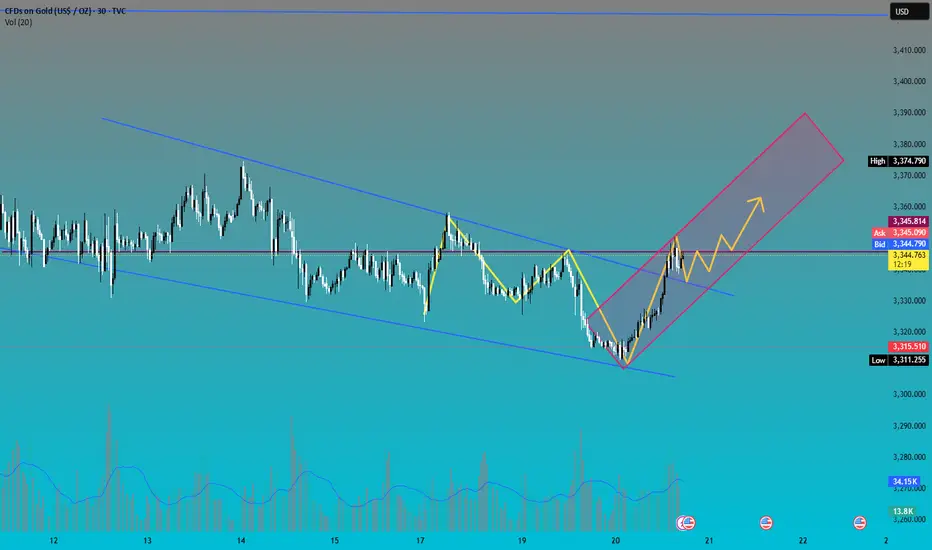
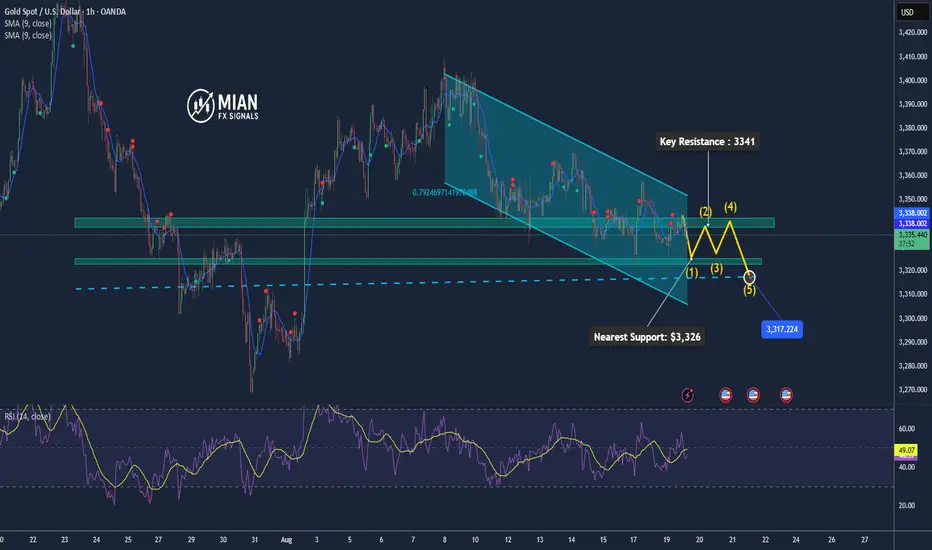
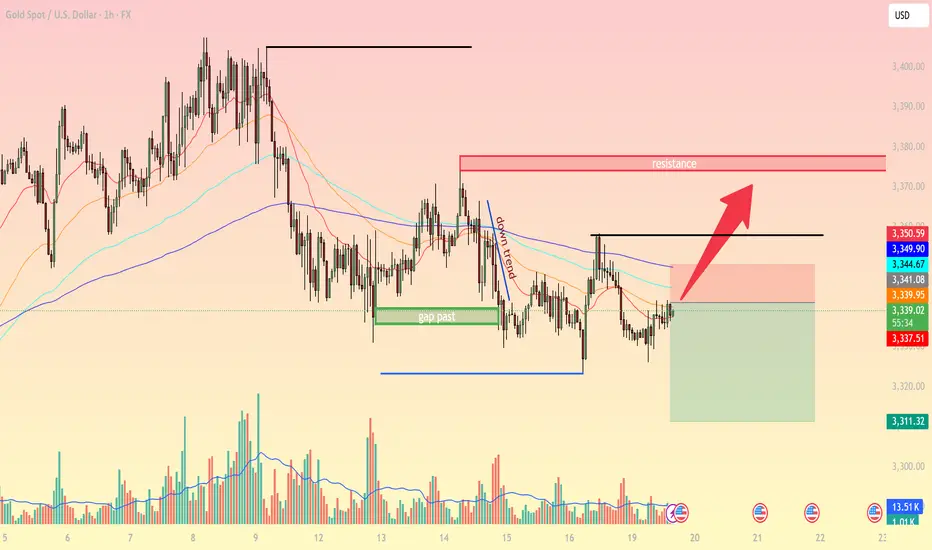
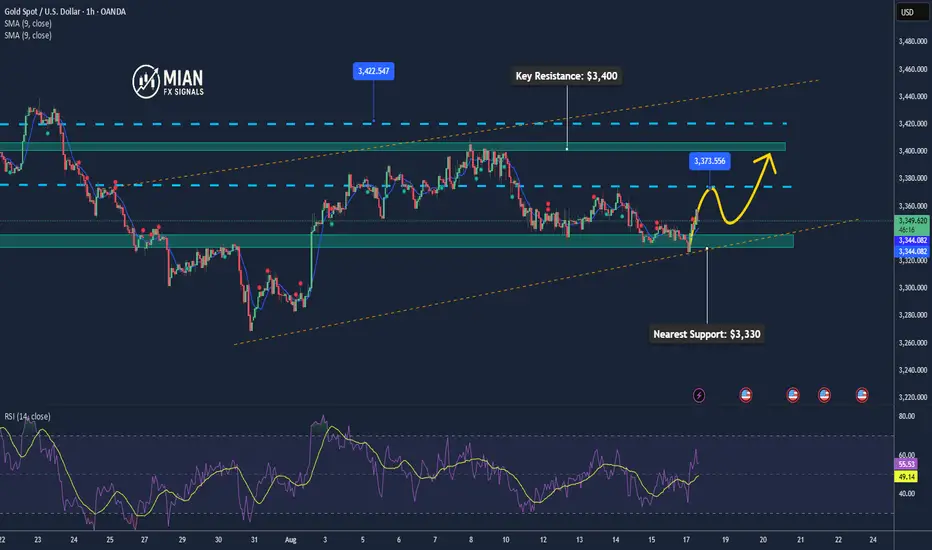
XAUUSD Intraday Analysis (1H) – August 19On the H1 timeframe, gold (XAUUSD) is showing signs of recovery after the recent sharp decline. Let’s break down the key technical factors:
1. Price Action & Trend
After a strong selloff and gap fill, price bounced from the 3311 support area.
Currently, XAUUSD is testing the confluence zone of short-term EMAs (20–50–100), which will determine whether the bullish momentum can extend.
Market structure suggests a potential corrective rally toward resistance.
2. Key Technical Levels
Immediate Support: 3330 – 3335 (EMA20 + local consolidation).
Major Support: 3311 (recent swing low + Fibonacci extension).
Near-term Resistance: 3349 – 3350 (EMA100 + recent rebound high).
Strong Resistance: 3375 – 3380 (supply zone + structural resistance).
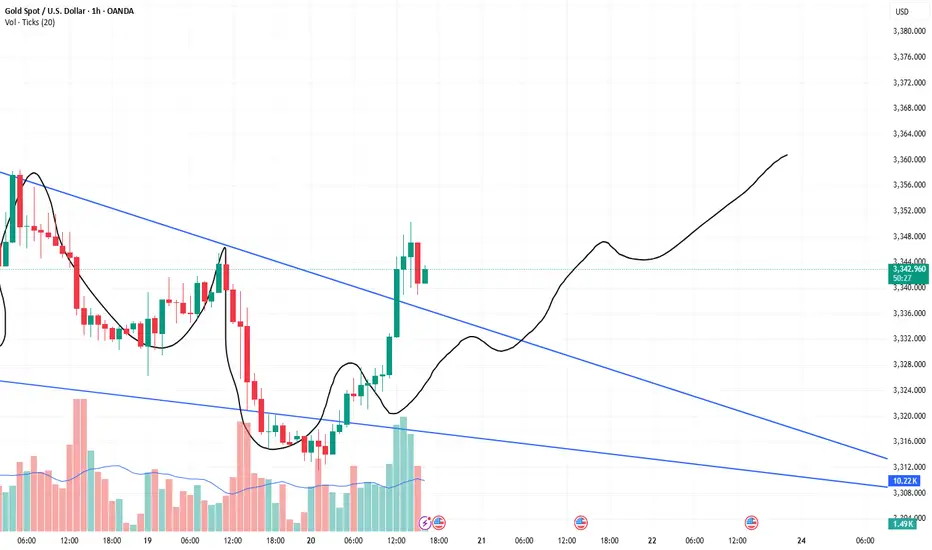
3. Indicators
EMA: Price is attempting to reclaim EMA20/50; holding above 3340 could trigger further upside.
RSI (H1): Recovering from oversold territory, signaling bullish momentum.
Volume: Strong buying volume appeared at the recent low – an early sign of buyers stepping back in.
4. Trading Strategies
Scenario 1 (Short-term Long Setup):
Entry: 3335 – 3340 (if price sustains above EMA20).
TP1: 3350
TP2: 3375 – 3380
SL: below 3325
Scenario 2 (Sell from Resistance):
If price reaches 3375 – 3380 and forms bearish rejection signals, consider short entries.
TP: 3340 – 3330
SL: above 3385
5. Conclusion
Gold is currently in a corrective recovery phase. While the broader trend remains bearish, a rebound toward 3350 – 3380 is highly possible before the next directional move. This resistance zone will be critical for the next trading decisions.
Follow for more high-probability setups and detailed multi-timeframe strategies.
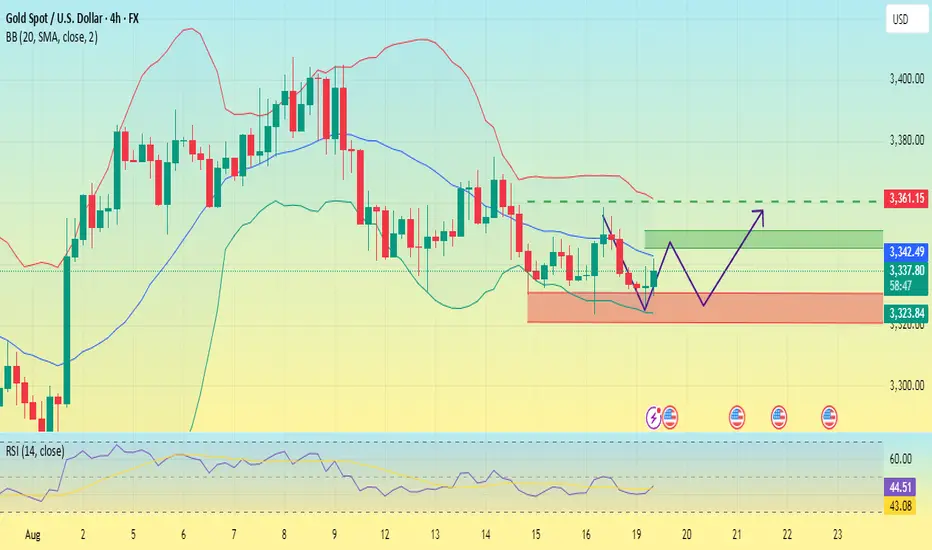
Gold Is Consolidating in the Short Term📊 Market Developments:
Spot gold is hovering around $3,337/oz, as investors await Fed Chair Powell’s remarks at the Jackson Hole symposium (Aug 21–23) for signals on possible rate cuts. Meanwhile, geopolitical updates on U.S. diplomacy in Ukraine also influence sentiment.
📉 Technical Analysis:
• Key Resistance: $3,380/oz
• Nearest Support: $3,330–$3,335/oz
• EMA 09: Price is consolidating near support, no clear direction yet.
• Candlestick / Volume / Momentum: Neutral, waiting for fresh catalysts.
📌 Outlook:
Gold may range or edge higher short-term if the Fed signals dovishness. Otherwise, a pullback toward support remains likely.
________________________________________
💡 Trading Strategy Suggestion:
🔻 SELL XAU/USD at: $3,377–$3,380
🎯 TP: 40/80/200 pips
🛑 SL: $3,383
🔺 BUY XAU/USD at: $3,330–$3,333
🎯 TP: 40/80/200 pips
🛑 SL: $3,327
Peace Signal. A New Trend?Event Summary:
On Monday, US time, after several hours of talks with Ukrainian President Volodymyr Zelensky and other European leaders, Trump contacted Putin, attempting to organize a trilateral meeting to end the Russia-Ukraine conflict.
Trump stated that after the meeting, he spoke with Putin and began arranging a meeting between Putin and Zelensky, the location of which is yet to be determined. The US hopes to facilitate a meeting between Putin and Zelensky before the end of August.
This Friday, Powell will speak at the Jackson Hole Fed annual meeting. Such events are most likely to trigger new market fluctuations. Therefore, gold is likely to be bearish before the annual meeting.
Market Analysis:
After falling below 3355 in Asian trading on Monday, gold has so far experienced multiple pullbacks to build momentum towards the 3350-3360 resistance range, but has been unable to break through and maintain its position. It has repeatedly fallen under downward pressure and continued to create new lows.
Looking at the 1-hour chart, gold has been trading below the middle Bollinger Band in the short term, with the RSI indicator below the mid-axis, indicating a relatively flat trend. Gold is still in a weak market.
Trading Strategy:
Short around 3345-3350, with a stop-loss at 3360. Profit range: 3330-3320.
Long around 3315, with a stop-loss at 3305. Profit range: 3340-3350-3360.
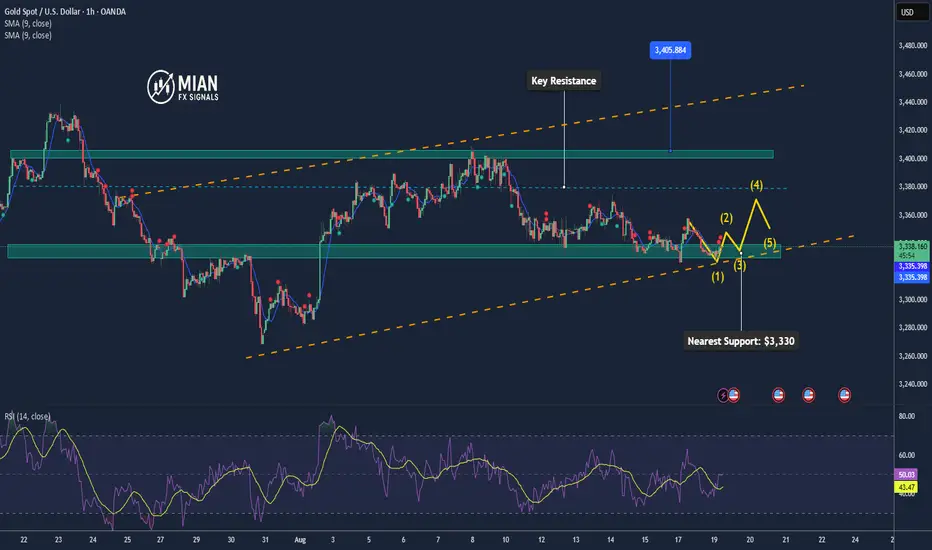
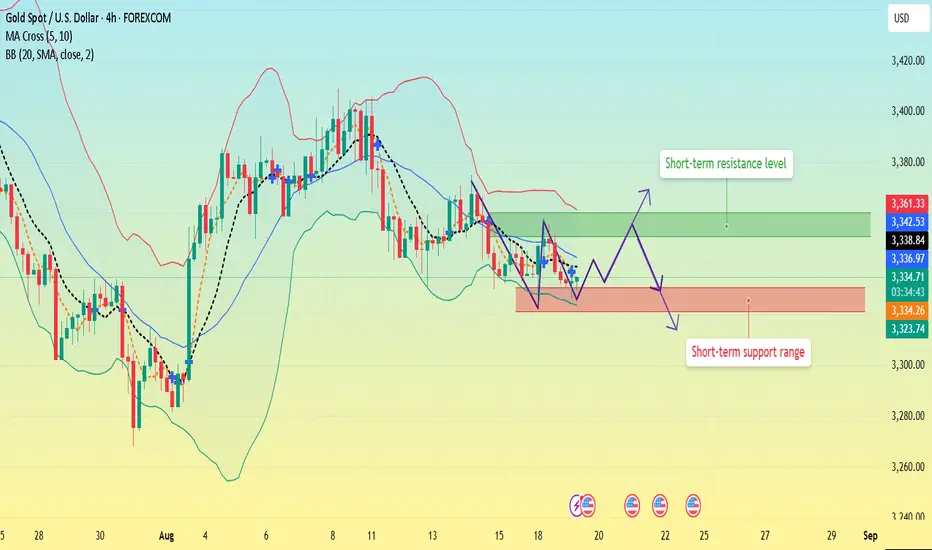
Gold prices fluctuated downward. Waiting for a breakout?Spot gold is currently trading around 3332 in Tuesday's Asian session. Concerns about the situation between Russia and Ukraine led to a brief rebound to around 3358. However, growing expectations of peace have directly dampened gold's safe-haven demand, leading to the price reversal of all gains.
On the 4-hour chart, the 5- and 10-day moving averages are trending downward. Gold prices remained below the middle Bollinger Band during Tuesday's Asian session. A short-term upward trend followed by a decline has formed, maintaining trading within the lower and middle Bollinger Bands.
Recent price action has formed a clear triangle consolidation range, which has persisted for a significant period, seemingly accumulating momentum for a subsequent major rally. Upper resistance remains stable around 3350-3360, while lower support lies in the 3330-3320 range.
On the whole, if the gold price can break through 3360 and stabilize above this position, it is likely to start a rebound and give the market hope of an upward trend; on the contrary, if it falls below 3320 US dollars, the short-selling force may be further released, accelerating the price decline, and market sentiment will also be affected.
Gold Recovers as Rate-Cut Hopes Strengthen📊 Market Summary:
• Gold (XAU/USD) rose slightly +0.5% to ~$3,350.55/oz, supported by growing expectations of Fed rate cuts and lower U.S. bond yields, which boosted safe-haven demand.
• However, easing geopolitical tensions have reduced strong safe-haven flows, putting mild pressure on gold.
📉 Technical Analysis:
• Resistance Levels:
• $3,400 – immediate resistance
• $3,420 – next key resistance if $3,400 is broken
• Support Levels:
• $3,330–$3,335 – strong support zone
• $3,310 – secondary support if $3,330 fails
• EMA & MAs: Price is holding above most short-term EMAs/MAs (MA5, MA10, MA20 → bullish; only MA200 remains bearish) → trend still bullish.
• Momentum Indicators: RSI ~62 (positive), Stoch & MACD remain bullish, ADX ~30 confirms a relatively strong trend.
📌 Outlook:
• Short-term: Gold could retest $3,400–$3,420 if dovish Fed signals and low yields persist.
• Risk: A hawkish Fed tone or easing geopolitical risks could drag gold back down toward $3,330 and possibly $3,310.
💡 Trade Strategy:
🔺 BUY XAU/USD: $3,330–$3,333
🎯 TP: 40/80/200 pips
❌ SL: $3327
🔻 SELL XAU/USD : $3,402–$3,405
🎯 TP: 40/80/200 pips
❌ SL: $3,408
XAU/USD 18 August 2025 Intraday AnalysisH4 Analysis:
-> Swing: Bullish.
-> Internal: Bullish.
You will note that price has targeted weak internal high on three separate occasions which has now formed a triple top, this is a bearish reversal pattern and proving this zone is a strong supply level. This is in-line with HTF bearish pullback phase.
Remainder of analysis and bias remains the same as analysis dated 23 April 2025.
Price has now printed a bearish CHoCH according to my analysis yesterday.
Price is now trading within an established internal range.
Intraday Expectation:
Price to trade down to either discount of internal 50% EQ, or H4 demand zone before targeting weak internal high priced at 3,500.200.
Note:
The Federal Reserve’s sustained dovish stance, coupled with ongoing geopolitical uncertainties, is likely to prolong heightened volatility in the gold market. Given this elevated risk environment, traders should exercise caution and recalibrate risk management strategies to navigate potential price fluctuations effectively.
Additionally, gold pricing remains sensitive to broader macroeconomic developments, including policy decisions under President Trump. Shifts in geopolitical strategy and economic directives could further amplify uncertainty, contributing to market repricing dynamics.
H4 Chart:
M15 Analysis:
-> Swing: Bullish.
-> Internal: Bullish.
H4 Timeframe - Price has failed to target weak internal high, therefore, it would not be unrealistic if price printed a bearish iBOS.
The remainder of my analysis shall remain the same as analysis dated 13 June 2025, apart from target price.
As per my analysis dated 22 May 2025 whereby I mentioned price can be seen to be reacting at discount of 50% EQ on H4 timeframe, therefore, it is a viable alternative that price could potentially print a bullish iBOS on M15 timeframe despite internal structure being bearish.
Price has printed a bullish iBOS followed by a bearish CHoCH, which indicates, but does not confirm, bearish pullback phase initiation. I will however continue to monitor, with respect to depth of pullback.
Intraday Expectation:
Price to continue bearish, react at either M15 supply zone, or discount of 50% internal EQ before targeting weak internal high priced at 3,451.375.
Note:
Gold remains highly volatile amid the Federal Reserve's continued dovish stance, persistent and escalating geopolitical uncertainties. Traders should implement robust risk management strategies and remain vigilant, as price swings may become more pronounced in this elevated volatility environment.
Additionally, President Trump’s recent tariff announcements are expected to further amplify market turbulence, potentially triggering sharp price fluctuations and whipsaws.
M15 Chart: