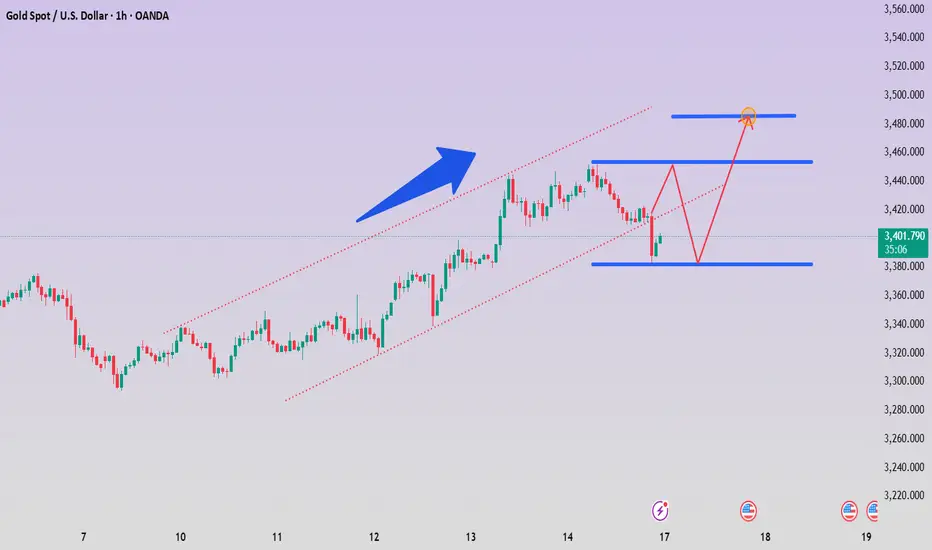
Iran releases easing signals, gold is still bullish
📣Golden News
1. Iran sends a signal of easing. U.S. media reported that under the pressure of Israeli air strikes, Iran has used Arab intermediaries to send a peace signal to the United States and Israel - asking the United States not to carry out air strikes as a prerequisite for restarting nuclear negotiations, and emphasizing to Israel that controlling violence is in the common interest.
2. Israel's firm stance. Israeli warplanes fly freely over the Iranian capital, and Iran's counterattack is ineffective. Israel is still focused on dismantling Iran's nuclear facilities and weakening its theocratic regime, and there is no motivation to cease fire in the short term.
3. Gold's reaction and strategy. Iran's peace proposal caused the price of gold to plummet to as low as $3,382. However, since the situation in the Middle East has not eased significantly, it is recommended to buy on dips and pay attention to the support level of $3,400. ⭐️Set gold price:
🔥Sell gold area: 3465-3475 SL 3485
TP1: 3450 USD
TP2: 3440 USD
TP3: 3430 USD
🔥Buy gold area: 3390-3388 USD SL 3383 USD
TP1: 3400 USD
TP2: 3410 USD
TP3: 3422 USD
Goldinvesting
Gold continues to rise! When will the price of gold fall?Market news:
In early Asian trading on Monday (June 16), London gold prices continued to rise last week, hitting a nearly seven-week high of $3,451/ounce, as Israel and Iran launched a new round of attacks on each other on Sunday (June 15), exacerbating market concerns that escalating wars may trigger wider regional conflicts, and international gold continued to receive support from safe-haven buying.The continued rise of gold during the conflict depends on whether it is in a bull market and whether the conflict is likely to escalate. The inflow of funds into gold stock ETFs shows an increase in retail interest, especially silver outperforming spot gold, suggesting that market sentiment is turning. In addition to the geopolitical situation, this week will also usher in the test of the US retail sales monthly rate (commonly known as "terror data") and the Federal Reserve's interest rate decision.This trading day also needs to pay attention to the US New York Fed Manufacturing Index in June and the G7 Leaders' Summit, and pay attention to China's May total retail sales of consumer goods and China's May industrial added value annual rate.
Technical Review:
The technical price of gold is in good condition with the buying structure of the trend. The MA10/7/5-day moving averages on the daily chart remain open upward, the RSI indicator is hooked upward, and the price is running in the upper and middle track of the Bollinger Bands. The moving average system of the short-term four-hour chart maintains a golden cross opening upward, the price gradually moves up from the high point of the MA10-day moving average, and the Bollinger Bands remain open upward in the same hourly chart. Affected by the market fundamentals, gold has triggered risk aversion.The price of gold continues to rise, and the graphics of various time periods have formed obvious and strong support. In the daily chart, gold fell back to the trend line support after the triangle convergence breakthrough, and ushered in a rising trend again. In the short term, the upward momentum of gold is still strong. Based on the last round of retracement low of $3120 as the starting point of the wave structure, the push of the third wave may cause the price of gold to rise to $3600-3640. Combined with the current fundamentals, news and geopolitical situation, the medium- and long-term upward trend of gold is far from over.
Today’s analysis:
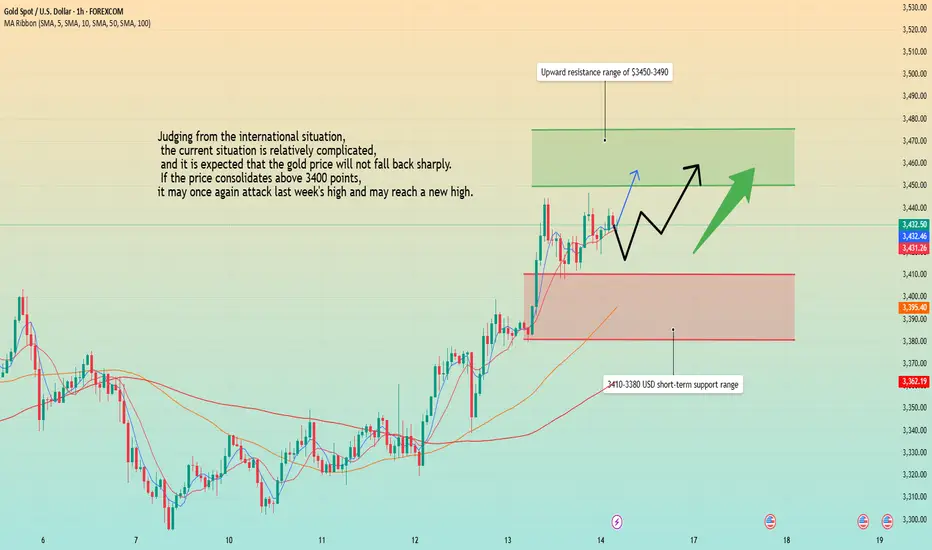
At present, the entire market is still affected by the geopolitical risks in the Middle East. Gold has been at a high level for a long time. If there is no turning point, the gold price will continue to remain above 3400 today. We will have the opportunity to see the gold price refresh the historical high of 3500 again today or tomorrow, and the probability is also very high. Then our operation idea is to buy to the end before the trend changes!
The trend of the gold one-hour market is still strong. From the short-term trend, it continues to maintain a high-level shock pattern, and the low point continues to rise. The high point has been continuously broken. Although the high opening and high movement of the Asian market failed to be directly continued, the high and fall back just gave us the opportunity to buy in!
Operation ideas:
Buy short-term gold at 3420-3423, stop loss at 3411, target at 3450-3470;
Sell short-term gold at 3468-3471, stop loss at 3480, target at 3420-3400;
Key points:
First support level: 3423, second support level: 3410, third support level: 3392
First resistance level: 3458, second resistance level: 3467, third resistance level: 3483
Gold May Pull Back Short-Term📊 Market Overview:
After several strong bullish sessions, gold prices are under short-term pressure as geopolitical tensions in the Middle East temporarily ease and the US Dollar shows slight recovery.
While expectations for a steady Fed policy remain, traders are locking in profits after gold tested the $3,445 resistance zone.
📉 Technical Analysis:
Key Resistance: $3,445 – $3,460
Nearest Support: $3,394 – $3,380
EMA 09: Price has dropped below the 09 EMA, signaling a potential short-term bearish shift.
RSI/Candles/Momentum: RSI is pulling back from overbought levels. A red candlestick pattern has emerged after a strong rally, suggesting a technical pullback may be forming. Trading volume is starting to decrease.
📌 Outlook:
Gold may correct lower in the short term toward the $3,390–$3,380 support zone if it fails to reclaim the 09 EMA. However, the medium-to-long-term trend remains supported by safe-haven demand and dovish Fed expectations.
💡 Suggested Trading Strategy:
SELL XAU/USD at: $3,440 – $3,445
🎯 TP: $3,420
❌ SL: $3,455
BUY XAU/USD at: $3,390 – $3,395
🎯 TP: $3,410
❌ SL: $3,380
Gold, continued to rise after a pullback
📌 Driving events
Israel and Iran launched a new round of attacks on each other on Sunday (June 15), exacerbating market concerns that the escalation of the war could trigger a wider regional conflict, and gold continued to receive support from safe-haven buying. (The author believes that according to media reports, Iranian leaders have shown a tougher attitude, and Iran cannot be ruled out to give Israel a strong counterattack, so the geopolitical situation in the Middle East may escalate in the next few days, and gold as a safe-haven asset will shine even brighter.
Kremlin: (On Putin's possible mediation of the Israeli-Iranian conflict) Russia is ready to intervene at any time if necessary. (The author hopes that the two countries will be reconciled as soon as possible)
📊Comment Analysis
1-hour chart: The rising channel breaks down, and short-term shorting is at 3442.
💰Strategy Package
Today's US market plans to sell high and buy low in the 3408-3452 range. If the range breaks, follow the trend, strictly lighten the position and set a good stop loss.
⭐️ Note: I hope traders can properly manage their funds
- Choose the number of lots that matches your funds
I hope everyone will set rules, control emotions, and take a long-term view, and slowly get rid of the control of desire, be at ease in the trading market, find their own way to make money, and truly enjoy the fun and rewards brought by trading.
The international situation is bad. Gold fell back.Information summary:
Latest news: Israeli fighter jets "flew freely" over Tehran, and Iran lost air supremacy over the entire west. Israel's goal turned to a wider range of Iranian military and infrastructure.
Iran's counterattack, Tel Aviv, Haifa and other Israeli cities are being attacked by Iranian missiles. Both sides are currently suffering heavy losses.
But the price of gold fell back at this time; I think the biggest reason is that this week, the global "super central bank week" is about to hit, the market will usher in a very critical Federal Reserve interest rate decision, and central banks such as Japan, Switzerland and the United Kingdom will also hold monetary policy meetings one after another, and investors are on high alert. Under the influence of multiple conditions, the price of gold has a technical correction.
Technical analysis:
From a technical point of view, the impact of the conflict in the Middle East did not directly push up prices, but instead rushed up and fell back, which shows that the market has great pressure on the upward trend. Therefore, for the upward trend, it is necessary to be relatively conservative.
From the position point of view, the support below is around 3410.
From a trading perspective, most traders are waiting for the release of some data, which will change the overall trend of gold. However, according to the latest analysis of 14 Wall Street analysts, 10 analysts expect prices to continue to rise.
So I guess that this time the gold price pullback is accumulating energy for upward movement. At present, the price has started to rise after falling back to around 3410. The point of this pullback rebound is expected to stop around 3440, and then start to fluctuate at a high level.
If the price breaks through 3440 strongly and stabilizes above this position, the price may hit the upward pressure level of 3455 again.
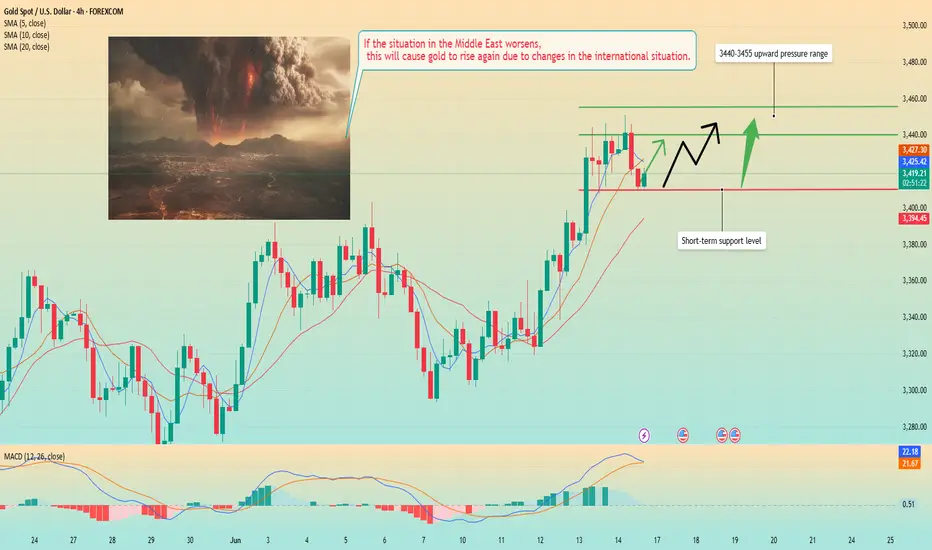
Analysis of gold trend on June 16!
📣Gold information:
Gold prices (XAU/USD) climbed to $3,445 in early Asian trading on Monday, the highest level in more than a month, as rising tensions in the Middle East and expectations of a rate cut by the Federal Reserve boosted demand for safe-haven assets.
Investors remain focused on geopolitical risks despite stronger-than-expected U.S. economic data on Friday. The University of Michigan's consumer confidence index jumped to 60.5 in June, well above market expectations of 53.5 and 52.2 in May. However, the market largely shrugged off the data. Instead, attention turned to the escalating conflict in the Middle East, with Israel's recent attack on Iran fueling concerns about instability in the wider region. In response, Iranian authorities warned that they would "respond firmly to any adventurism," which boosted gold's appeal amid global uncertainty.
⭐️Technical review and analysis: For the current short-term operation of gold, it is recommended to rebound high and go long, with the upward resistance level of 3450-3500 and the downward support level of 3385-3335.
⭐️Set gold price:
🔥Sell gold area: 3465-3475 SL 3485
TP1: $3450
TP2: $3430
🔥Buy gold area: $3390-$3388 SL $3383
TP1: $3400
TP2: $3422
GOLD/USD – Bullish Reversal Pattern FormingGOLD/USD – Bullish Reversal Pattern Forming 🟢📈
📊 Chart Analysis:
The chart shows a strong Inverse Head and Shoulders pattern forming, which is a classic bullish reversal signal:
🔹 Left Shoulder and Right Shoulder – Marked with orange circles, both found support near the 3,263 level (purple line), suggesting strong buying interest at this zone.
🔹 Head – The lowest point in between the shoulders, also bouncing from support.
🔹 Resistance Zone – Marked with red arrows around 3,500–3,520. This zone has rejected price action multiple times in the past.
🔹 Support Zone – Marked below 3,200, where previous consolidation and buying took place.
📈 Projected Move:
The neckline breakout suggests a potential move toward the 3,520+ level. A minor pullback is expected before continuation. If price breaks above resistance, we could see a strong bullish rally.
📌 Key Levels:
Support: 3,263 🟩
Resistance: 3,500–3,520 🟥
Potential Target After Breakout: 3,550+ 🎯
✅ Bias: Bullish above 3,263 support
⚠️ Invalidation: A break below the neckline would cancel the bullish setup

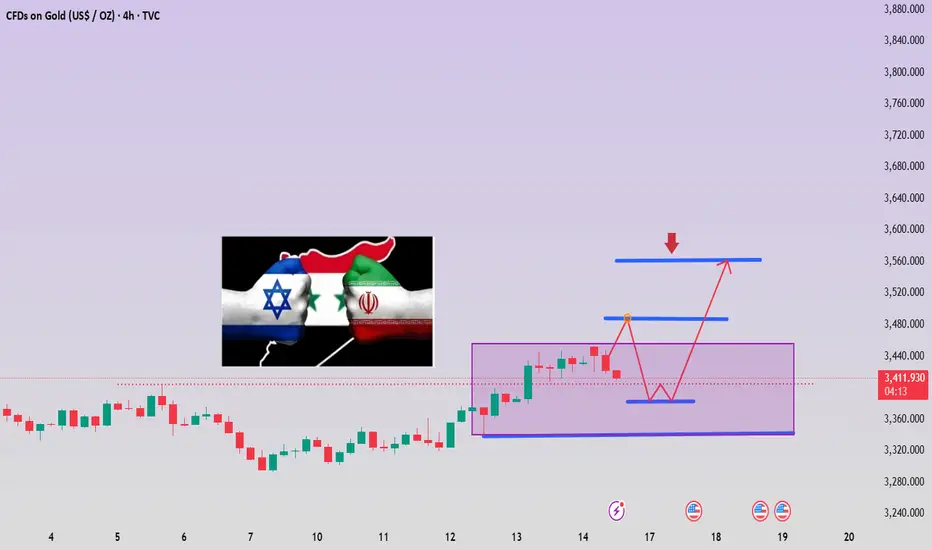
Geopolitical conflict re-emerges, price points to 3500?Information summary:
The powder keg of the Middle East situation exploded. A new round of fierce fighting between Israel and Iran has pushed the global financial market into a risk-averse storm. In just one day, gold soared. In the early Asian session on Monday, the price of gold was unstoppable, hitting a nearly seven-week high of $3451/ounce. Under the dark clouds of geopolitical conflict, gold bulls are in full swing, and the $3500 mark seems to be within reach.
In addition, the market will face two major tests this week: the monthly rate of US retail sales and the highly anticipated Federal Reserve interest rate decision.
Technical analysis:
At the daily level, the MA10, MA7, and MA5 moving averages are diverging upward, the RSI indicator turns upward, and the gold price is running steadily in the upper and middle track area of the Bollinger band. In the four-hour cycle, the moving average forms a golden cross arrangement and the opening continues to expand. The price continues to rise along the MA10 daily moving average, and the Bollinger band also maintains an upward opening shape.
The current market is dominated by geopolitical risks in the Middle East, and the gold price is consolidating at a high level. If the situation does not change, the gold price will most likely remain above $3,400 today, and it is even very likely to refresh the historical high of $3,500 today and tomorrow. Therefore, before the trend changes, the long strategy is still the best choice.
Operation strategy;
Buy near 3420, stop loss 3410, target 3460-3470.

GOLDGOLD is highly influenced by geopolitics right now, if the war escalates it could continue moving upwards towards 3500.
Disclosure: We are part of Trade Nation's Influencer program and receive a monthly fee for using their TradingView charts in our analysis.
Risk aversion escalates, prices continue to rise?Information summary:
On the last trading day of last week, gold rose again under the stimulation of risk aversion. The gold market is shrouded in risk aversion in the Middle East. In the short term, the trend of gold is still supported by risk aversion and may continue to rise. At present, the relationship between Israel and Iran has not been eased; there is the latest news: Iran may retaliate against the air strikes it suffered this time. This will provide momentum for the rise of gold.
Market analysis:
Gold 1 hour shows that the moving average forms a golden cross and diverges upward, and the bullish trend of gold is still there. After the rise of gold risk aversion, gold has adjusted sideways in the short term, but it is still oscillating strongly at a high level; it is still in the process of rising. The short-term fluctuation of gold is the adjustment in the process of rising, and it will continue to rise at any time. After the gold bulls broke through 3400, they have been stabilizing above this position, so the strategy for next week is still to buy on dips.
However, it should be noted that if the international situation suddenly changes, the price may not fall back, but directly rush to a new high.
In addition, if the international situation eases and falls below 3400, we must adjust the operation strategy in time to avoid losses.
Important positions:
Resistance levels: 3450, 3475, 3490
Support levels: 3410, 3400, 3380
Operation strategy:
Buy near 3410, stop loss at 3400, win range above 3450 points.
There are still 7 hours left before the Asian market opens. I hope my analysis can help all traders gain something in the gold market.
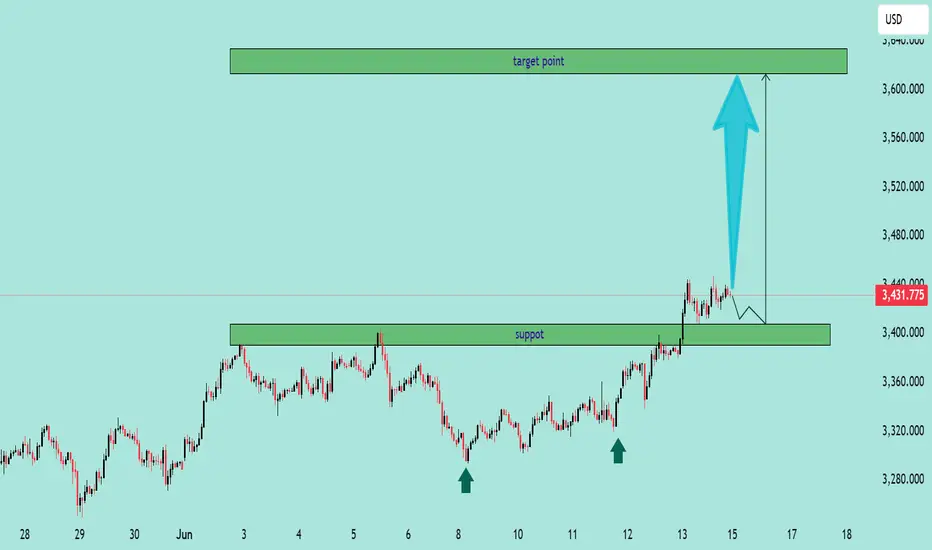
GOLD/USD Bullish Breakout PotentialGOLD/USD Bullish Breakout Potential 🚀📈
🔍 Chart Analysis (June 15, 2025):
The GOLD/USD price action shows strong bullish momentum after a successful breakout above the previous resistance zone (now turned support) around $3,400. This level had previously acted as a key resistance multiple times (evidenced by the price rejection in early June), but has now been flipped into a support zone. The chart highlights two major elements:
📌 Key Highlights:
✅ Support Zone:
The $3,390–$3,410 range is now a confirmed support area after price broke above and retested it. This zone was previously tested multiple times (marked by arrows) and is expected to act as a launchpad for further upside.
🎯 Target Point:
The projected bullish target lies in the $3,610–$3,640 range. This level has been highlighted as a potential area where price might face resistance again.
📈 Bullish Projection:
A bullish continuation is expected if the price remains above the $3,400 level. The chart suggests a possible pullback to support before continuation towards the target zone.
⚠️ Technical Outlook:
As long as price holds above support, the bias remains bullish.
A drop below $3,390 would invalidate this bullish scenario and call for reassessment.
Conservative entry may wait for a confirmed bounce from support.
🔮 Summary:
Bullish bias is active for GOLD/USD with a short-term target around $3,620. Watch the $3,400 support closely for confirmation of the upward momentum.
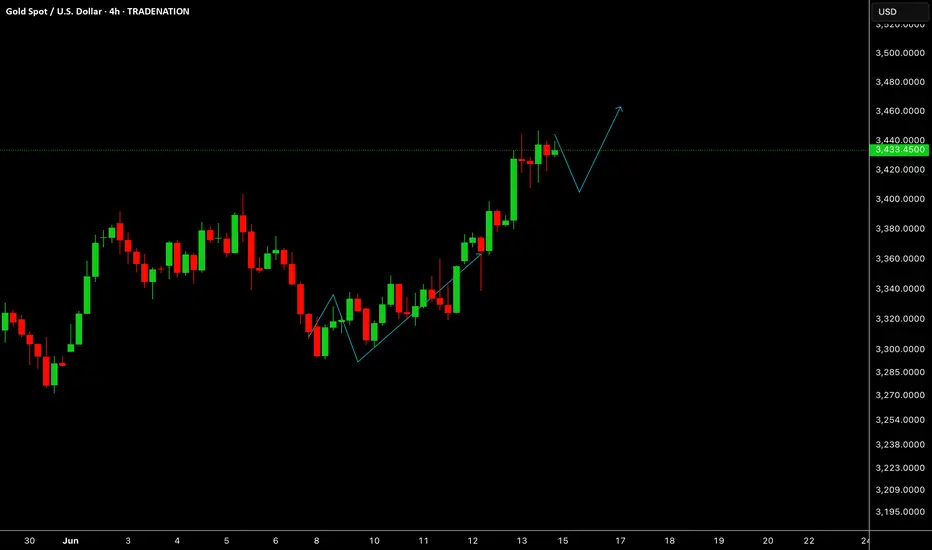
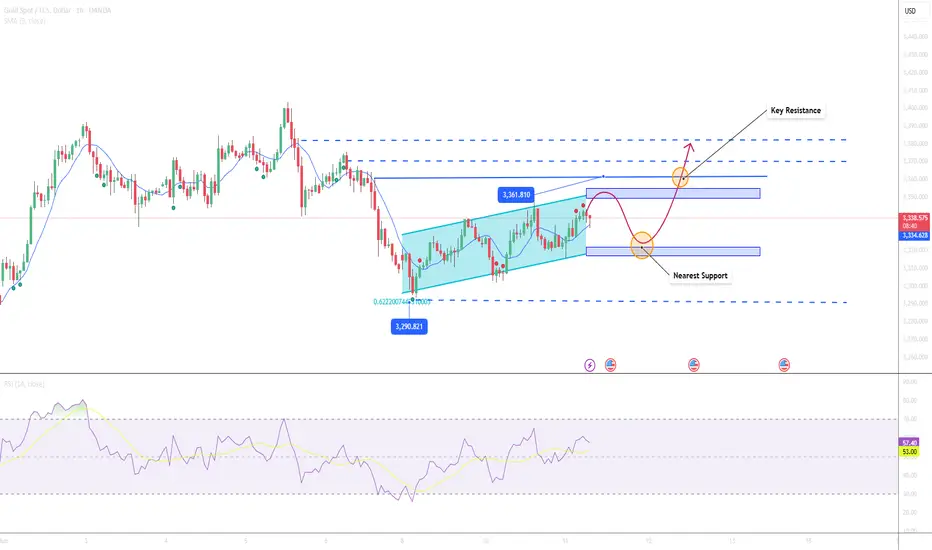
Adjustment over? Uptrend coming?Information summary:
A new round of air strikes by Israel against Iran on Friday has significantly escalated the conflict in the Middle East. Investors have quickly poured into traditional safe-haven assets such as gold, U.S. Treasuries and the Japanese yen. The market's current first choice for hedging geopolitical risks is gold, not the U.S. dollar. The U.S. dollar index rebounded slightly this week, but it has not become the main target of safe-haven fund flows, and gold has dominated the flow of safe-haven funds.
Although risk aversion has become the main theme of the gold market this week, the Fed's policy trends are still the core variable affecting the long-term direction of gold prices. In this week's FOMC meeting, the Fed kept interest rates unchanged and hinted that it may only cut interest rates once this year. But Powell also pointed out that future policies will still depend on data, leaving speculation about reversals.
Market traders generally believe that if the future inflation data falls more than expected or the job market slows down, the Fed's stance may turn dovish again, and gold prices may therefore gain new upward momentum.
Trend analysis for next week:
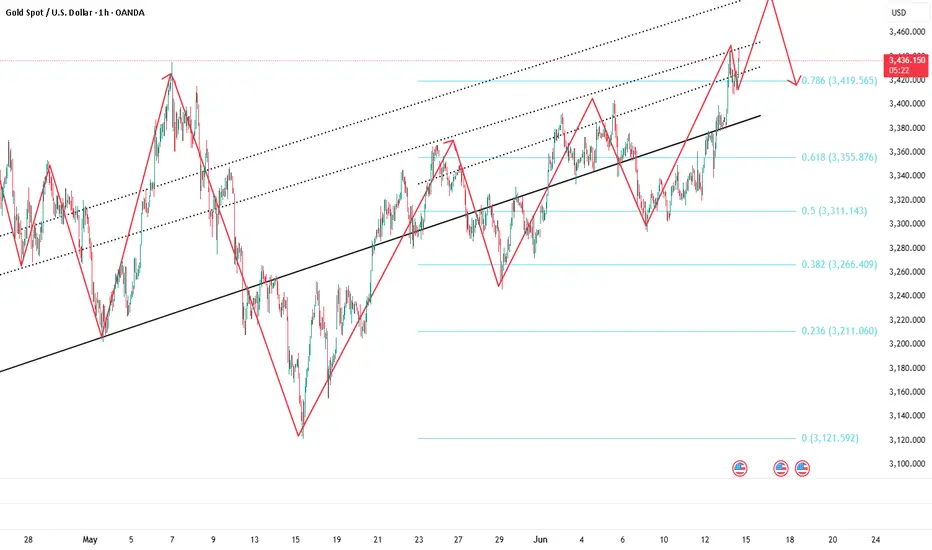
The weekly bullish trend extends, and there is still a lot of room for growth. After a round of decline last week, the weekly line closed this week again in a very strong position, and the daily rising trend channel resumed its operation. From the market alone, the gold price trend has been stabilizing above the middle track, and the bulls continued to line up at the opening of Monday. From the indicators, the middle track has been extending upward. Since May, the price has continued to create highs in the rising channel and has a tendency to challenge the historical high position of 3500, indicating that there is still room for upward movement in the short term.
From the 1-hour chart, the price rose to 3447 and then made a short-term correction to 3420, and the correction has been sufficient. 3420-3415 forms the most important support area. If this position is touched, it is an opportunity for long trading; but the price may not fall back to the support line and rise directly. Before breaking the important neckline, no short strategy will be adopted at the beginning of next week. We can patiently wait for the opportunity to go long after the correction.
Operation strategy:
Buy at 3415-3420, stop loss at 3410, profit range at 3450-3455.

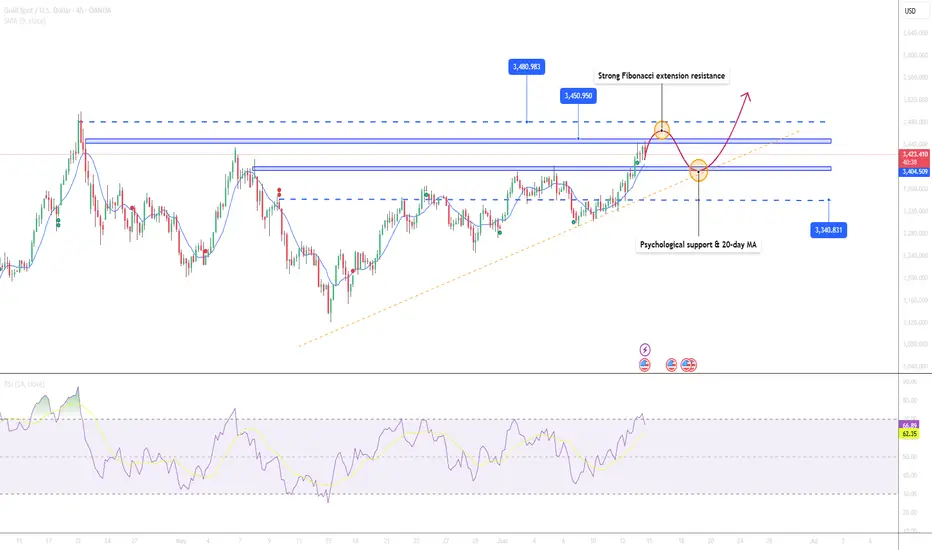
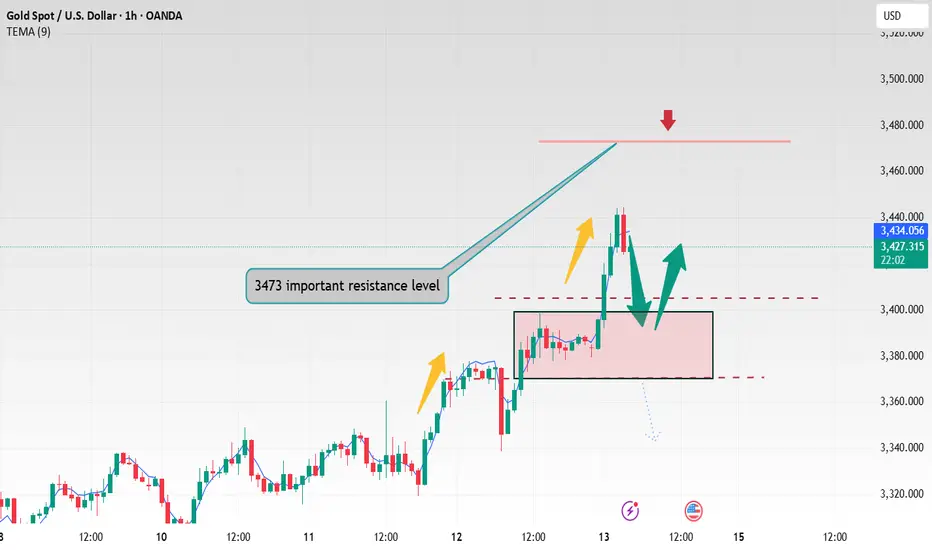
Gold Extends Rally as New High Emerges📊 Market Overview:
Gold reached a new intraday high at $3,447 today, supported by a weaker USD and stable U.S. Treasury yields. Prices then pulled back slightly to $3,423 amid short-term profit-taking. Ongoing geopolitical uncertainty and expectations that the Fed may hold or cut rates continue to drive demand for safe-haven assets like gold.
📉 Technical Analysis:
Key Resistance Levels:
• $3,447 – Intraday high on June 13
• $3,465 – Strong Fibonacci extension resistance
• $3,480 – Next upside target if price breaks above $3,447
Key Support Levels:
• $3,423 – Current price and intraday congestion zone
• $3,410 – Minor support on the H4 chart
• $3,400 – Psychological support & 20-day MA
• EMA: Price is trading above the 09-day EMA → short-term trend remains bullish
• Candlestick / Volume / Momentum:
Strong bullish candle with high volume; RSI at 67 indicates further upside potential. Short lower wicks suggest limited selling pressure. MACD on both H4 and daily charts favors continued upside momentum.
📌 Outlook:
Gold is likely to continue rising if it holds the $3,410–$3,423 support zone. A break above $3,447 may open the path toward $3,480 or higher.
💡 Suggested Trading Strategy:
🔺 BUY XAU/USD:
• Entry: $3,420 – $3,425
• 🎯 TP: $3,480
• ❌ SL: $3,408
🔻 SELL XAU/USD
• Entry: $3,445 – $3,450
• 🎯 TP: $3,423 – $3,410
• ❌ SL: $3,457
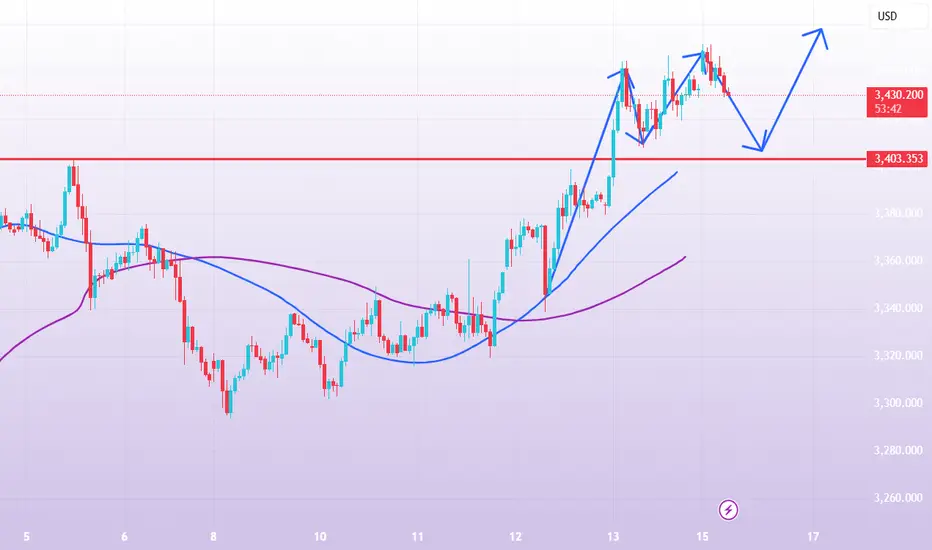
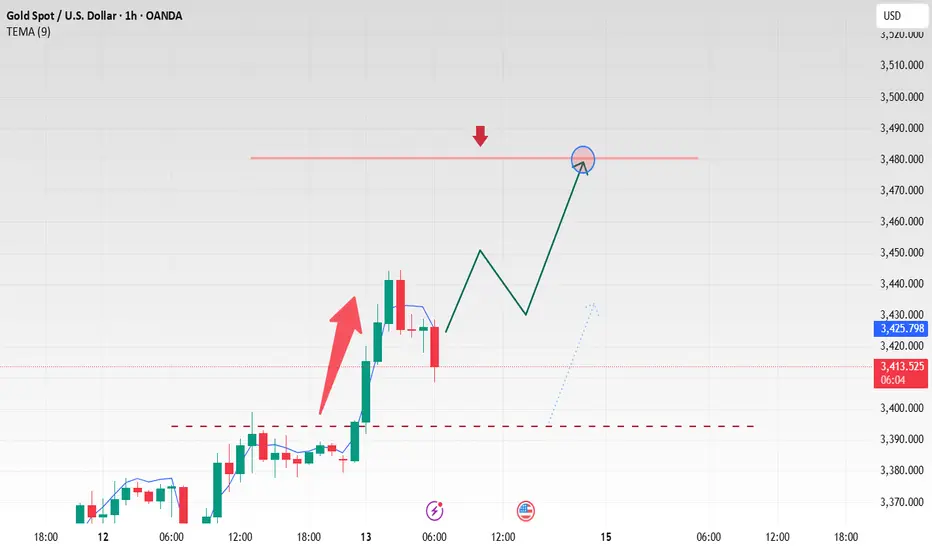
Gold will inevitably fall after risingGold has risen sharply due to the violent geopolitical conflicts and the surge in risk aversion. It once reached around 3445, but in the process of falling back, it only touched 3408 and rebounded again, stabilizing above 3400. It is obvious that due to the changes in fundamentals, the sentiment of gold bulls is high; although the upward momentum of gold near 3440 has weakened, there is no clear signal of peaking yet!
For short-term trading, it is relatively difficult to participate at present. To be honest, I naturally don’t want to chase gold at a high level; but there are no more signals to support me to short gold for the time being. However, with the rebound of gold, the current short-term support below is in the 3425-3415 area, followed by the psychological support of the 3400 integer mark; and the short-term resistance above is in the 3455-3465 area, followed by the area near 3480.
Compared with the profit and loss ratio, I prefer shorting gold for short-term trading, because gold has performed relatively strongly in the London market. Logically, gold will have the inertia to rise in the New York market, so I think gold may rise and then fall in the New York market, so my current plan is to try shorting gold starting in the 3455-3465 area.
Because the changes in gold's fundamentals are more extreme and complex, you must set up SL when participating in transactions.
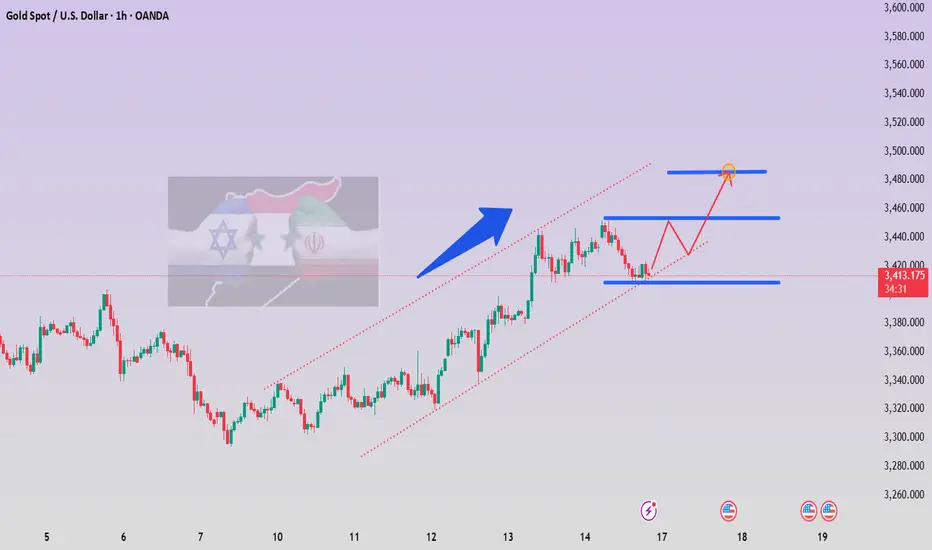
Israel attacks Iran, gold soars
⭐️Gold information:
Israel attacks Iran's capital Tehran! Gold and crude oil soar rapidly!
The Middle East bully attacks Iran, and the risk aversion sentiment affects the early trading of gold at 3380. 30 US dollars
⭐️Personal comments:
Due to the escalation of geopolitical tensions in the Middle East, market risk sentiment has slightly rebounded, and investors are more inclined to buy traditional safe-haven assets-gold
Moving towards 3480
⭐️Set gold price:
🔥Sell gold area: 3478-3480 SL 3485
TP1: $3462
TP2: $3450
TP3: $3435
🔥Buy gold area: $3375-$3377 SL $3370
TP1: $3389
TP2: $3400
TP3: $3412
Geopolitical tensions, gold prices may reach 3480 points⭐️Personal comments:
Due to the escalation of geopolitical tensions in the Middle East, market risk sentiment has slightly rebounded, and investors are more inclined to buy traditional safe-haven assets-gold
Moving towards 3480
⭐️Set gold price:
🔥Sell gold area: 3478-3480 SL 3485
TP1: $3462
TP2: $3450
TP3: $3435
🔥Buy gold area: $3375-$3377 SL $3370
TP1: $3389
TP2: $3400
TP3: $3412

GOLD/USD Bullish Breakout ConfirmationGOLD/USD Bullish Breakout Confirmation 🚀📈
📊 Technical Analysis Overview:
The chart illustrates a bullish breakout above a well-defined resistance zone around $3,390–$3,400. Price action has decisively closed above this resistance, suggesting strong bullish momentum.
🔍 Key Observations:
🟦 Support Zone:
Marked clearly between $3,250–$3,280, this level has held firm multiple times (highlighted with green arrows and orange circles), confirming buyer interest and market structure.
🟦 Resistance Turned Support:
The previous resistance zone around $3,390–$3,400 has now potentially turned into a new support. Price retesting this zone and holding would further validate the breakout.
📈 Future Projections:
The chart anticipates a retest-pullback-continuation scenario:
Pullback to new support 📉
Bullish continuation toward $3,460+ 🎯 if support holds.
✅ Bias:
Bullish as long as price remains above the $3,390 zone. Break and hold below would invalidate the bullish setup.
📌 Strategy Tip:
Look for confirmation on the lower timeframes (e.g., bullish engulfing or pin bar) on the retest before entering long.
Israel attacks Iran, gold price correction can be long gold
📣Gold news
Today, Israel launched an attack on Iran, and the gold price reached a high of $3,433/ounce, the highest level since May 6, and the weekly increase exceeded 3.6%, the highest level since the week of May 19.
Spot gold continued to rise during the US trading session on Thursday, reaching a weekly high of $3,398.55/ounce. However, in the afternoon of the same day, the Chinese Ministry of Commerce stated that China and the United States reached a principled agreement on implementing the consensus of the heads of state call and consolidating the results of the Geneva talks, and made new progress in resolving each other's economic and trade concerns. Affected by the easing of the Sino-US trade situation, the safe-haven demand for gold dropped sharply, and the price fell rapidly by $30 from the high, reaching a low of $3,338/ounce. The market risk appetite has rebounded significantly, and the risk aversion sentiment has cooled significantly. Combined with the fact that the monthly and annual rates of the US CPI released in the evening were both lower than expected, indicating that inflationary pressure has not intensified. After the data was released, the market's expectations for the Fed to cut interest rates by 50 basis points before the end of the year have further increased.
📊Technical analysis:
Technically, the upper track of the daily line is still in a flat state. The current market has reached a high of around 3444. After the rise on Thursday, it is expected that there will be little room above. Since the market is in a volatile rise, it is not suitable to directly chase the rise. The 4-hour Bollinger band continues to diverge upward, and the moving average is arranged in a bullish pattern, indicating that the current market is in a strong position. If it breaks high on Thursday, there will be a chance of rising on Friday. In terms of operation, keep the idea of calling back and going long. If it falls below 3367 again, there will be repeated fluctuations.
Today's operation strategy💰
If the gold price falls back to around 3375, go long. If it is around 3370 and 3365, add more. Stop loss at 3360. Target 3420-3430
Sell short near 3430. Add shorts in batches near 3430 and 3435. Stop loss at 3440. Target 3380-3374
(If you have just entered the market, the gold market is confusing. The operation direction is always reversed. The entry price is not sure. The position is trapped. You can contact Labaron to get the gold price trend analysis And online guidance for unwinding! )
There is no unsuccessful investment, only unsuccessful operation. We have been deeply involved in the industry for more than ten years, with rich practical operation experience and unique trading concepts. We have a global and stable trading system here. We have studied gold, crude oil and other investment fields for many years, with a solid theoretical foundation and practical experience. We are good at combining technical and news operations, focusing on fund management and risk control, and have a stable and decisive operation style. We are recognized by the majority of investment friends for our easy-going and responsible personality and sharp and decisive operations. The analysis article only describes the possible future of the market and expresses opinions. It is not used as a basis for investment decisions. Investment is risky. Trading may not pay attention to reasonable position allocation, fund management and risk control. Do not trade without risk control. Don't let the transaction get out of control.
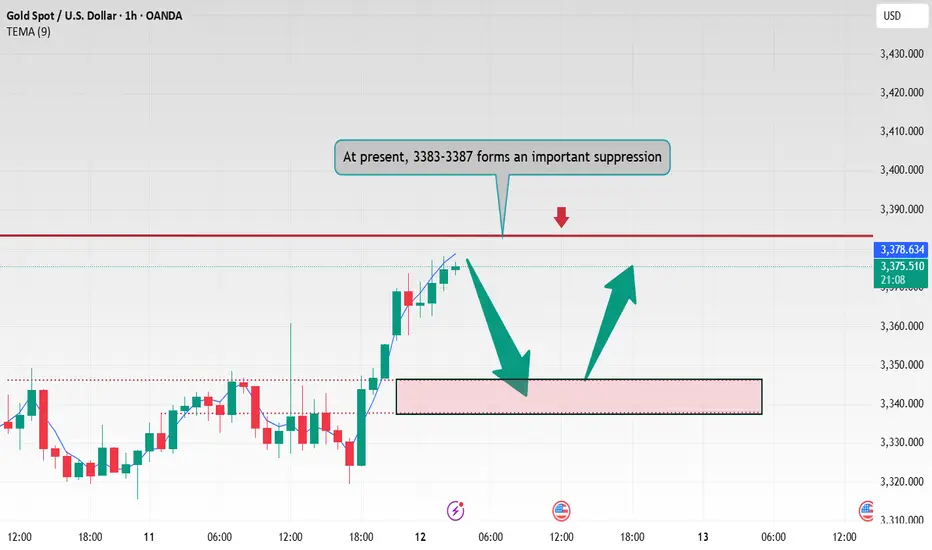
Iran hardens steel, gold rises!
📣Gold news
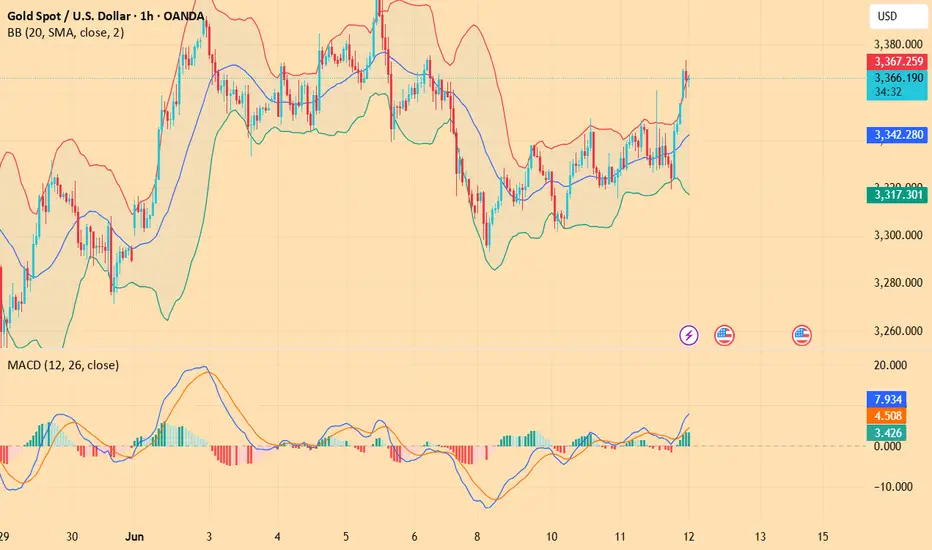
On Thursday (June 12, 00:00 in the Asian morning, spot gold continued to rise, reaching a high of $3,377 so far, a new high this week. The lower-than-expected US CPI data in May increased the possibility of the Federal Reserve's interest rate cut in September, and the trend of the US dollar and the decline in US bond yields provided a favorable environment for gold prices. At the same time, tensions in the Middle East escalated on Wednesday, and Iran said it would attack US military bases in the Middle East if negotiations broke down. The sharp rise in geopolitical tensions in the Middle East has significantly increased the safe-haven demand for gold. Although the conclusion of the US-China trade agreement has eased some market pressure, the potential impact of tariff policies on inflation still needs to be vigilant. Looking ahead, investors need to pay close attention to Thursday's PPI data and the Fed's policy trends, while keeping an eye on the situation in the Middle East. Driven by risk aversion and expectations of loose monetary policy, the gold market still has room for upside in the short term.
📣Technical side:
Yesterday's CPI data was bullish. After a brief surge, it fell back to below 3330, and then fluctuated. The rise was not strong. Late at night, Trump again called on the Federal Reserve to cut interest rates by 100 basis points. Confidence in the Iran nuclear negotiations decreased. In the next one to two weeks, he will send a letter to trading partners to set unilateral tariffs. Uncertain risks increased. Gold rose in contact with the CPI data. In the short term, the price broke through the 3348-3353 suppression. Consider going low around this position during the day, looking at the 3383-89 suppression, stop loss 3337, pay attention to risks.
💰Strategy Package
Today's trading strategy: long around 3349. Stop loss 3337, take profit 3383
Short around 3370, stop loss 3374, take profit 3350
Trend value trading is the only way for all investors to make profits. There is no shortcut, and don't be lucky. Any investor needs to go through the process of loss, capital preservation, and profit from the beginning of entering the market. The market is definitely not a long-term paradise for speculators. A successful speculation does not mean that it can be successful from beginning to end. Only stable and continuous profits can make a person successful. There must be rules here. If you don't break the rules, you won't be eliminated.
Gold Consolidates Around $3,340–Mild Bullish Bias Ahead CPI Data📊 Market Summary
Gold is consolidating around $3,340/oz, up about 0.5% today, as investors seek safe-haven assets amid ongoing US–China trade tensions. The market is also closely watching the upcoming U.S. CPI data release.
📉 Technical Analysis
Key Resistance:
• $3,350–3,360 – recent swing highs, aligning with the intraday EMA50 and Fibonacci resistance.
• $3,370–3,380 – major monthly high, potential breakout zone.
Nearest Support:
• $3,320–3,330 – EMA20–21 zone, daily support and key pivot level.
• Below $3,320, next support lies near $3,300.
EMA 09:
• Price is trading above EMA9 but still below EMA21–50 → suggests neutral-to-slightly bullish intraday bias.
Candlesticks / Volume / Momentum:
• Small-bodied candles with low volume → signs of sideways movement.
• RSI on H1 ~60, H4 ~55 → modest upward momentum, not yet overbought.
📌 Outlook
Gold is likely to continue consolidating around $3,340, with mild upside potential if the U.S. CPI data comes in hot or trade talks remain inconclusive.
💡 Suggested Trading Strategy
SELL XAU/USD at: $3,350–3,355
🎯 TP: $3,330–3,335
❌ SL: $3,360
BUY XAU/USD at: $3,320–3,330
🎯 TP: $3,340–3,345
❌ SL: $3,310
XAU/USD(20250612) Today's AnalysisMarket news:
① The EU hopes that the trade negotiations will be extended beyond the suspension period set by Trump. ② Bessant: As long as "sincerity" is shown in the negotiations, the Trump administration is willing to extend the current 90-day tariff suspension period beyond July 9. ③ Trump will hold multiple bilateral talks during the G7 summit. ④ The total customs revenue of the United States in May reached a record high of US$23 billion, an increase of nearly four times year-on-year. ⑤ Lutnick: One deal after another will be reached.
Technical analysis:
Today's buying and selling boundaries:
3343
Support and resistance levels:
3388
3371
3360
3326
3315
3298
Trading strategy:
If the price breaks through 3371, consider buying in, and the first target price is 3388
If the price breaks through 3360, consider selling in, and the first target price is 3343
Continue to short gold Gold rebounded from around 3315 and has now reached above 3340. According to the current structure, gold tends to rebound upward. But the characteristics of the recent market trends are also very obvious. Gold has risen with difficulty, but has retreated very quickly! Overall, there was no continuation in the process of long and short games, which was disorderly fluctuation.
According to the current structure, as long as gold cannot break through the 3350-3355 area and the bulls have not completely gained the upper hand, gold still has the potential to go down and test the 3320-3310 area again. Therefore, for short-term trading, we should not chase gold too much, and we can still try to short gold with the 3345-3355 area as resistance.
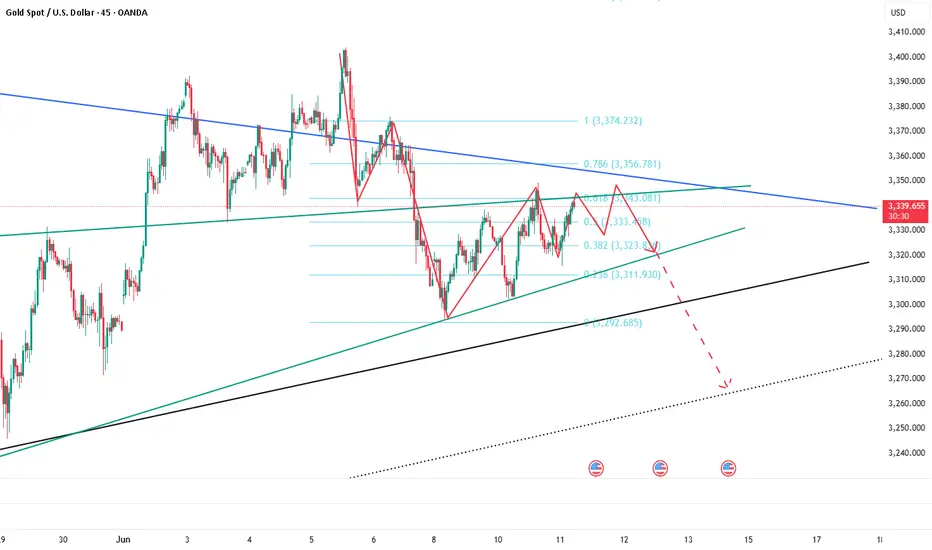
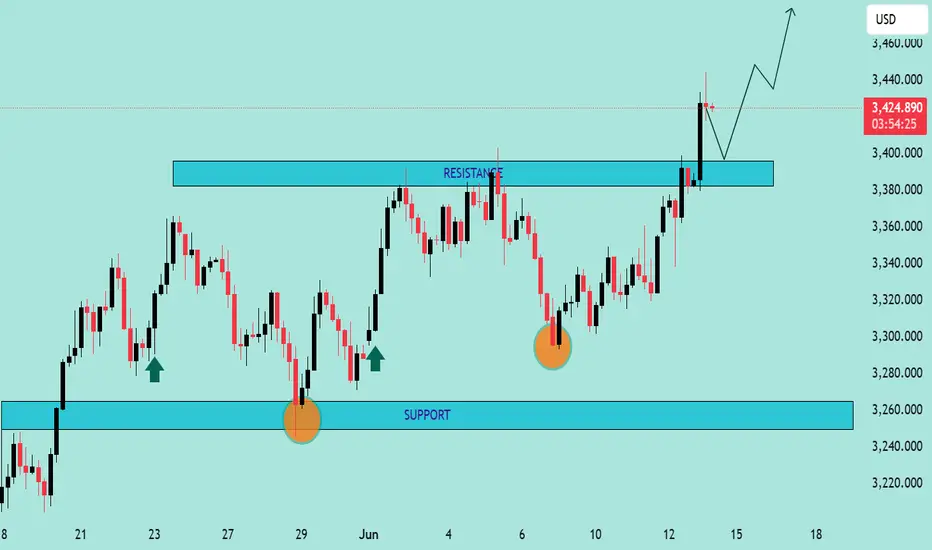
GOLD PRICE ACTION ANALYSIS – June 11, 2025 GOLD PRICE ACTION ANALYSIS – June 11, 2025 🟡
Technical Breakdown & Bearish Scenario Ahead ⚠️📉
🔍 Overview:
The chart presents a clear range-bound structure with strong horizontal resistance around the $3,400–$3,420 zone and support around the $3,120–$3,160 level. Price is currently trading near the upper range of the consolidation.
📊 Key Technical Levels:
🔴 Resistance Zone: $3,400 – $3,420
➤ Price has been rejected here multiple times (highlighted by red arrows and orange circles), showing strong supply pressure.
🟣 Intermediate Support: $3,260.618
➤ This level acted as a minor support and could be tested again if the current pullback deepens.
🟤 Major Support Zone: $3,120 – $3,160
➤ A key demand area where price previously bounced significantly.
📉 Bearish Setup:
A potential lower high is forming just below the resistance zone.
The projected path suggests a minor pullback to form a bearish retest, followed by a potential breakdown below $3,260.
If the $3,260 support is broken decisively, further downside toward the $3,120–$3,160 support is likely (blue arrow projection).
🔄 Bullish Scenario (Invalidation):
A breakout and strong close above $3,420 could invalidate the bearish structure.
In that case, price might attempt to target higher resistance levels beyond $3,440.
📌 Conclusion:
Gold remains in a range with a bearish bias unless the $3,420 resistance is breached.
🔽 Watch for confirmation below $3,260 for bearish continuation.
✅ For bulls, wait for a strong breakout above resistance with volume.
