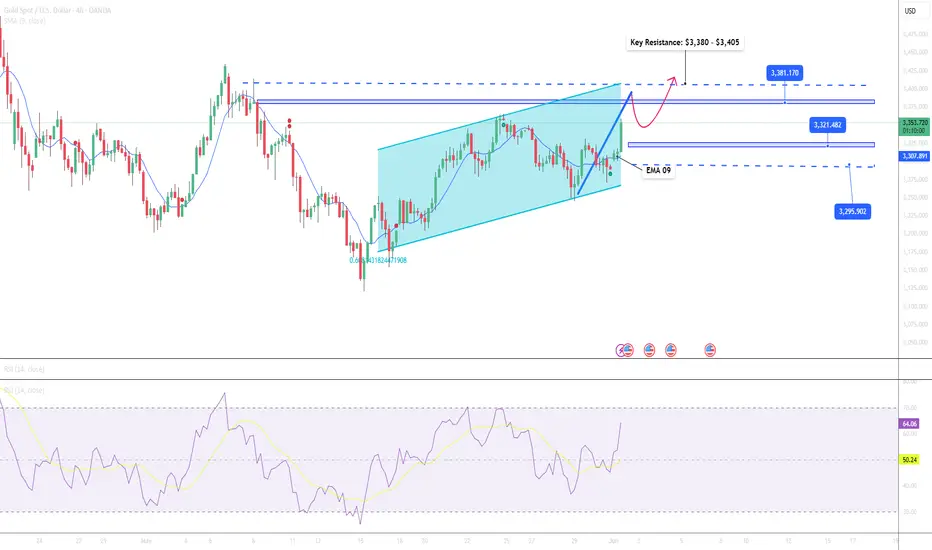
Trading opportunities after gold accelerates its rallyTechnical analysis:
Gold has risen sharply and has broken through the resistance areas near 3330 and 3355. In the short term, gold has formed an upward force and has a clear willingness to rise. At present, gold bulls still have the potential to continue to test the 3370-3380 area. As gold rises and breaks through, the 3340-3330 area below has become a strong support in the short term; if gold cannot fall below this support area during the retracement, gold may even continue to rise and try to hit the 3405-3415 area.
Trading strategy:
1. Consider going long on gold after gold retreats to the 3340-3330 support area, TP: 3360-3370;
2. Consider going short on gold in small quantities after gold first touches the 3370-3380 area, TP: 3355-3345.
Goldinvesting

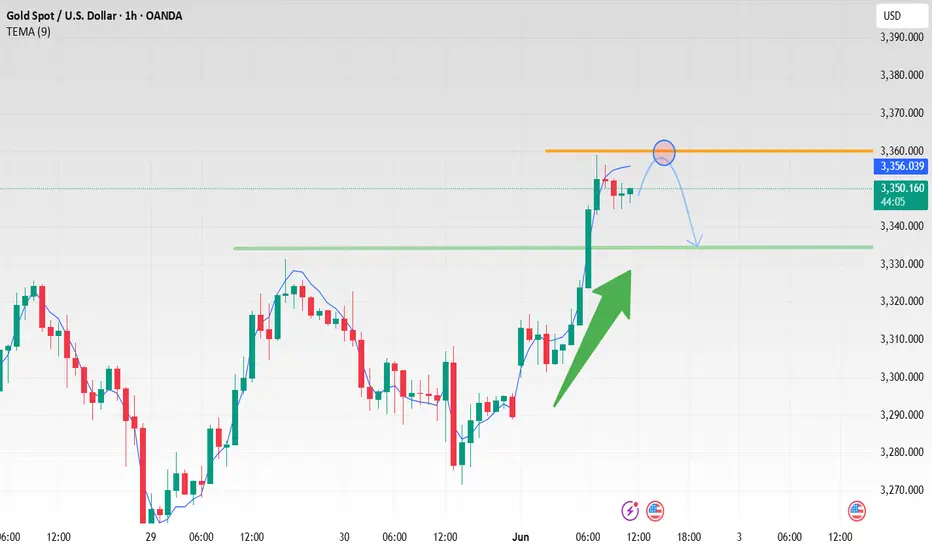
Affected by tariffs, gold prices rebounded to above 3,300
Gold finally broke the calm of the past and resumed its upward trend. What happened? This is also thanks to President Trump, who imposed tariffs again over the weekend, and there was also news of air strikes. The combination of the two directly broke the calm of gold prices in the past.
So where can this wave of gold go? Technically, gold 1-hour cycle, maintained fluctuations around 3,348, and the support line is expected to be around 3,330.
Our strategy today is also very simple. As long as the gold price retests around 3,360-3,350, I will go short. Which specific position can stop profit? I will tell my VIP.
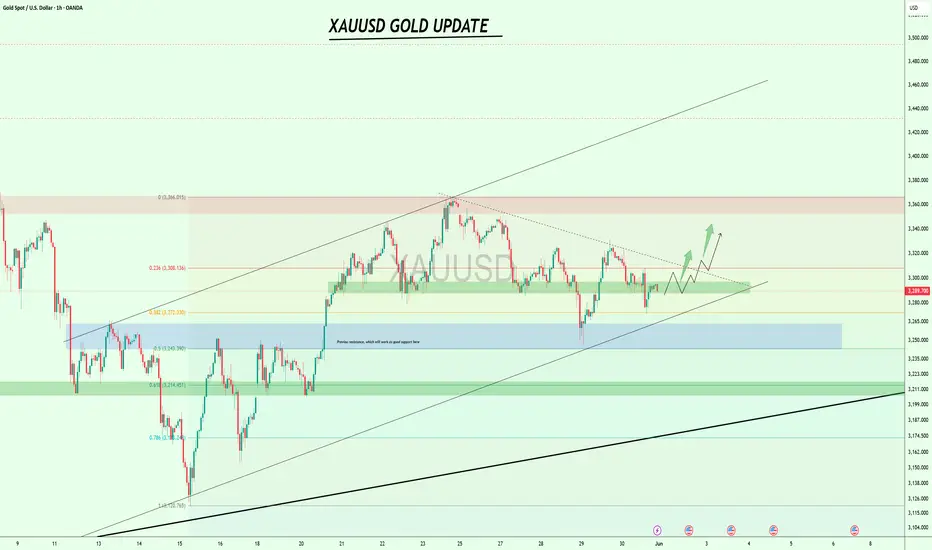
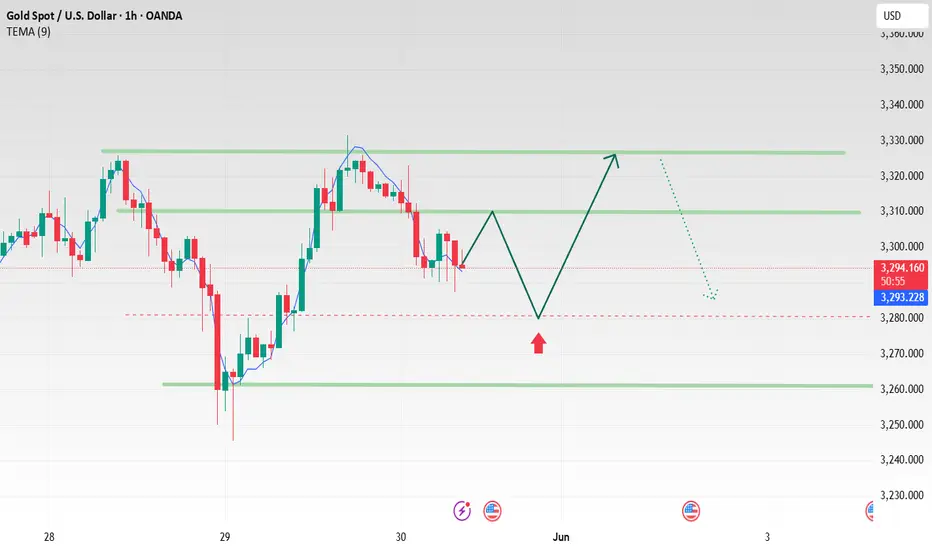
Buyers Stepping In – Is $XAUUSD Ready to Move?Gold is still holding the key support zone around $3,285–$3,290 and slowly gaining strength.
As long as this level holds, we could see the price move up to $3,320, and if momentum stays strong, maybe even $3,340+.
The structure looks good, and buyers are stepping in.
Keep an eye on a possible breakout above the dotted trendline. 👀
#XAUUSD
Gold Continues to Rise Amid Increased Safe-Haven Demand📊 Market Overview:
Gold prices surged on June 2, 2025, reaching multi-week highs as investors sought safe-haven assets amid escalating geopolitical tensions and trade war concerns. U.S. President Donald Trump's announcement to double tariffs on steel and aluminum imports to 50%, along with Ukraine's drone attacks on Russian facilities, prompted investors to flock to gold as a secure investment.
📉 Technical Analysis:
• Key Resistance: $3,380 – $3,405
• Nearest Support: $3,320 – $3,295
• EMA: Price is above EMA 09 → uptrend.
• Candlestick Patterns / Volume / Momentum: RSI(14) at 65 , MACD(12,26) signaling buy, indicating continued upward momentum.
📌 Outlook:
Gold may continue its short-term uptrend if it holds above the $3,320 support level. However, caution is advised due to potential technical corrections as RSI indicates overbought conditions.
💡 Suggested Trading Strategy:
SELL XAU/USD at: $3,380 – $3,385
o 🎯 TP: $3,320
o ❌ SL: $3,405
BUY XAU/USD at: $3,295 – $3,320
o 🎯 TP: $3,380
o ❌ SL: $3,270
Gold Holding Pattern – Key Resistance AheadHey, friends
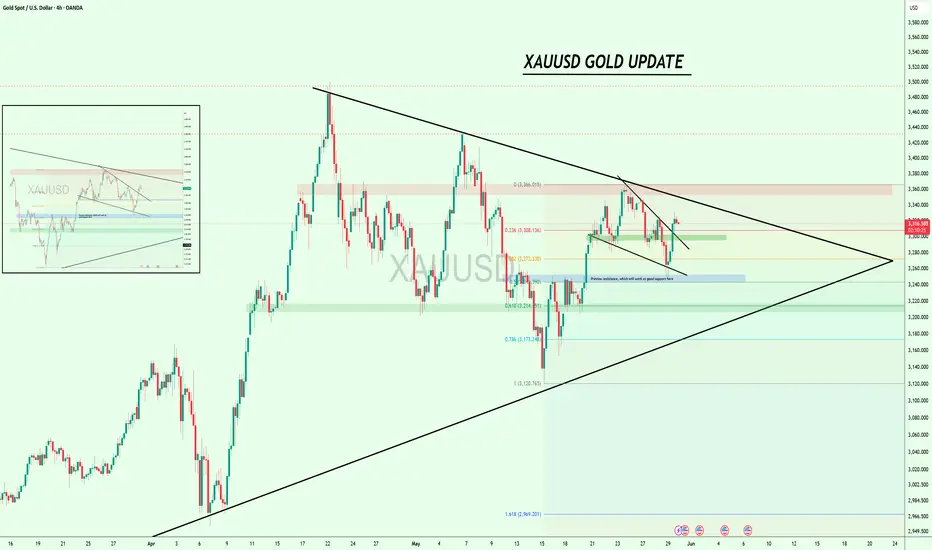
On the 4-hour time frame, TVC:XAU is forming a symmetrical triangle pattern, but we haven’t seen any breakout yet, we’re still trading inside the triangle.
If we look at the LTF, we’re currently at the 0.236 FIB level, which isn’t a very strong buying zone, but technically, we’ve broken out of a falling wedge and are now retesting it.
That looks pretty good, and if this setup plays out well, we could see an upward move toward $3,470.
However, there’s a strong resistance around $3,350 to $3,370 that we need to break first. If we break that, it will also confirm the breakout of the symmetrical triangle from the 4-hour chart.
So keep an eye on those areas!
#GOLD #forextrading
Gold retested as expected, what to do next?
Gold rebounded from 3308 in the US market and fell to 3272. The recent market is good-looking but difficult to do. The long and short positions are repeatedly washed. The monthly line basically closed at the cross star. Under the fierce game between long and short positions, the performance was balanced.
The short-term hourly line is only a single negative line that fell rapidly, and it does not have downward continuity. The high point of the US market rebound is around 3302. If you want to participate, you can go short when it reaches around 3302. As of press time, gold is accumulating strength around 3293. If you step back below, you can rely on the low point for defense.
⭐️ Note: Labaron hopes that traders can properly manage their funds
- Choose the number of lots that matches your funds
- Profit is 4-7% of the fund account
- Stop loss is 1-3% of the fund account

Gold Declines as PCE Inflation Data Cools📊 Market Overview:
Gold is currently trading around $3,289/oz, down from the day's high of $3,322. This decline follows the U.S. PCE inflation data showing a 2.1% annual increase in April, below the forecast of 2.2% and March's 2.3%. Core PCE also rose 0.1% monthly and 2.5% annually, the lowest since early 2021.
📉 Technical Analysis:
• Key Resistance: $3,310 – $3,330
• Nearest Support: $3,270
• EMA: Price is currently below the 09 EMA, indicating a short-term downtrend.
• RSI Indicator: The RSI is declining, signaling increasing selling pressure.
• Candlestick Pattern: A bearish candlestick pattern has formed after failing to break above the $3,330 resistance zone.
📌 Outlook:
If gold fails to hold the $3,270 support level, it may continue to decline towards $3,250. However, maintaining above $3,270 could see a rebound towards the $3,300 – $3,310 range.
💡Suggested Trade Strategy:
SELL XAU/USD at: $3,310 – $3,315
🎯 TP: $3,290
❌ SL: $3,320
BUY XAU/USD at: $3,270
🎯 TP: $3,290
❌ SL: $3,260

Gold awaits tariff volatility!
📌 Driving Events
Gold rebounded from a weekly low near $3,245 and broke through the $3,300 mark on Thursday, boosted by optimism following a weaker-than-expected U.S. jobs report and a U.S. court ruling halting President Trump's proposed tariffs.
Gold fell on Friday as the dollar rose slightly, while investors await a U.S. inflation report that could provide further insights into the Fed's policy trajectory.
📊 Commentary Analysis
The market continued to fall for an hour, fluctuating back and forth, lacking continuity - it rose yesterday and fell today. Gold rebounded above $3,320 in early trading before retreating. On the weekly and daily charts, the trend is still dominated by range fluctuations rather than unilateral gains or losses.
I think shorting gold should be considered today, with support below at $3,280-3,270-3,260. However, prices may struggle to make new lows. As today is the monthly close, large fluctuations suggest that we should avoid chasing ups and downs.
💰Strategy plan
XAUUSD
Sell: 3330-3320-3310
tp: 3300-3290-3280
Gold May Undergo Short-Term Correction Amid Technical Resistance📊 Market Overview:
Gold is currently trading around $3,314/oz, slightly down after testing resistance near $3,350. The market faces pressure from a strengthening USD and inflation concerns. Investors are closely monitoring signals from the Federal Reserve regarding future monetary policy.
📉 Technical Analysis:
• Key Resistance: $3,350
• Nearest Support: $3,200
• EMA: Current price is near the 50-day EMA, indicating a potential trend reversal if resistance holds.
📌 Outlook:
Gold may decline in the short term if it fails to break above the $3,350 resistance and the USD continues to strengthen.
💡 Suggested Trading Strategy:
SELL XAU/USD at: $3330
o 🎯 TP: $3,310
o ❌ SL: $3,340
BUY XAU/USD at: $3,230
o 🎯 TP: $3,250
o ❌ SL: $3,220

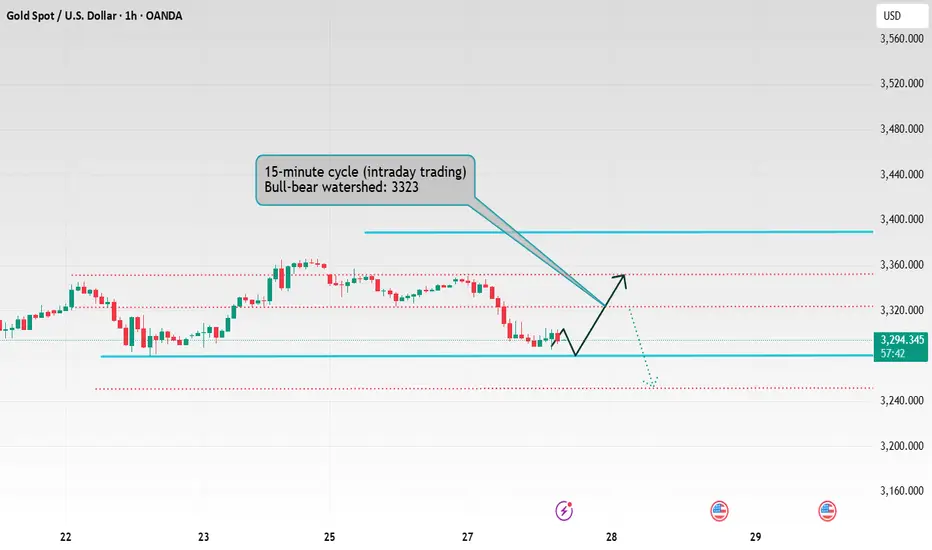
Gold is still washing out, beware of a fall below 3326!
📊Comment Analysis
After gold fell in the Asian session, the entire European session rebounded continuously, and the US session hit the 3318 line. Overall, it is still a wide range of shocks and washes out. No matter whether it rises or falls, it is not continuous, and the fluctuation range is large, which is difficult to grasp in short-term operations.
The current rise cannot be regarded as a strong trend. The characteristic of the shock market is repetition. The 4H cycle opens at 3326 as a watershed. Beware of a fall below this position in the US session. You can try to go short near 3320/3325. At present, it is a key position to bet on the short position. If it goes up, it will be 3340/3350. The rise in a short period of time is too large, and once it falls back, the strength will be the same.
⭐️ Note: Labaron hopes that traders can properly manage their funds
- Choose a lot that matches your funds
- Profit is 4-7% of the fund account
- Stop loss is 1-3% of the fund account

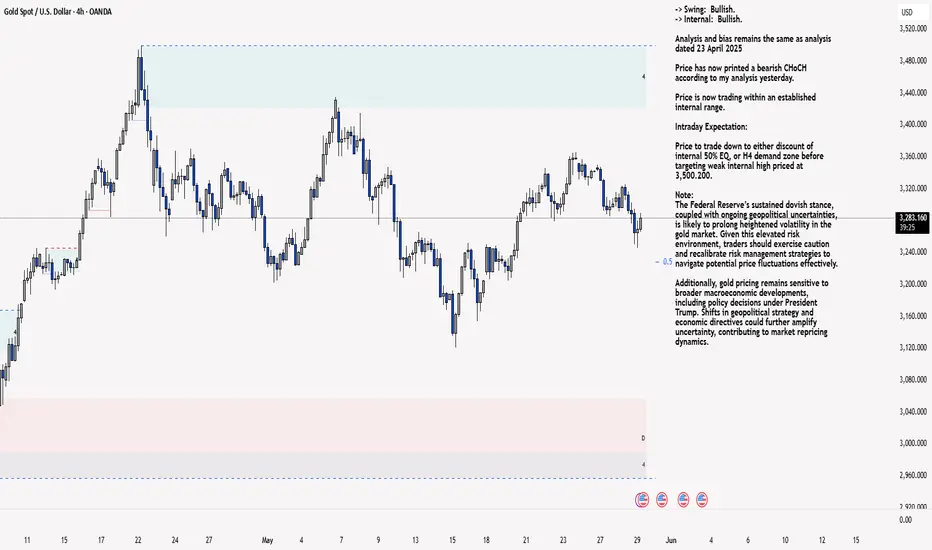
XAU/USD 29 May 2025 Intraday AnalysisH4 Analysis:
-> Swing: Bullish.
-> Internal: Bullish.
Analysis and bias remains the same as analysis dated 23 April 2025
Price has now printed a bearish CHoCH according to my analysis yesterday.
Price is now trading within an established internal range.
Intraday Expectation:
Price to trade down to either discount of internal 50% EQ, or H4 demand zone before targeting weak internal high priced at 3,500.200.
Note:
The Federal Reserve’s sustained dovish stance, coupled with ongoing geopolitical uncertainties, is likely to prolong heightened volatility in the gold market. Given this elevated risk environment, traders should exercise caution and recalibrate risk management strategies to navigate potential price fluctuations effectively.
Additionally, gold pricing remains sensitive to broader macroeconomic developments, including policy decisions under President Trump. Shifts in geopolitical strategy and economic directives could further amplify uncertainty, contributing to market repricing dynamics.
H4 Chart:
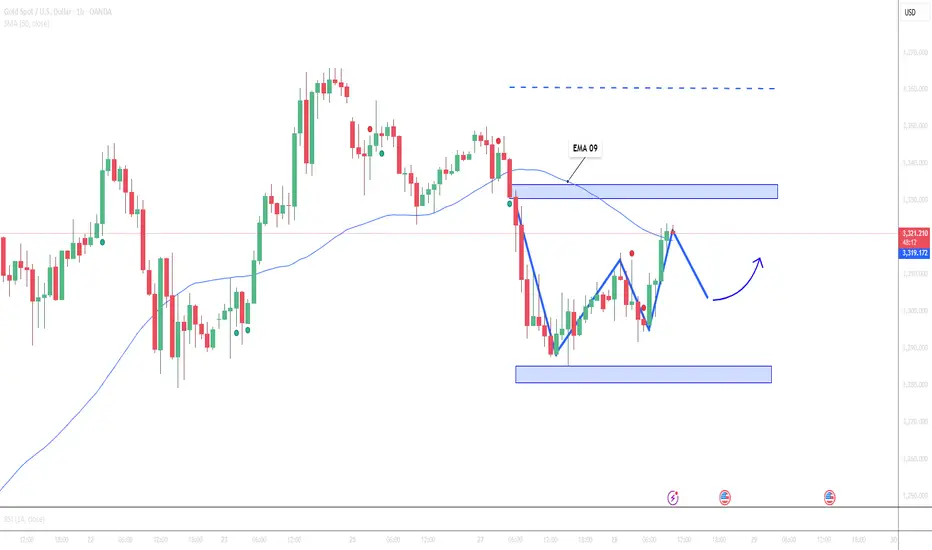
M15 Analysis:
-> Swing: Bullish.
-> Internal: Bearish.
Analysis and bias remains the same as analysis dated 22 May 2025.
In my analysis from 12 May 2025, I noted that price had yet to target the weak internal high, including on the H4 timeframe. This aligns with the ongoing corrective bearish pullback across higher timeframes, so a bearish internal Break of Structure (iBOS) was a likely outcome.
As anticipated, price targeted strong internal low, confirming a bearish iBOS.
Price has remained within the internal range for an extended period and has yet to target the weak internal low. A contributing factor could be the bullish nature of the H4 timeframe's internal range, which has reacted from a discounted level at 50% of the internal equilibrium (EQ).
Intraday Expectation:
Technically price to continue bullish, react at either premium of internal 50% EQ or M15 demand zone before targeting weak internal low priced at 3,120.765.
Alternative scenario:
Price can be seen to be reacting at discount of 50% EQ on H4 timeframe, therefore, it is a viable alternative that price could potentially print a bullish iBOS on M15 timeframe.
Note:
Gold remains highly volatile amid the Federal Reserve's continued dovish stance and persistent geopolitical uncertainties. Traders should implement robust risk management strategies and remain vigilant, as price swings may become more pronounced in this elevated volatility environment.
Additionally, President Trump’s recent tariff announcements are expected to further amplify market turbulence, potentially triggering sharp price fluctuations and whipsaws.
M15 Chart:
Don't chase gold if it falls below $3,300
The Trump administration's tariff policy has been stopped through judicial procedures. Affected by this news, it is inevitable that gold will continue to fall back today: yesterday's rebound hit the resistance level and fell back to $3,325. The market fell sharply in the early trading, and the market pattern quickly changed from range fluctuations to bearish dominance. From a technical analysis, the bearish pattern of the medium-term weekly cycle is forming effective pressure. Even if there is a sharp rebound in the future and breaks through the recent highs, it is very likely to be a bull trap-essentially a precursor to a return to a downward trend after a decline.
Gold/USD
Sales @3270-3280
TP: 3250-3240
sl: 3290
⭐️ Note: Labaron hopes that traders can properly manage their funds
- Choose a lot size that matches your funds
- Profit is 4-7% of the fund account
- Stop loss is 1-3% of the fund account

Risk aversion cools down, gold may continue to fall
📌 Driving events
The International Trade Court in Manhattan, USA, blocked Trump's "Liberation Day" trade measures. This news is conducive to shorting gold. This news is undoubtedly a reversal of Trump's "reciprocal tariff" policy implemented on April 3, slapping Trump in the face! Gold has been mainly driven by tariffs this year, and the decline is mainly due to the easing of tariffs. Spot gold has fluctuated sharply recently. After opening at $3285.91/ounce in the Asian session, it reached a high of $3294.46/ounce, and then fell sharply. The lowest reached around $3240 and continued to fall.
📊Comment analysis
The volatility of the Asian session highlights the fierce game between long and short positions. The changes in risk aversion caused by previous geopolitical and economic data, and investors' profit-taking and other factors are intertwined. Subsequent investors need to keep a close eye on key information such as the minutes of the subsequent Federal Reserve meeting in order to grasp the trend of gold prices.
💰Strategy Package
After the Asian session opened, gold was affected by the news and quickly plunged through the 3280-85 area support. After a rapid decline in important support, the upper 3280-85 constituted the next strong resistance, the strong and weak dividing line. Below it, the weak position is expected to gradually fall to 3245-50 before reversing the short pattern, and further to 3225-20 and 3200. Given that the 3250-45 area is a recent bullish breakthrough, the 3245-50 area support is bound to usher in a strong rebound during the day, and further attention will be paid to the 3220-25 area and the 3200 mark support rebound. Refer to it to formulate trading strategies!
⭐️ Note: Labaron hopes that traders can properly manage their funds
- Choose the number of lots that matches your funds
- Profit is 4-7% of the fund account
- Stop loss is 1-3% of the fund account

Is Gold’s Momentum Strong Enough to Break $3,400?📊 Market Overview:
Gold prices retreated slightly as stronger-than-expected U.S. consumer confidence data boosted expectations that the Federal Reserve may keep interest rates elevated for an extended period. This lent strength to the U.S. dollar, weighing on gold. Meanwhile, a more stable geopolitical tone—particularly in U.S.-EU trade discussions—has reduced safe-haven flows into gold.
📉 Technical Analysis:
• Key Resistance: $3,345 – $3,355
• Nearest Support: $3,270 – $3,280
📌 Outlook:
Gold may remain under pressure in the short term if the U.S. dollar stays firm and the Fed’s hawkish stance persists. However, the $3,270 support zone remains a key pivot for any potential rebound.
💡 Suggested Trading Strategy:
SELL XAU/USD at: $3,345 - $3,350
🎯 TP: $3,325
❌ SL: $3,355
BUY XAU/USD at: $3,270 – $3,280
🎯 TP: $3,290
❌ SL: $3,260

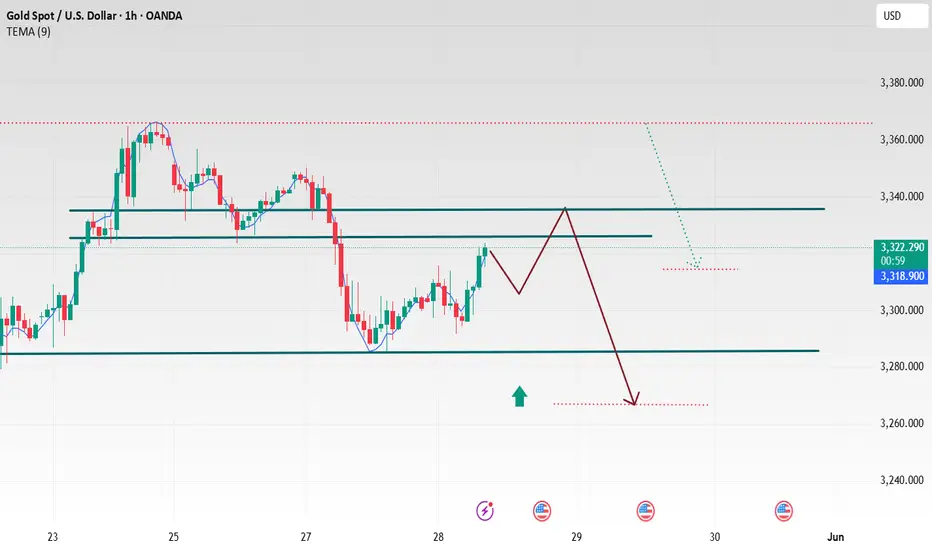
Gold May Undergo Short-Term Correction as USD Rebounds📊 Market Overview:
Gold (XAU/USD) is trading around $3,320/oz on May 28, 2025, after failing to break above a key resistance zone. The US dollar’s recovery and rising Treasury yields are putting short-term pressure on gold, despite lingering geopolitical tensions.
📉 Technical Analysis:
• Key Resistance: $3,330 – $3,360
• Nearest Support: $3,280 – $3,235
• EMA 09: Price is currently above the EMA 09, indicating that the upward trend remains intact.
• RSI Indicator: RSI stays above the 50 level, suggesting momentum is still bullish.
• Candlestick Pattern: A doji near the $3,330 zone signals market indecision.
📌 Outlook:
Gold may see a mild correction if the USD continues to strengthen. However, holding above $3,280 would keep the bullish momentum alive.
💡 Suggested Trading Strategy:
🔻 SELL XAU/USD at: $3,330
🎯 TP: $3,310 (200 pips)
❌ SL: $3,340
🔺 BUY XAU/USD at: $3,285
🎯 TP: $3,305 (200 pips)
❌ SL: $3,275
Gold is about to reach the shorting zone
The tariff policy against Europe and Apple was temporarily shelved last Friday due to the decline in the credibility of the Trump administration, which failed to push gold prices up this week. Instead, gold prices continue to fluctuate within the downward channel. Currently, the focus is on the resistance level of $3,325-3,335, and shorting can be attempted near this level.
Pay close attention to whether the support level of $3,280 and the resistance level of $3,365 are broken.
Gold closed with a big negative line, and may fall below 3285
📌 Driving events
On Monday, gold prices fell nearly 2%, falling below the $3,300 mark. Investor sentiment improved after U.S. President Donald Trump decided to postpone the imposition of tariffs on EU imports. The recovery in risk appetite, coupled with the dollar's small rebound from last week's decline, put pressure on the non-yielding precious metal.
Earlier, President Trump and European Commission President Ursula von der Leyen had a call over the weekend and finally decided to postpone the U.S. plan to impose a 50% tariff on EU goods to July 9. The move eased global trade concerns, prompted investors to shift away from safe-haven assets other than the dollar, and pushed global stocks higher.
📊Commentary Analysis
Gold showed a downward trend on Tuesday and has now broken below the 5-day moving average. This change has turned the market from a previous strong rise to a volatile trend. However, to determine whether the market has weakened, further observation is needed.
From the perspective of upper resistance, focus on the position near 3350. This position is not only yesterday's high point, but also the resistance position formed by the extension of the line connecting the high points of 3350 and 3438. Once the price breaks through this resistance level, it means that the market will return to a strong upward trend. In fact, it is near 3325 or the low point in the previous decline. It is necessary to pay attention to the top and bottom conversion here. The support level below is first yesterday's low of 3285 and the previous low of 3280.
💰Strategy Package
Operation strategy;
Short gold near 3325, defend 3335, target 3305-3285
Long gold near 3280, defend 3270, target 3300-3320
⭐️ Note: Labaron hopes that traders can properly manage their funds
- Choose the number of lots that matches your funds
- Profit is 4-7% of the fund account
- Stop loss is 1-3% of the fund account

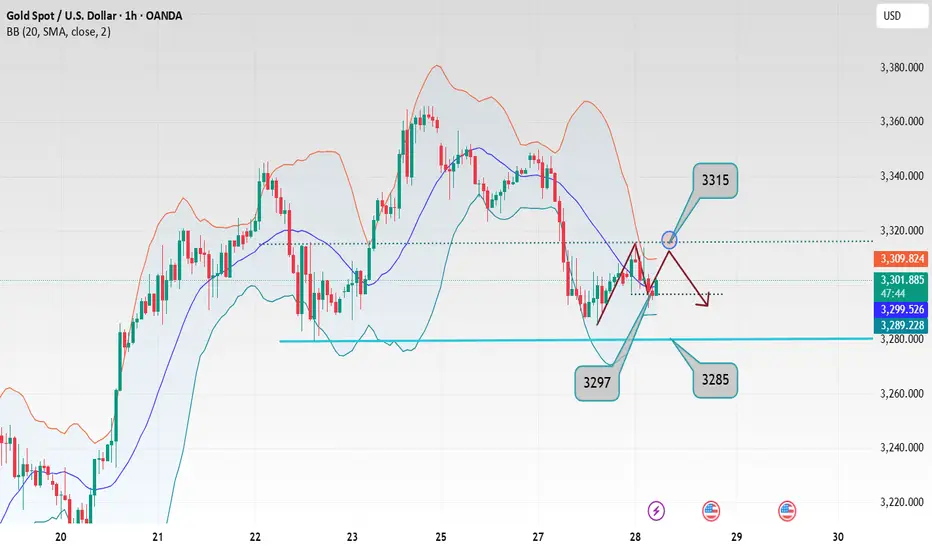
Gold 3315 gains and losses are the key
📌 Driving events
From the news perspective, data released by the U.S. Department of Commerce on Tuesday showed that U.S. durable goods orders in April plunged 6.3% month-on-month, with an expected value of -7.8% and a previous value revised from 9.20% to 7.50%. Volatile commercial aircraft orders plunged 51.5% in April after rising in March. Boeing said it received only eight aircraft orders in April, the lowest since May 2024, far lower than the 192 orders in March, the highest since 2023. Affected by the sharp drop in commercial aircraft orders, U.S. durable goods orders fell more than expected in April, with core capital goods orders (excluding aircraft and military hardware) falling 1.3%, the biggest drop since October last year. Under the influence of uncertainty in tariffs and tax policies, corporate investment willingness is weakening.
Through the data, it is not difficult to find that American companies have shown obvious caution in assessing the demand outlook and have shifted their focus to cost reduction, which directly reflects the impact of uncertainty brought about by Trump's trade policy. At the same time, the tax legislation being debated in Congress has also put companies on the sidelines, further suppressing the impulse to invest.
📊Comment Analysis
After the pullback on Monday this week, the decline accelerated on Tuesday, and the continuous decline came back, changing the strong upward trend of last week
💰Strategy Package
In terms of operation, in the short term, long and short operations can be carried out in the range of 3315-3297 US dollars, and the support position of 3285/80 should be paid attention to below; medium and long-term investors can buy on dips and take advantage of geopolitical risks and the trend of weak US dollars to gradually establish long positions.
⭐️ Note: Labaron hopes that traders can properly manage their funds
- Choose the number of lots that matches your funds
- Profit is 4-7% of the fund account
- Stop loss is 1-3% of the fund account
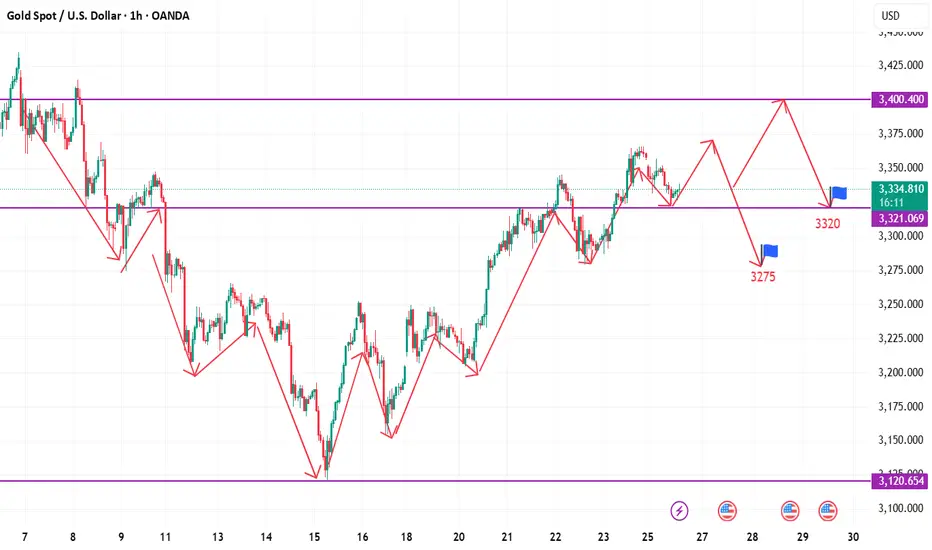
Spot gold fell below the 3330 mark
📌 Driving events
The trend of gold prices this week needs to focus on the following three major risk events:
First, the confrontation between Israel and the Houthis intensified this week. On May 25, the Houthis used hypersonic missiles to attack Israel's Ben-Gurion International Airport for the first time, resulting in the interruption of airport operations. Israel subsequently launched a retaliatory air strike. Iran has made it clear that it "will not give in on uranium enrichment activities" and warned that it will take hundreds of alternatives if it is sanctioned
Second, although the Trump administration's threat to impose a 50% tariff on the European Union has been postponed to July 9, the market is still concerned about it. If the trade war escalates, it may lead to increased global economic uncertainty, which will in turn boost the safe-haven demand for gold. However, the repetition of tariff policies may also trigger changes in market risk preferences and have a two-way impact on gold prices.
Third, record-breaking air strikes in the Russian-Ukrainian conflict Russia launched the largest air strike since the war on Ukraine on May 26, launching 355 drones and 9 cruise missiles, and many parts of Ukraine suffered heavy losses. The attack has heightened market concerns about geopolitical risks, pushing gold prices higher in the short term. However, due to expectations of a prolonged conflict, market demand for safe-haven assets may gradually weaken. Technically, gold has performed strongly at support levels near $3,330.
📊Commentary Analysis
This week, gold prices will remain highly volatile under the intertwined influence of multiple risk events. Investors need to remain vigilant and flexibly adjust strategies to respond to market changes. Analyze the market, make plans, and manage risk.
💰Strategy Package
In terms of operations, investors are advised to pay close attention to the situation in the Middle East and the progress of Trump's tariff policy. In the short term, short selling can be carried out in the range of $3,330-3,305, with a target of around $3,290-3,280. Profits can be taken in batches, and a light position can be taken long after breaking through $3,310, with a target of $3,360-3,380. Profits can be taken in batches, and medium- and long-term investors can make layouts on dips, taking advantage of geopolitical risks and the trend of a weak dollar, and gradually establish long positions.
⭐️ Note: Labaron hopes that traders can properly manage their funds
- Choose a lot size that matches your funds
- Profit is 4-7% of the capital account
- Stop loss is 1-3% of the capital account
The mouth can't drive gold up
💡Message Strategy
US President Trump announced that the deadline for EU trade negotiations will be extended to July 9, and at the same time withdrew the threat of a 50% tariff on EU goods originally scheduled for June 1. This decision marks a phased easing of US-EU trade tensions, leading to a significant cooling of market risk aversion.
The statement of European Commission President Ursula von der Leyen revealed the key reason for the extension: "The EU needs more time to reach a comprehensive agreement that is beneficial to both sides." It is worth noting that just three days ago on May 23, Trump also threatened to impose high tariffs on EU cars and other goods in a tough manner, and even considered wielding the tariff stick against iPhones produced outside the United States. These remarks pushed the gold price up more than 2% in a single day.
📊Technical aspects
At present, the direction of gold is only a correction and decline. The market is not driven by words. The idea of gold trend that has been emphasized last week is to pull back to high altitudes. Facts have proved that gold cannot break through the high pressure position.
All the news is filled with the atmosphere of gold rising. The truth is often in the hands of a few people. We should correctly judge the changes in the market and not blindly follow them.
💰 Strategy Package
Short Position:3340-3350,3360-3370
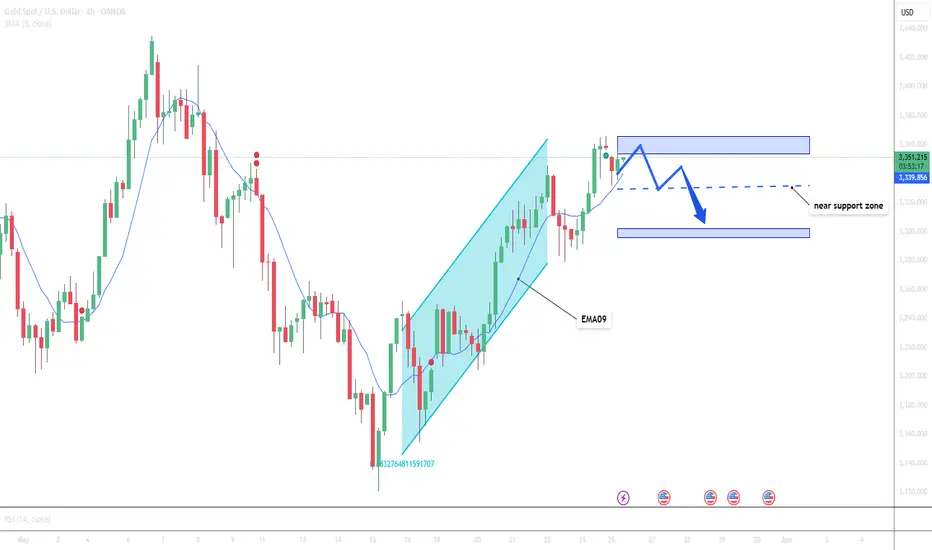
Gold May Undergo Short-Term Correction as USD Rebounds📊 Market Overview
Gold (XAU/USD) is trading around $3,309/oz after retreating from the $3,350 region during the Asian session today. Selling pressure emerged as U.S. Treasury yields rose and the USD rebounded slightly, despite expectations of potential Fed rate cuts in the near future.
📉 Technical Analysis
• Key Resistance: $3,350
• Nearest Support: $3,290
• EMA 09: Current price is below the EMA 09, indicating a short-term bearish trend.
• The downtrend is confirmed by bearish candlestick patterns and increasing trading volume in recent sessions.
📌 Outlook
Gold may continue its short-term correction if the USD continues to rebound and U.S. Treasury yields remain elevated. However, long-term support factors such as concerns over U.S. national debt and expectations of Fed rate cuts persist.

Gold bulls advance as expected Mainly go long on pullback.Today, gold opened lower and fell, reaching the lowest level of 3331. Then the bulls exerted their strength, reaching the highest level of 3356 and then adjusted back. The overall trend was highly consistent with the expected judgment. Looking back at the market last week, the technical side of gold continued the bullish pattern, and the oscillating upward trend was significant. From the daily level, the price repeatedly tested around the 3200 mark at the beginning of the week, and finally stabilized successfully, laying a solid foundation for the bull market. On Friday, it was supported by the 3280 mark, continuing the strong oscillating upward trend, forming a reverse middle Yang pattern, and the daily K line closed with an oscillating upward break of the middle Yang, fully demonstrating the short-term bullish pattern of gold prices, and bullish expectations continued to heat up.
Based on the current gold trend analysis, the focus below is on the 3330-3320 range support, and the focus above is on the 3380-3400 resistance. In terms of overall strategy, the bullish thinking is maintained before breaking 3320 to avoid blindly guessing the top.

Gold May Face Short-Term Correction Amid Strong Resistance📊 Market Overview:
Gold (XAU/USD) is trading around $3,335, retreating from a two-week high of $3,345.48. The US Dollar's weakness, driven by fiscal concerns and President Trump's extension of the EU tariff deadline to July 9, has supported gold prices. However, the easing of global trade tensions has limited the precious metal's upside .
📉 Technical Analysis:
• Key Resistance: $3,350, $3,364
• Nearest Support: $3,330, $3,300
• EMA 09: Price is trading near the EMA 09, indicating a neutral trend.
• RSI (14): 69.311 – approaching overbought territory, suggesting potential correction.
• MACD (12,26): 13.57 – bullish signal, but momentum is slowing.
• Williams %R: -17.476 – in overbought zone, indicating possible short-term pullback .
📌 Outlook:
Gold may experience a short-term correction if it fails to break above the strong resistance at $3,350. Sustained trading below this level could lead to selling pressure, especially as technical indicators point to overbought conditions.
💡 Suggested Trading Strategy:
• SELL XAU/USD at: $3,345 – $3,350
🎯 TP: $3,330
❌ SL: $3,355
• BUY XAU/USD at: $3,300 – $3,310
🎯 TP: $3,340
❌ SL: $3,290