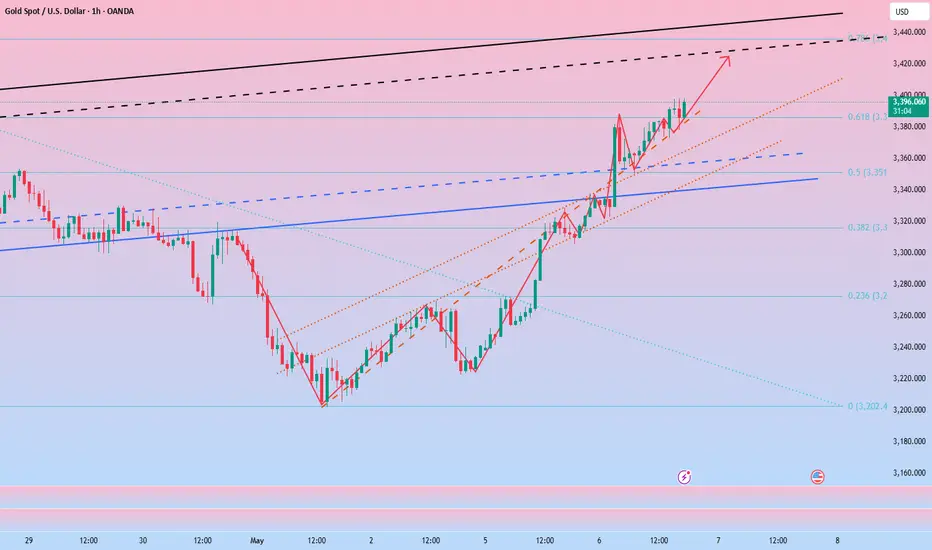
Gold still has the potential to extend to 3420-3430.Fundamentals:
Focus on the Fed's interest rate decision;
Technical aspects:
Gold rose to 3397 and encountered resistance and fell back, and the bulls' momentum was insufficient. But I think the gold bulls are far more than that. Gold is bound to hit 3400, and even continue to the 3420-3430 area; since gold rebounded after hitting 3200, it has repeatedly built a solid bottom structure support below, and the oscillating rise has effectively supported the continued rebound of gold. As the center of gravity of gold moves up, the support structure also gradually moves up. The current short-term support is in the area around 3380-3370, and the second is in the area of 3365-3355.
Trading situation:
According to today's trading strategy: Go long on gold at 3350 in the morning and around 3375 in the afternoon. In order to lock in profits in time, manually close orders at 3366 and 3394 respectively. Today, the total profit in gold long transactions exceeded 360pips.
Trading strategy:
During the rising shock, there are profit opportunities for both long and short parties in some areas, but currently, overall, bulls have the advantage and are mainly long gold. Consider the opportunity to go long when gold falls back to the area around 3380-3370, TP: 3400.
Goldinvesting
3420, gold prices can reach today
📌 Gold driving factors
Driven by the weakening of the US dollar and safe-haven demand, spot gold closed up $93.77 on Monday, up 2.9%, at $3333.32 per ounce.
On Monday local time, US President Trump signed an order on biomedical research, hoping to take the opportunity to promote the US pharmaceutical manufacturing industry. Trump also announced that tariffs on pharmaceutical products will be announced in the next two weeks.
Kitco Metals senior metals analyst Jim Wyckoff said: "We see continued inflows of safe-haven demand, keeping gold prices high. Gold prices will remain above $3,000 per ounce, at least in the short term."
Gold is often seen as a safe-haven tool in uncertainty and performs well in a low-interest rate environment. Gold prices have soared 26.3% this year and have set new historical highs many times.
📊Comment Analysis
Bulls regained their dominance, and the upward trend approached above 3400 before the market expected a rate cut
💰Strategy Set
🔥Sell Gold Area: 3418-3420 SL 3425
TP1: $3410
TP2: $3400
TP3: $3385
🔥Buy Gold Area: $3323 - $3321 SL $3316
TP1: $3330
TP2: $3340
TP3: $3358
⭐️ Note: Labaron hopes that traders can properly manage their funds
- Choose the number of lots that matches your funds
- Profit is 4-7% of the fund account
- Stop loss is 1-3% of the fund account
Gold is expected to fall in the short term
Gold rebounded to around 3380, and the K-line decline was inevitable, so there is no doubt that the gold price will fall. The current K-line closed with an upper shadow, which is a sign that the bulls have reached their peak.
Trading ideas: short gold near 3380, stop loss 3390, target 3350
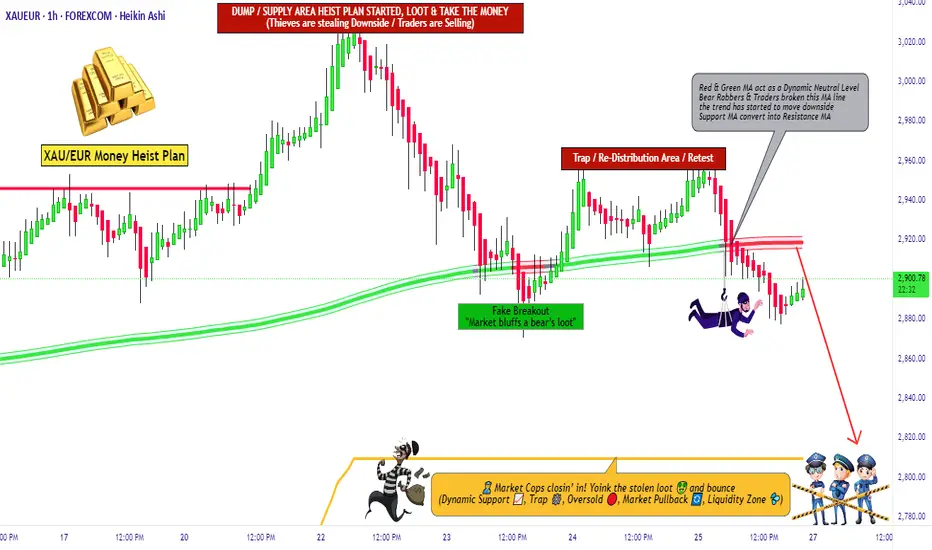
XAU/EUR "The Gold" Metal Market Heist Plan (Day Trade)🌟Hi! Hola! Ola! Bonjour! Hallo! Marhaba!🌟
Dear Money Makers & Robbers, 🤑💰✈️
Based on 🔥Thief Trading style technical and fundamental analysis🔥, here is our master plan to heist the XAU/EUR "The Gold" Metal Market. Please adhere to the strategy I've outlined in the chart, which emphasizes short entry. Our aim is the high-risk YELLOW MA Zone. Risky level, oversold market, consolidation, trend reversal, trap at the level where traders and bullish robbers are stronger. 🏆💸"Take profit and treat yourself, traders. You deserve it!💪🏆🎉
Entry 📈 : "The vault is wide open! Swipe the Bearish loot at any price - the heist is on!
however I advise to Place sell limit orders within a 15 or 30 minute timeframe most nearest or swing, low or high level for Pullback Entries.
Stop Loss 🛑:
📌Thief SL placed at the nearest/swing High or Low level Using the 1H timeframe (2950) Day/Swing trade basis.
📌SL is based on your risk of the trade, lot size and how many multiple orders you have to take.
Target 🎯: 2810 (or) Escape Before the Target
💰💵💸XAU/EUR "The Gold" Metal Market Heist Plan (Scalping/Day Trade) is currently experiencing a Bearish trend.., driven by several key factors.👇👇👇
⚠️Trading Alert : News Releases and Position Management 📰 🗞️ 🚫🚏
As a reminder, news releases can have a significant impact on market prices and volatility. To minimize potential losses and protect your running positions,
we recommend the following:
Avoid taking new trades during news releases
Use trailing stop-loss orders to protect your running positions and lock in profits
💖Supporting our robbery plan 💥Hit the Boost Button💥 will enable us to effortlessly make and steal money 💰💵. Boost the strength of our robbery team. Every day in this market make money with ease by using the Thief Trading Style.🏆💪🤝❤️🎉🚀
I'll see you soon with another heist plan, so stay tuned 🤑🐱👤🤗🤩
Buy gold, it will continue to 3350!Fundamentals:
Focus on Trump and the Fed;
Technical aspects:
Currently, gold is moving in a fluctuating upward manner, and in the short term, the effective double bottom structure constructed in the area around 3200 and 3220 supports the continued upward movement of gold. In the short term, gold is not very willing to fall, and it has not even been able to fall back below 3300 again. If gold breaks through the 3330-3335 area during the rebound, then gold will inevitably continue to rise to the area around 3350, or even the area around 3380.
Trading strategy:
If gold retreats next, we will mainly focus on the opportunity to go long on gold in the 3315-3305 area; TP: 3350
Start shorting gold and seize the opportunity to make a profit!!Fundamentals:
Focus on Trump and the Fed
Technical aspects:
Gold fell back to around 3253 and then rebounded, and continued to rise to around 3318. The upward momentum in the short term looks particularly strong. According to the current structure, as gold gradually rebounds, off-market buying funds gradually enter the market, pushing gold further up. However, when facing the previous turning point position area of 3325-3335, the market is cautious and it is difficult to break through this area in a short period of time. Therefore, when gold gradually approaches the 3325-3335 area, gold may usher in a wave of retracement in the short term; obviously, the retracement area we can foresee is the 3295-3285 area first.
Trading strategy:
Consider shorting gold in the 3315-3325 area, TP: 3295-3285
Gold rises as a safe haven, how to plan the market outlook
📌 Gold Drivers
Gold prices rose more than 2% on Monday, benefiting from a weaker dollar and safe-haven inflows as U.S. President Donald Trump's new tariffs reignited concerns about the impact of a global trade war. Spot gold rose by more than 2.3%, US gold futures rose by 2.4%, and the US dollar index fell by 0.4%. On Sunday, Trump wrote on his social platform Truth Social: "I authorize the Department of Commerce and the United States Trade Representative to immediately initiate procedures to impose a 100% tariff on all films produced abroad entering the United States. We want to make movies in the United States again!" But he did not specify how these tariffs will be implemented.
📊Comment analysis
Gold prices continue to accumulate and have broken through 3330 points. It can be found that gold is now completely above the trend line.
💰Strategy package
The only suppression position above is currently around 3350.
The support below is currently at 3275-85.
If gold does not retreat, then the upper side will directly test the suppression near 3350.
On the contrary, if gold chooses to retreat next, then pay attention to 3275-85.
As long as gold retreats and stabilizes in the 3275-85 range, you can directly enter the market to do more.
Continue to look at 3350 above. If it breaks through and stabilizes above 3350 in the future, you will see the 3380-3420 range.
⭐️ Note: Labaron hopes that traders can properly manage their funds
- Choose the number of lots that matches your funds
- Profit is 4-7% of the fund account
- Stop loss is 1-3% of the fund account
There are short-selling opportunities in gold in the short term!
After gold rebounded, there was strong pressure around 3315, so it was a short opportunity, sl: 3325, tp: 3290

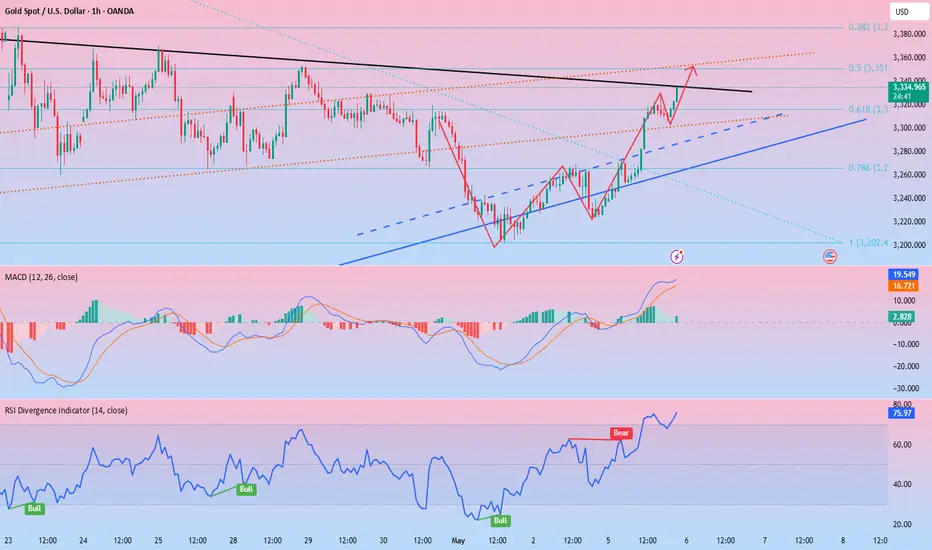
GOLD / XAUUSD: Breaking the down channel (correction wave)Therefore, if the 21-day SMA holds in the event of a weak US Non-Farm Payroll (NFP) report, a rebound toward the immediate static support-turned-resistance at 3260 could occur.
A sustained move above that level would encourage Gold buyers to push further toward the former channel support, now acting as resistance, at 3405.

Is the gold market ushering in betting?
📌 Gold driving factors
There are two aspects to look at the impact of April non-agricultural data on the gold market.
One is the data itself and the existing economic environment, and the other is combined with the technical aspect.
The market itself is troubled by the tariff issue. Whether it is the US stock market or the US dollar, it needs good economic data to boost it. Once the April non-agricultural performance is poor, the market sell-off will be out of control, and it also means that the risk of US economic recession is increasing.
Secondly, good data performance reduces the Fed's expectations for rate cuts. As we all know, the Fed's expectations for rate cuts or rate cuts are theoretically good for gold prices, and vice versa.
The cooling of the tariff issue may come soon, which is also not conducive to the rise in gold prices, but cooling does not mean the end, and the final achievement will definitely take some time.
📊Comment Analysis
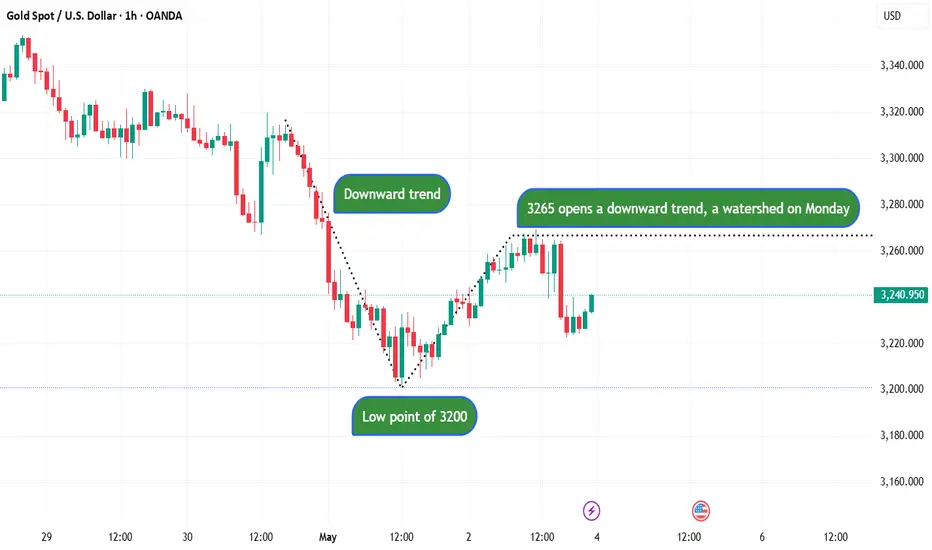
"After experiencing short-term fluctuations, the price of gold appears to be relatively stable around $3,250. If it is to rise further, it must break through the $3,300 mark. But whether the market is ready to break through this point remains to be seen."
At present, gold is still in a continuous adjustment trend. Although it retreated to the 3,200 line on Friday and then rose again, it is still under pressure below the opening of the 3,265 decline. This is also the pressure level we need to pay close attention to next Monday!
The sideways trading period on Friday is long enough, and it is time for a breakthrough. So how should we arrange the market next week? It should not rise, but it will fall instead. It is not difficult to understand the trend on Friday. If it rises in the morning next week, it should be noted that the upper 3,265 is the watershed. If it breaks through, it will continue to rise, but if it is still under pressure, it is our opportunity to enter the short position!
💰Strategy Package
Operation ideas for next week:
Short at 3265 gold, stop loss at 3275, target 3230-3220;.
The market fluctuates violently, and real-time entry and exit are mainly based on real-time guidance!
⭐️ Note: Labaron hopes that traders can properly manage their funds
- Choose the number of lots that matches your funds
- Profit is 4-7% of the fund account
- Stop loss is 1-3% of the fund account
As expected, gold prices continue to fall
📌 Gold driving factors
There are two aspects to look at the impact of April non-agricultural data on the gold market.
One is the data itself and the existing economic environment, and the other is combined with the technical aspect.
The market itself is troubled by the tariff issue. Whether it is the US stock market or the US dollar, they all need good economic data to boost. Once the April non-agricultural performance is poor, the market sell-off will be out of control, and it also means that the risk of US economic recession will increase.
Secondly, good data performance reduces the Fed's expectations for rate cuts. As we all know, the Fed's expectations for rate cuts or implementation of rate cuts are theoretically good for gold prices, and vice versa.
The cooling of the tariff issue may come soon, which is also not conducive to the rise in gold prices, but cooling does not mean the end, and the final achievement will definitely take some time.
📊Comment Analysis
Recently, we have been very good at controlling the gold market. Keeping an eye on the changes in fundamental news is the focus of research and judgment. Of course, the technical direction is also of reference value. The next market will revolve around fundamental news, especially in the context of tariffs.
The non-agricultural data exceeded expectations, and the tariff issue may see "dawn". If it can be confirmed in the near future, the risk aversion sentiment will subside in the short term, which is not conducive to the rise of gold prices. There is a high probability that there is room for retracement, so there is no rush to chase now.
💰Strategy Package
Operation ideas for next week:
Gold 3265 short, stop loss 3275, target 3230-3220;.
⭐️ Note: Labaron hopes that traders can properly manage their funds
- Choose the number of lots that matches your funds
- Profit is 4-7% of the capital account
- Stop loss is 1-3% of the capital account
Non-farm data is released, and gold is still going to fall.
📌 Gold information
Today, the market will usher in the heavy non-farm data for April. From the expected value, there are only 130,000 people, far lower than the expected 228,000 people, and the unemployment rate remains at 4.2%.
If we refer to the unsatisfactory ADP data in April, then the number of non-farm people in April should have declined, or it is lower than expected, but the ADP data cannot fully correspond to the final non-farm data. This is the answer given to us by too many experiences in the past, so it cannot be concluded that the non-farm data this time will be lower than expected.
📊Comment analysis
Combined with the technical aspect, the strong technical pressure above the international gold price is around 3280, and then the 3300 mark. Even if it rebounds next, the pressure of the above two prices cannot be broken, and there is still a probability of a pullback adjustment. The initial support below is 3230, and after breaking through the position, it will follow the trend to explore 3205.
💰Strategy Package
If today's non-agricultural data cannot provide strong support for gold prices, the rise in gold prices in the short term will be difficult to sustain. The specific decision can only be made after the final release of the afternoon data and the guidance on prices. The trend fluctuations tonight will be very intense. Remember to strictly control your positions to prevent risks.
⭐️ Note: Labaron hopes that traders can properly manage their funds
- Choose the number of lots that matches your funds
- Profit is 4-7% of the fund account
- Stop loss is 1-3% of the fund account

Gold starts a unilateral decline?
📌 Gold information
U.S. stock indexes fell sharply in midday trading due to disappointing U.S. economic data. On Friday, the U.S. Department of Labor will release the crucial monthly employment report. This is likely to be the most important U.S. data point so far this year.
In other news, Dow Jones News Service reported: "Tariffs are beginning to bring pressure, prompting the Eastern giant to increase stimulus to support economic growth.
📊Comment analysis
For international gold, what you need to do now is to follow the market. Don't think about bottom fishing. You can do a short-term rebound during the day. When the market has clearly broken the structure, you should choose to believe in the technical side, rather than speculate on the next support. This will only be endless. At this stage, if you fail to bottom fishing, are you still ready to try again near the integer of 3200? This is not over yet. Even if it falls below 3200, the 3180 horizontal support will be immediately below.
This round of decline is about to completely give up the second rise in the front end, depending on 3180. This is why I just said that 3200 will immediately encounter a new support. The reason why many people choose to go long above 3240 is also because it is the first stage of the high platform of the front-end surge, and it is necessary to defend. Unfortunately, the defense is not successful now. In other words, if you want to go short next, you have to look at the continued decline. What are the characteristics of the continued decline? You certainly can't tolerate it having an excessive rebound, so don't think about any high-altitude trading strategy.
💰Strategy Package
Short position:
Actively participate at 3230 points, and the profit target is around 3200 points
⭐️ Note: Labaron hopes that traders can properly manage their funds
- Choose the number of lots that matches your funds
- Profit is 4-7% of the capital account
- Stop loss is 1-3% of the capital account

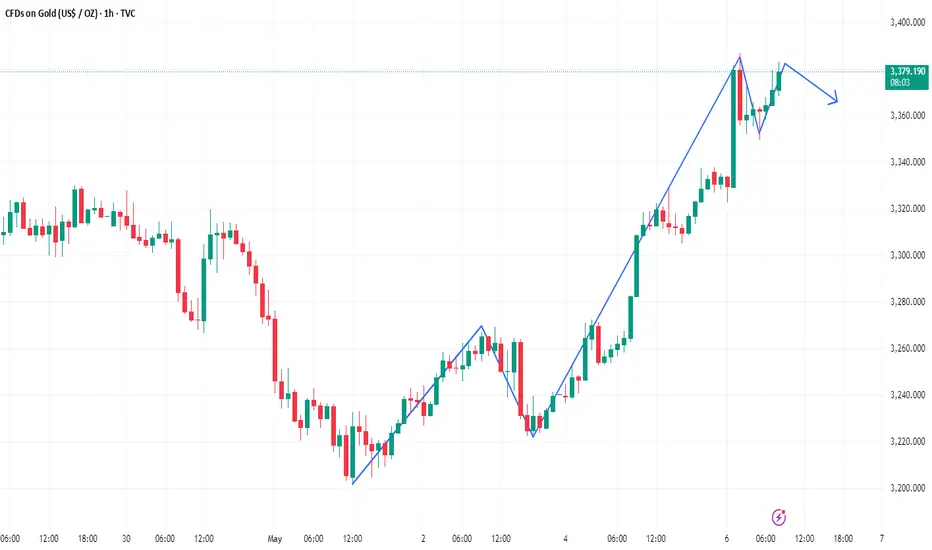
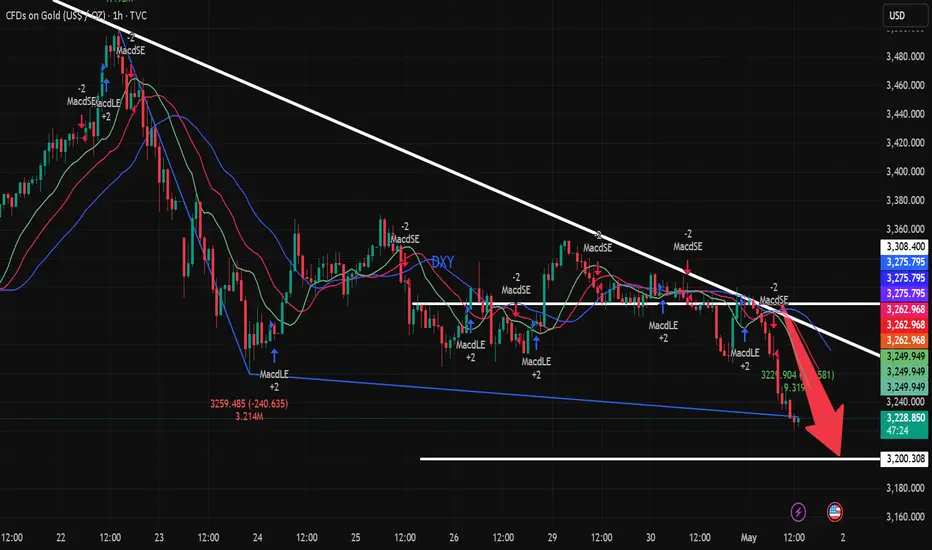
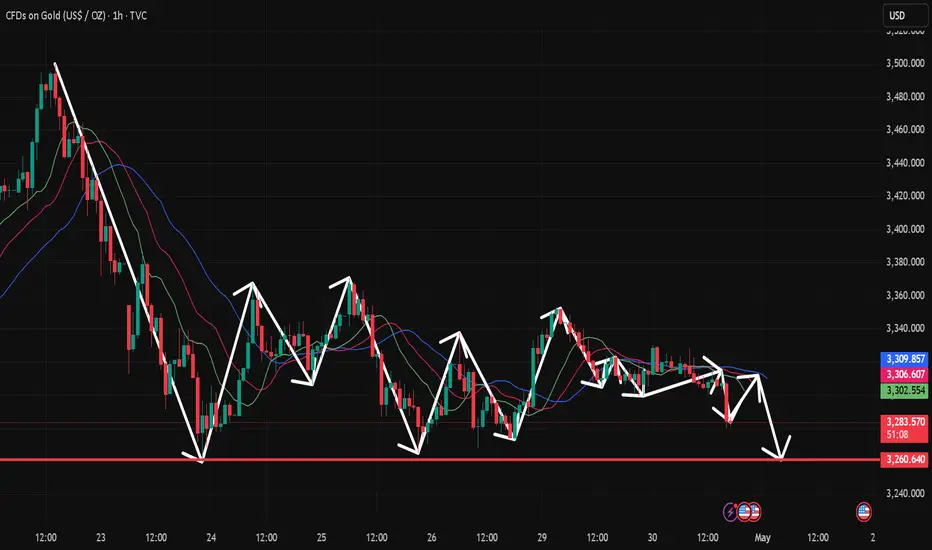
Gold 1H Breakdown: Top Confirmed, Trend ReversedJust price, structure, and volume — tracked in real time.
🧠 Chart Breakdown:
✅ Trend Start / Structure Reclaim — Price regained key support and moving averages with momentum. Structure flipped bullish and trend began.
⛔ Top Exhaustion — Price reached new highs but began to stall. Volume dropped, and candles began curling — signaling a loss of momentum.
⚠️ Bounce Setup — After the pullback, buyers attempted to step back in — but structure never confirmed. No follow-through = no entry.
🚨 Breakdown Trigger — Sellers regained full control. Price broke below key levels with conviction. Volume confirmed the shift.
👀 Current Move — Price is pushing into new lows. Breakdown structure remains active until proven otherwise.
Always happy to be helpful.

Technical analysis of short-term gold operations!!!On Wednesday, the gold price generally showed a downward trend. The highest price rose to 3327.91 on the day, and the lowest price fell to 3266.79, closing at 3288.16. In view of the fact that gold fell under pressure during the early trading on Wednesday and broke through the four-hour and daily support as expected, and then the US market rebounded again and came under pressure, and finally ended in a big negative state at the daily level. The price has fallen below the daily support, so we need to pay attention to the continuation of the band decline in the future.
From a multi-cycle analysis, first observe the monthly rhythm. The price rose for three months in the early stage and then a single-month correction appeared. Recently, it has risen for four months and then a single-month correction appeared. Therefore, according to the rhythm, four consecutive positives have appeared. For May, we must pay attention to market risks. From the weekly level, the gold price is supported by the support level of the 3040 area. From the perspective of the medium-term, we can continue to maintain a bullish view, and the price drop is only a correction in the medium-term rise. From the daily level, the current price resistance is in the 3007 area, which is the key watershed of the band trend. If the price is below this position, the subsequent band will be treated as short. At the same time, for the short-term four-hour price resistance, it is around 3290, so the subsequent price will be treated as short under the four-hour resistance. In general, the price can be treated as short under the four-hour resistance and the daily resistance.
The gold correction continues!On the news:
Gold prices fell for a third day in a row as signs that trade talks between the United States and China may be progressing dampened demand for safe-haven assets. News that the Trump administration is about to announce the first batch of agreements, which will reduce planned tariffs on some countries, also eased concerns about the outlook for global trade.
Technical aspects:
After the current gold market broke down, it started to fall from around 3270, which is also the key position for us to continue to bet on the market falling. At present, the short position of gold is more advantageous. Then in the short term, gold will focus on the support near 3233. If it falls below, then gold will reach the 3200 mark.

Gold 3213 and 3272 are space switching points
📌 Gold information
The US non-farm payrolls report released this Friday (May 3) will become a market vane. If the employment data deteriorates significantly (such as the sharp drop in private employment growth shown by ADP), it may strengthen the expectation of interest rate cuts and promote the rebound of gold; on the contrary, if the data is stable, the US dollar may further suppress the price of gold.
The intraday decline in gold prices seems to be partly driven by technical selling pressure, after gold prices decisively fell below the key support level of $3,265-3,260. However, due to the unexpected contraction of US GDP and the intensification of signs of slowing inflation, the market's expectations for further interest rate cuts by the Federal Reserve (Fed) have increased, and the US dollar (USD) has found it difficult to maintain any significant rebound.
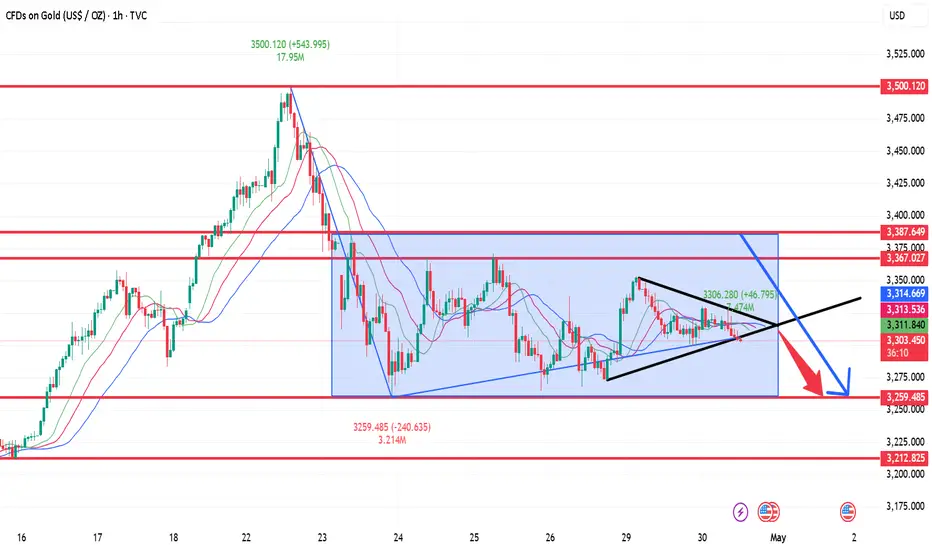
📊Comment Analysis
Gold price rose strongly by $544 in April. It entered the mode of space sweeping and adjustment from the confirmation of 3500. The next move is to sweep the range of the large range, starting at at least $40, and the range is $100, sweeping back and forth
💰Strategy Package
🔥Sell gold area: 3270-3272 SL 3277
TP1: $3260
TP2: $3250
TP3: $3240
🔥Buy gold area: $3178 - $3176 SL $3171
TP1: $3185
TP2: $3200
TP3: $3210
⭐️ Note: Labaron hopes that traders can properly manage their funds
- Choose the number of lots that matches your funds
- Profit is 4-7% of the fund account
- Stop loss is 1-3% of the fund account

Gold opens up callback space as expectedGold finally broke through the rhythm of continuous fluctuations in the morning and ushered in a relatively large correction.
After the cyclical retracement in the morning, a bottom-breaking market was formed. Generally, for a direct decline in the Asian session, we will put the watershed at the opening price, which is the current high point of 3290! But it is not very meaningful to look at this position now. According to the recent rhythm of Asian session decline, weak European session, and rebound in the US session. We can look at the second decline in the European session rebound.
But we should be more cautious in the US session. Especially in the second half of the US session,
Intraday short-term pressure: 3266-70 top and bottom conversion position below: hourly double bottom around 3211-3195 "Observe whether there is a key area for the signal of stopping the decline"
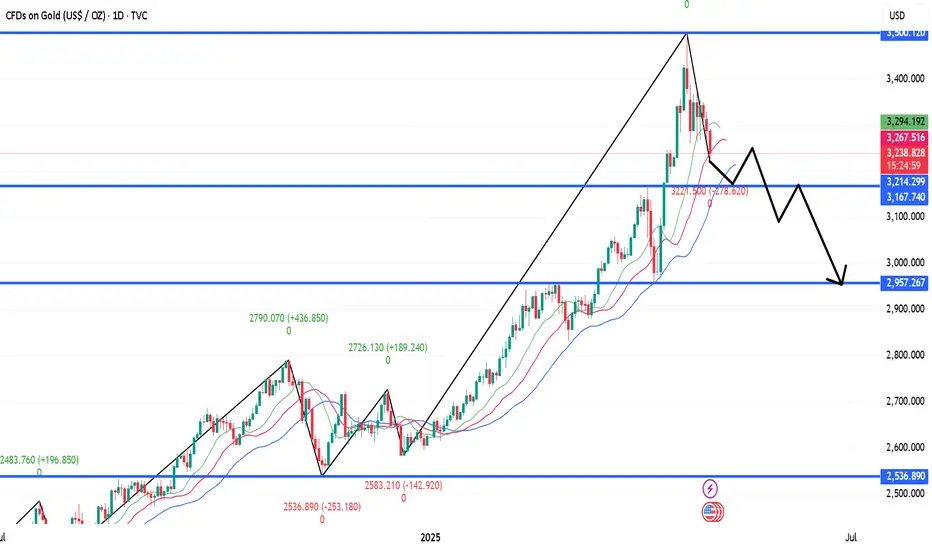
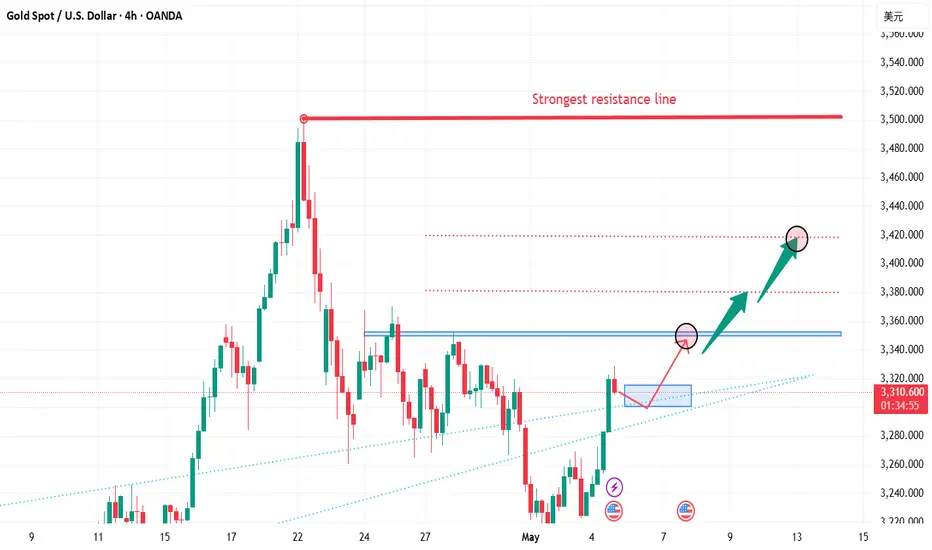
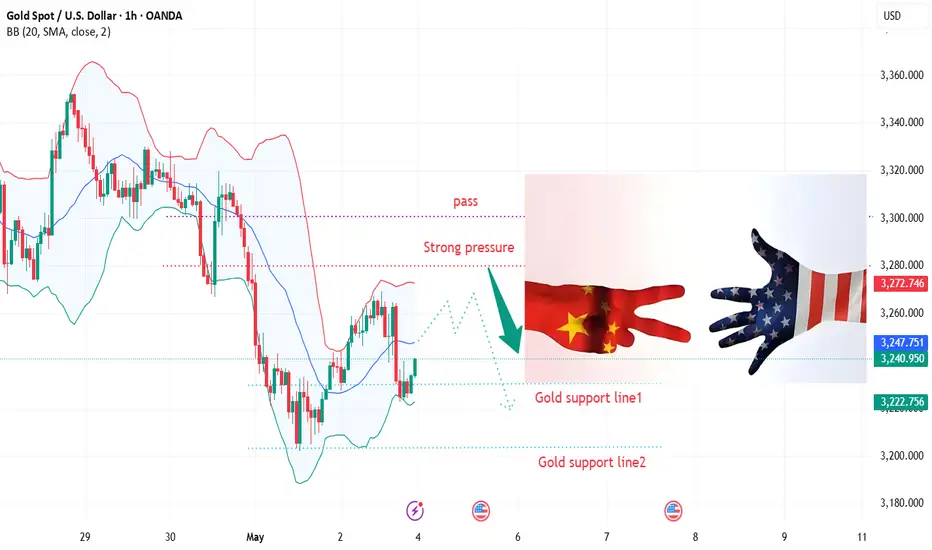
Gold is forming a head and shoulders pattern!Analysis and interpretation:
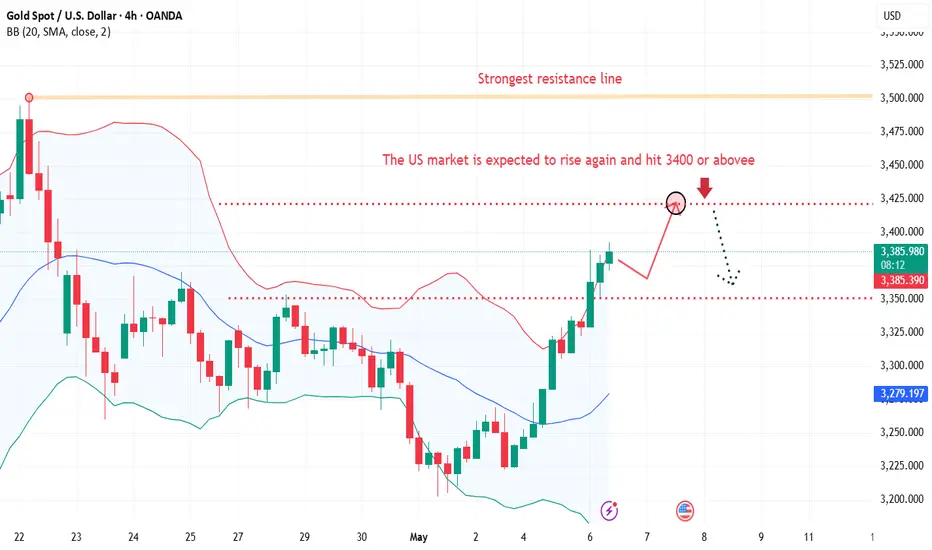
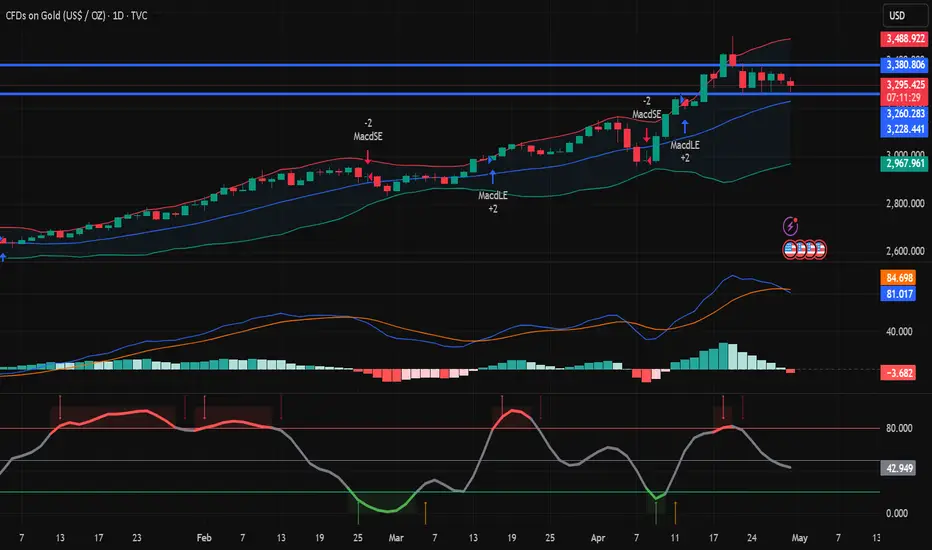
Gold prices have been on a strong upward trend since the beginning of 2025. The daily chart shows that gold prices have climbed from around $2,600 to around the $3,500 mark. Recently, gold prices have formed a consolidation trend in the range of $3,260 to $3,380, indicating that the bulls and bears are fighting fiercely here. It can be seen from the K-line chart that gold prices fell back after hitting a record high of $3,499.83 in April, but then gained support and rebounded at $3,260.
The Bollinger Band indicator shows that the upper track is at $3,465.75, the middle track is at $3,191.92, and the lower track is $2,918.08. The current price is running between the upper and middle tracks, indicating that the medium-term upward trend is still maintained. Although the gold price may fluctuate in the range of $3,260 to $3,380 in the short term, the overall upward trend has not changed.
The MACD indicator shows that DIFF is 81.35, DEA is 84.74, and the MACD value is -6.80. The histogram shows a shrinking state, indicating that the upward momentum has weakened, but no obvious short signal has been formed. The RSI indicator is around 58.81, which is in the neutral to strong area, and has not reached the overbought or oversold level, and there is still room for growth.
XAU/USD(20250430) Today's AnalysisMarket news:
The European Central Bank expects prices to rise 2.9% over the next 12 months, up from 2.6% in February, according to a monthly survey released on Tuesday. This is the highest level since April 2024. The three-year indicator rose slightly to 2.5%. The ECB's first five-year forecast was 2.1%.
Technical analysis:
Today's buying and selling boundaries:
3321
Support and resistance levels
3370
3352
3340
3303
3291
3273
Trading strategy:
If the price breaks through 3321, consider buying, the first target price is 3340
If the price breaks through 3303, consider selling, the first target price is 3291
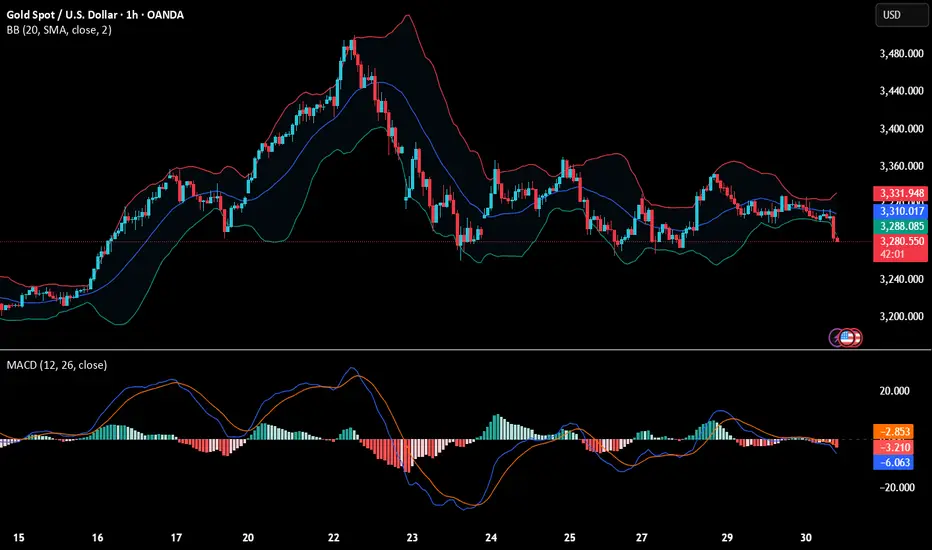
Gold falls as expected, awaiting guidance from ADPGold continued to fluctuate in 1 hour. Now, the gold fluctuation is most likely a relay of decline. Gold rebounds and continues to be short. The gold 1-hour moving average gradually begins to stick together, but it is still diverging downward. If it continues to cross downward to form a dead cross, then there is still room for gold shorts to fall. Gold hit a high twice and was suppressed by the 3330 line. Today, gold continued to be short at highs under the pressure of 3330.
Gold bulls continue to rebound every time. Now gold bulls obviously have no confidence in further rise, so gold shorts take the opportunity to exert their strength. Gold is still the home of shorts, and gold rebounds and continues to be short.
US trading operation ideas:
Gold 3320 short, stop loss 3330, target 3300-3290;
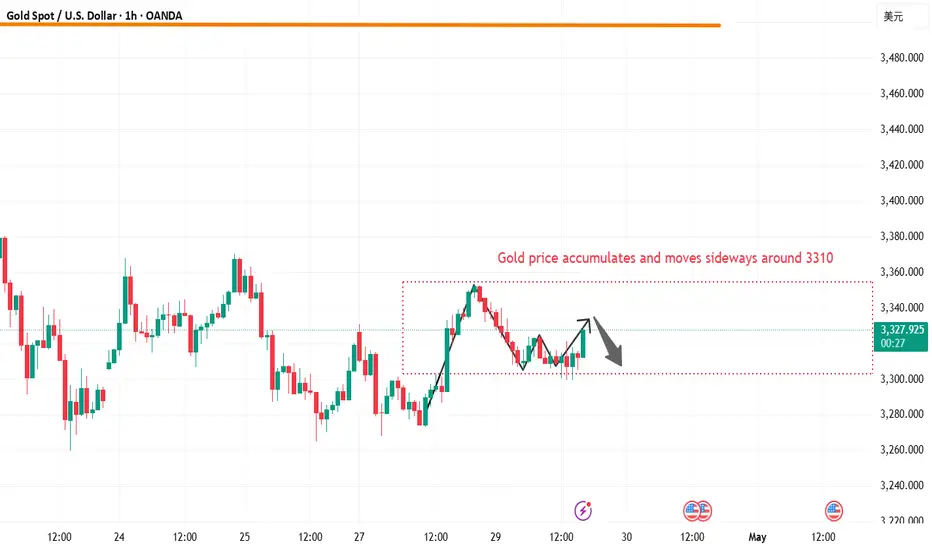
Gold maintains a volatile range, pay attention to subsequent breOn Tuesday, the gold price generally showed a downward trend. The highest price rose to 3348.45 on the day, and the lowest price fell to 3299.49, closing at 3316.95. On Tuesday, gold was under pressure during the early trading session, and then the price continued to fluctuate during the European and US trading sessions. Overall, the price is still running within the fluctuation range, but once the daily support is broken, it is expected to break the lower edge of the range.
From the multi-cycle analysis, first observe the monthly rhythm. The price rose for three months before and then a single-month correction occurred. Recently, it has risen for four months and then a single-month correction occurred. Therefore, according to the rhythm, April is generally bullish, but for May, we must pay attention to market risks. From the weekly level, the gold price is supported by the support level of the 3040 area. So from the perspective of the mid-line, we can continue to maintain a bullish view. From the daily level, the current price is supported by the 3004 area support. This position is the key watershed of the band trend. The market will further break down in the future, so it will be focused on in the future. At the same time, for the short-term four-hour price, it has been fluctuating up and down at the four-hour key position recently. Pay attention to the resistance of 3387 and 3370 on the top, and the 3260 area on the bottom. Before the data, the market as a whole tends to fluctuate temporarily. After breaking through the daily support, pay attention to the performance of breaking down the lower edge of the range.
Shorting opportunities are coming near 3330 in the US market!
📌 Driving events
Because the easing of US-China trade tensions has weakened gold's safe-haven appeal, while investors are waiting for US economic data to assess the Fed's policy direction. Gold has been in a range recently as the market now waits for details of the first trade agreement, which is expected to be announced this week or next week.
📊Comment analysis
Gold reached a turning point last week, with Trump making some very positive comments, while stagflation risks continued to be excluded, and gold continued to fall. Stagflation pricing has driven gold prices higher, and as the market begins to exclude this risk, it is normal for a correction to occur, especially considering that "long gold" has become one of the most crowded trades.
💰Strategy Package
Short position:
Actively participate around 3330 points, profit target around 3300 points
⭐️ Note: Labaron hopes that traders can properly manage their funds
- Choose the number of lots that matches your funds
- Profit is 4-7% of the fund account
- Stop loss is 1-3% of the fund account