Don’t be afraid of pullbacks, we can still go long on goldFundamentals:
1. First, pay attention to the dynamics of Trump and the Federal Reserve;
2. Pay attention to whether the geopolitical conflicts escalate, including the situation between India and Pakistan, Russia and Ukraine, and the situation between the United States and Iran.
Technical aspects:
Compared with yesterday, although the bullish momentum is weak, it has not fallen below the support of the 3005-2995 area, and even failed to fall below 3000. In addition, as gold fluctuates and falls, there is a large amount of buying funds entering the market in the short term. In the recent short-term structure, gold has built a very obvious turning point near the 3300 area. Therefore, gold may still rebound to above 3330 before NFP.
Short-term trading strategy:
You can still consider continuing to go long on gold in the 3310-3300 area, TP: 3325-3335
Goldinvesting
Gold is still volatile, buy at 3298-3305 in the US market
📊Comment analysis
Gold prices need economic news to break through the sideways price range of around 3300. Today, continue to wait and see around 3310, waiting for the right time to enter the market in time.
💰Strategy package
Long positions:
💲Actively participate in gold around 3298-3305 points, with a profit target around 3320 points
Short positions:
💲Actively participate in gold around 3320-3330 points, with a profit target around 3303 points
💢Precise sniping, follow the trading strategy = easy money
Risk aversion eases, gold continues to fluctuateSpot gold prices (XAU/USD) fluctuated and fell, approaching the $3,300 mark, continuing the weak trend of the previous trading day.
From the daily chart, gold prices have fallen from their historical highs and are currently approaching the 38.2% Fibonacci retracement level (US$3,300-3,290). The key support level below is concentrated in the $3,265-3,260 range, which is also the previous consolidation range. If it falls below, it will open up the space for a 50% retracement level (US$3,225) or even $3,200.
In terms of technical indicators, the MACD indicator shows signs of a dead cross, and the green kinetic energy column expands moderately, indicating that short-term bears still have the initiative; the RSI indicator is still oscillating near the 50 axis, and has not yet shown extreme oversold, indicating that the downside space may be limited. Once the price rebounds, the initial resistance above is seen at $3,348-3,353.
After the breakthrough, it is expected to re-challenge the $3,400 mark, and even attack $3,425-3,427.
If the US PCE inflation and non-farm data weaken this week, it will further support the re-entry of gold bulls.

Gold is long, bottoming out during the day and rising
We can never predict what will happen at the crossroads of fate, but we can choose whether to give up or move forward with pain and run towards the end of our dreams. Even if there is no medal of victory, dignity and pride will accompany us all the way. Defeating opponents is only the winner of life; defeating yourself is the strong man of destiny!
After the gold gap opened high, it began to fall back quickly to around 3267. After a small rebound in the European session, it continued to retreat. The US session had a sideways correction before, and the US session started a large-scale pull-up, which continued to around 3353 and closed in the form of a small positive line with a long lower lead. After opening during the day, it continued to fall, and the current lowest reached around 3308. At present, the long and short positions are still fluctuating in a large range. The upper key pressure and the upper edge of the range are maintained at around 3370, while the lower edge and support of the large range below are maintained at around 3260. It is very likely that there will be multiple shocks and choices in this range again. At present, the multi-hour line is expected to form a sideways trend. After finishing, the daily line will fight at the short-term moving average position. The short-term moving average is also between the strength of long and short positions. Today's retracement needs further confirmation from the European session. If the European session continues to be weak, it is still necessary to pull back and short before the US session. The short-term support below is maintained near the integer level of 3300. If gold pulls back to 3310 during the day, it can be long first, with a target of 3330-50 and a loss of 3295. If the European session continues to break down, the US session will pull back below 3300 and short, with a target of 3270-60 and a loss of 3308. There will be large fluctuations in the short term, so be cautious about sweeping back and forth between long and short positions!
Today's operation: Gold will pull back to 3310 during the day and go long, with a target of 3330-50 and a loss of 3295.
Hello traders, if you have better ideas and suggestions, welcome to leave a message below, I will be very happy
Interpretation of the short-term operation ideas of shopping4-hour trend will not hit the high point within this 4-hour period, so currently we can focus on the morning high point and yesterday's high point 3348-3353. Currently we can focus on the support near 3316.
First point: After the 4-hour high closed with a small positive column yesterday, a big negative column fell in the morning, indicating that the price will continue to bottom out in the short term. Therefore, we can arrange short orders below yesterday's high point 3353-3348 in the white session, so 3340-44 is the best shorting point.
Second point: Because the price rose to 3336 after yesterday's high of 3302 and only retreated to 3319, the support of 3316-17 still exists. The point we focus on in the Asian and European sessions is when 3316-17 will break.
Third point: In the event of an accident, the price directly pulls back and breaks the high point, then the next short position is 3370-72; I think this probability is small. Then if it breaks 3315-16, we need to find a low position to go long. Then 3300-3288 and 3273 in yesterday's Asian and European sessions are the long positions. We can use small stop losses to bet on long positions.
Strategy:
Short at 3340-44 during the Asian session, defend at 3353, target at 3330-3320, break at 3315 and target at 3300-3290
Short at 3370-72, defend at 3378, target at 3350
After breaking 3315, short at 3300-328-3276 with a small stop loss of 5-6 US dollars, target at 3305-3350-70
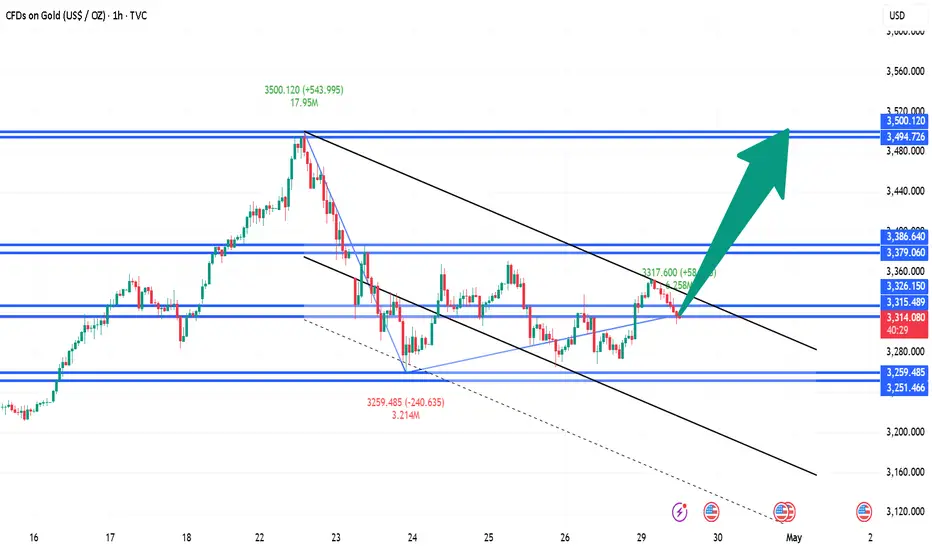
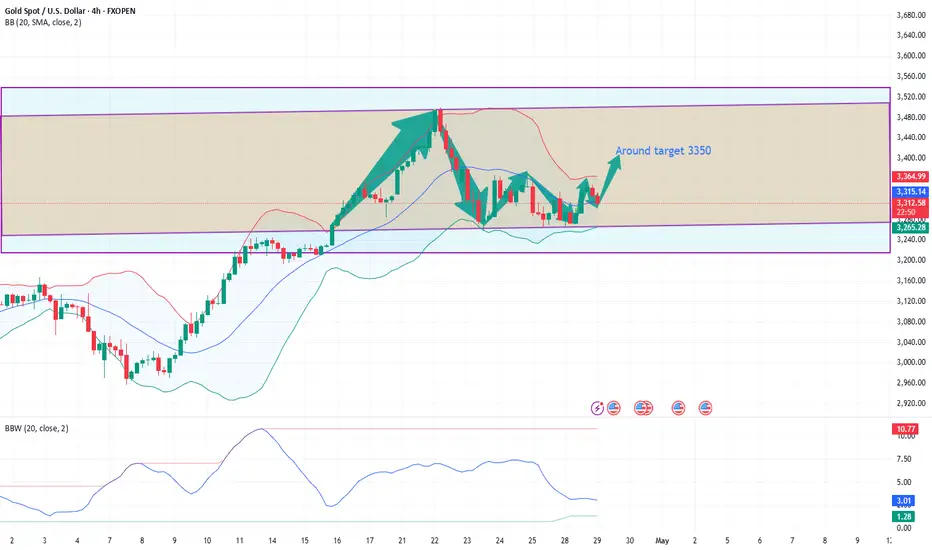
Gold fluctuates within a wide range, and may stop falling as it On Tuesday, gold trading relied on the 3310 support level to directly go long, and the near-point pressure area of 3360/80 was bullish. The long logic of gold as a "safe haven trump card" is beyond doubt. The small cycle adjustment is only the accumulation stage. Once it starts to explode, it will be unstoppable. Recently, when gold touched 3500 again, there was a market view of "suspected top". It is recommended that all investors maintain their composure-the short-term adjustment is insignificant compared to the entire rising cycle. This time, the price retreated from 3500 and corrected by about US$240, which is still within a reasonable range relative to the previous increase. It is emphasized again that it is not recommended for investors to be bearish on gold in the long term, or to subjectively determine that 3500 has become the top. Such psychology is prone to trading deviations and even breeds a dangerous mentality of short orders to bear losses, which is the root cause of long-term losses.
In the early trading of the day, a 3310 long strategy has been deployed, and it is suggested that 3315 can be entered into the long position during the trading session. The current position is in market fluctuations. The current uptrend will first focus on the recovery of the 3340/45 line, and the opening price pressure level should be paid special attention to, especially during the Asian and European sessions. If the Asian and European sessions maintain a shock correction pattern, the support level will continue to be relied on for game play; if the uptrend effectively breaks through 3340/45 and stabilizes, the handover period between the European and American sessions is expected to explode to the 3380 line, or even challenge a higher price range.

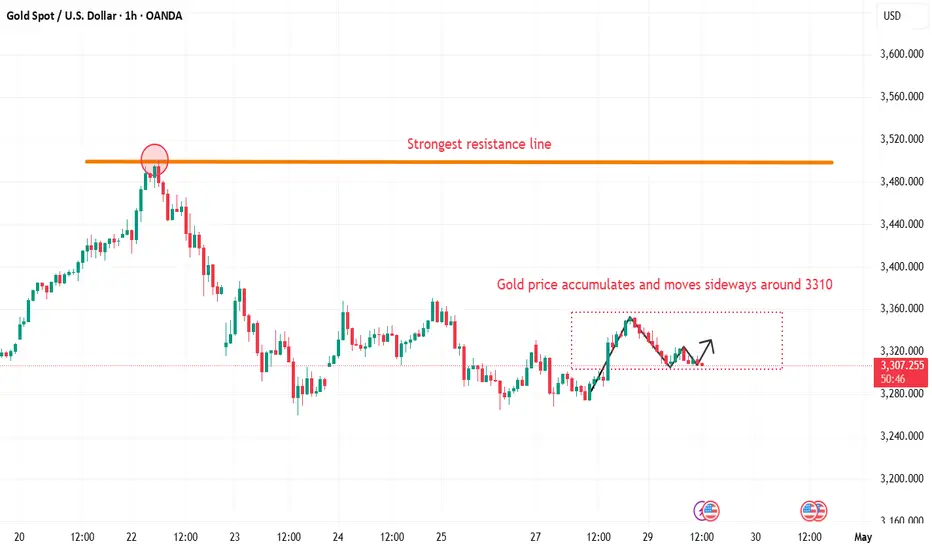
Gold is stuck in the 3300 area, when can it break through?
📊Comment Analysis
Gold prices need economic news to break through the sideways price range around 3300. Today, we will continue to wait and see around 3300, waiting for the right time to enter the market.
💰Strategy Package
Long positions:
💲Actively participate in gold around 3300-3310 points, with a profit target around 3330 points
Short positions:
💲Actively participate in gold around 3330-3340 points, with a profit target around 3310 points
💢Precise sniping, follow the trading strategy = lying down and making money
Be bold and short goldFundamentals:
1. Still need to pay attention to Trump's attitude towards tariffs;
2. Pay attention to whether the situation between India and Pakistan escalates;
3. At the same time, pay attention to the dynamics of the Federal Reserve, US-Iran negotiations, etc.
Trading situation:
Our last short position near 3297 happened to hit TP: 3287 during the decline of gold, and easily made a profit of 100pips in short-term trading;
After gold fell below 3287, it rose sharply in the short term to around 3335. Although gold rose sharply in the short term, it still did not break away from the wide range of fluctuations. There are still many resistances above. First, it faces the short-term resistance area of 3340-3345, and secondly, it faces the resistance area of 3355-3365. Therefore, it is difficult for bulls to perform well before conquering this resistance area. There is still a possibility of testing the 3305-3295 zone again;
Trading strategy:
Short-term trading can still short gold in batches again in the 3325-3335 zone; TP: 3310-3300
No need to hesitate, gold continues to be bullish
I just told you that you can go long near 3298. Gold once retreated to around 3275 during the European session.
I think if you want to go long, there is definitely a chance, and I have been emphasizing this.
I am still in a stable state, and I only suggest going long near 3290 during the US session.
As of now, gold has reached around 3330, which has reached my two target positions.
Since gold can stand at 3330, it will definitely continue to rise in the future.
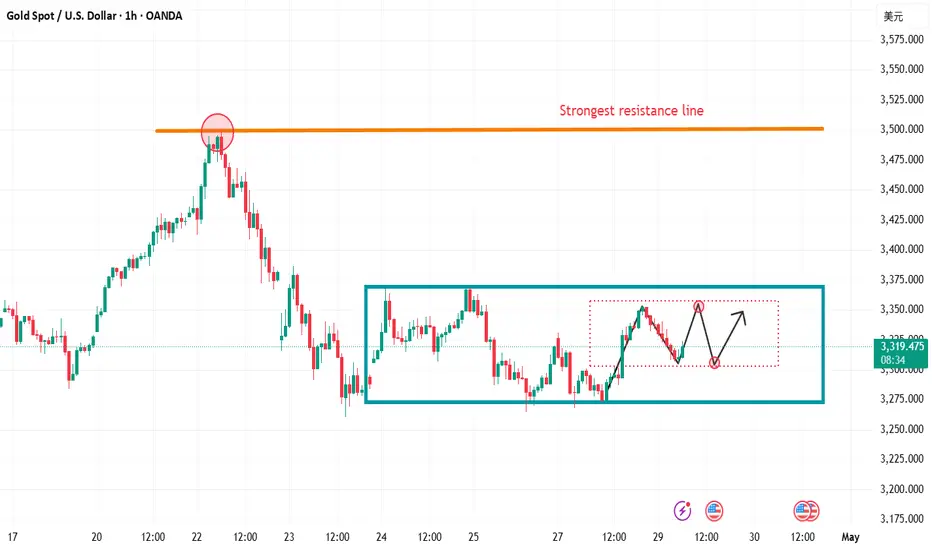
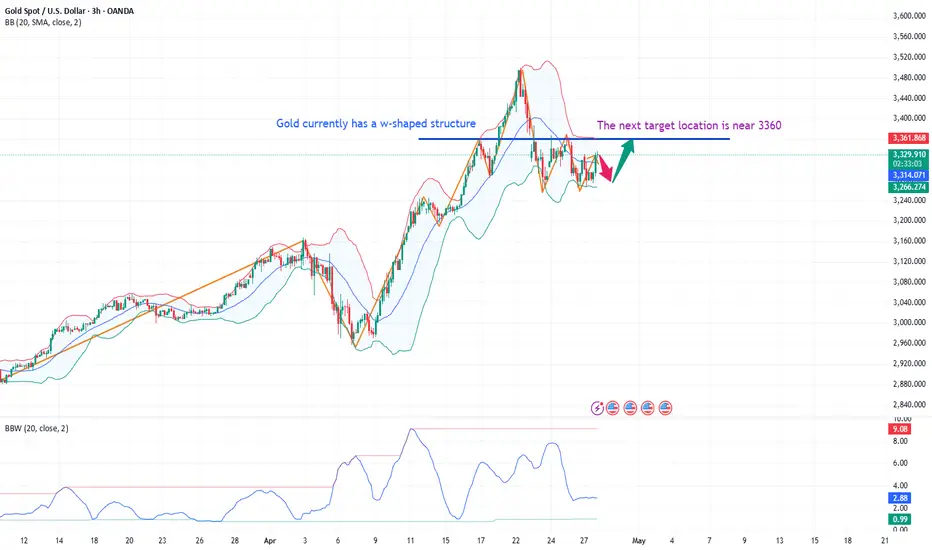
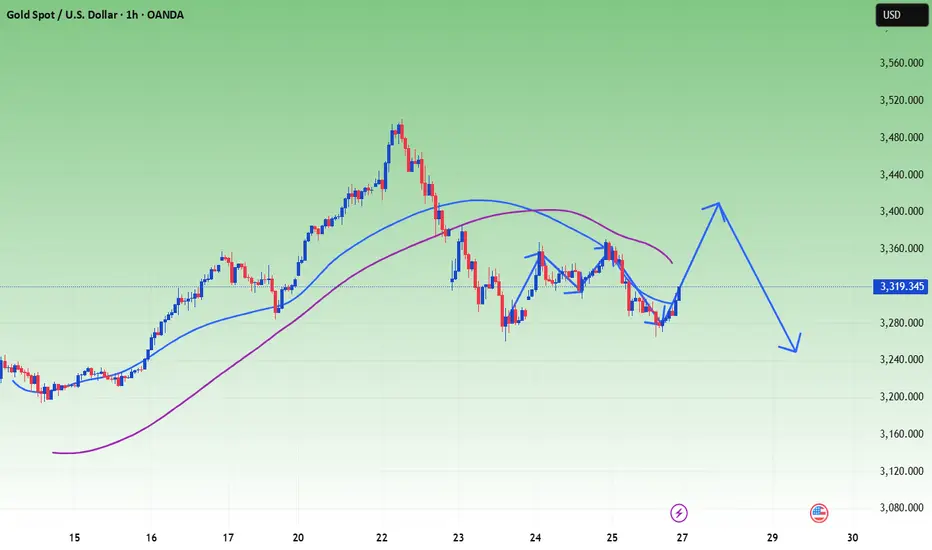
At present, gold is a W-shaped structure, and it will definitely hit the top near 3360 in the future.
So, my suggestion here is still to go long. But maybe gold will not be given a position below 3300.
Therefore, if there is a subsequent retracement of gold, you can focus on entering the market near 3300-3310 and go long. The final target is still around 3360.
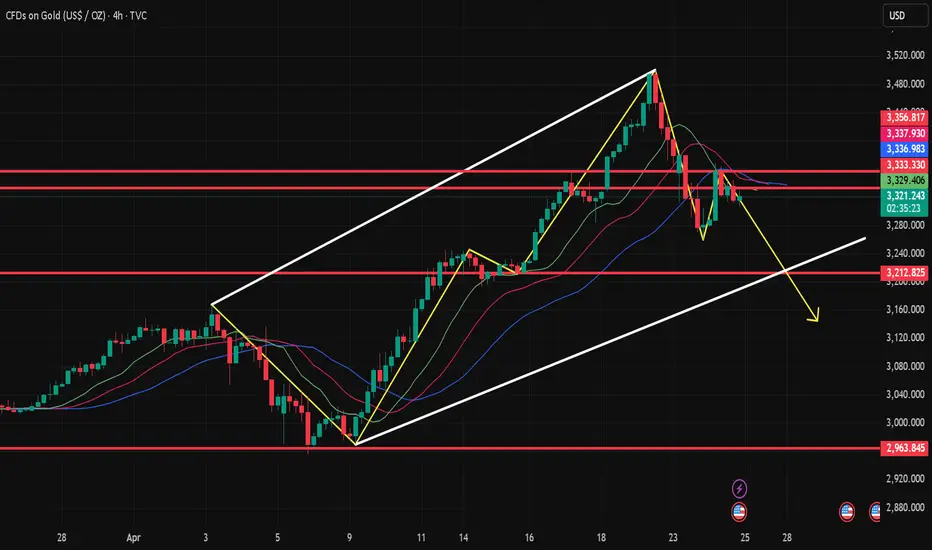
Gold shocks pull the trend towards the bearish side!Gold market trend analysis:
Gold technical analysis: You should have seen the exaggeration of gold, right? Gold has also experienced several major ups and downs in history, but this time is definitely one that can be recorded in the history books. The daily lines in the past few months are very exaggerated, and the rise and fall range is unprecedented. Just today's Asian market, a simple dive is dozens of points. This is the market. The market is always right. We need to respect it the most, rather than blindly look at it subjectively. Surviving in such a big market is the most important thing. Many times, the fluctuation of gold is basically not related to technicality. We try to follow the direct pursuit mode in operation, and we can catch big profits in such a big market. Last week, the weekly line closed with a big tombstone, the weekly line top appeared, and the air force appeared. In May, gold will at least adjust to around 3,000.
The above is the 4-hour pattern, which is repairing below the moving average. If the bulls break 3370 again, there is a possibility of rising again. Otherwise, gold will adjust deeply again. This wave of adjustment is at the weekly level. The daily pattern is also turning into a peaking mode. Note that the rise and fall of gold is not based on technical aspects, but more on fundamentals and big data, as well as the impact of tariffs. Without these influences, we will be bearish this week. If the decline of the big C wave continues, the target will be 3230 (the half point of the entire April rebound) in turn. 3165 is the Fibonacci 61.8 position of the callback and also the previous high point, which is easy to form a rebound. Today's gold focuses on two major suppressions, one is the hourly suppression around 3300, and the other is 3315 and 3328, both of which are opportunities for air forces. On the whole, today's short-term operation strategy for gold is to short on rebounds and to buy on pullbacks. The upper short-term focus is on the 3298-3300 resistance line, and the lower short-term focus is on the 3265-3260 support line. Friends must keep up with the rhythm. It is necessary to control the position and stop loss, set stop loss strictly, and do not resist single operation. The specific points are mainly based on real-time intraday trading. Welcome to experience, exchange real-time market conditions, and follow real-time orders.

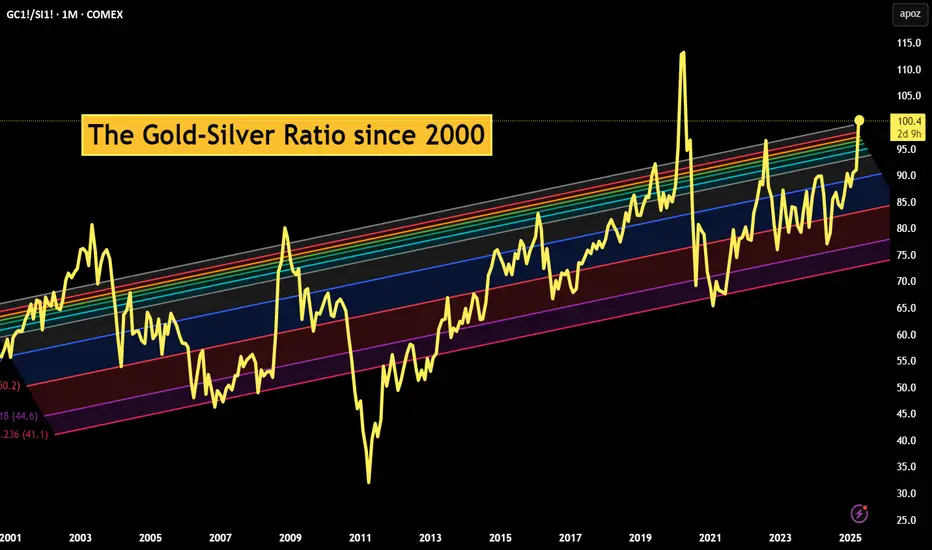
The Gold-Silver Ratio ExplainedCOMEX: Micro Gold Futures ( COMEX_MINI:MGC1! ), Micro Silver Futures ( COMEX_MINI:SIL1! )
The Gold-Silver Ratio is a financial term that measures the relative value of gold to silver. Specifically, how many ounces of silver it takes to buy one ounce of gold.
The Gold-Silver Ratio is an important tool for traders and investors. It has been used to indicate the market sentiment towards these two precious metals. A high ratio suggests that gold is more valued than silver, often seen during economic turmoil or when investors seek safe-haven assets. On the contrary, a lower ratio implies that silver is gaining value relative to gold, which normally occurs during periods of economic growth and strong industrial demand.
The ratio fluctuates over time due to supply and demand dynamics, geopolitical events, and changes in the global economy. By analyzing the ratio, traders can make informed decisions about when to buy or sell. This ratio reflects not only the market’s valuation of these metals but also an instrument for profit-making in the commodities market.
Historical Gold to Silver Ratio
Since 2000, the Gold-Silver Ratio has seen considerable fluctuations, reflecting various economic and market conditions. In the first decade of the 21st century, the ratio hovered around 65:1, meaning it took 65 ounces of silver to buy one ounce of gold.
However, the ratio has spiked during times of economic uncertainty. For example, during the financial crisis of 2008, the ratio reached highs not seen in decades. More recently, in the wake of the COVID-19 pandemic and the ensuing economic turmoil, the ratio surged, at one point exceeding 110:1 in 2020, indicating a strong preference for gold as a safe-haven asset compared to silver.
Over time, the Gold-Silver Ratio has been trending up, meaning gold has gained value at a faster pace compared to silver.
As of last Friday, gold is trading around all-time high at $3,330, while silver is quoted at $33.0. This makes the Gold-Silver Ratio almost exactly at 100.
When to Buy and Sell based on the Gold-Silver Ratio?
The decision to buy or sell the ratio hinges on interpreting its current value in the context of historical trends and market conditions.
When to Buy Silver: A high Gold-Silver Ratio, typically at or above the 90:1 mark, suggests that silver is undervalued relative to gold. This is often interpreted as a buying signal for silver. In such scenarios, silver is cheaper than gold, and investors may see it as an opportunity to purchase silver at a relatively low price. The rationale is that if the ratio decreases, the relative value of silver will increase compared to gold, potentially leading to significant gains.
When to Sell Silver/Buy Gold: Conversely, when the Gold-Silver Ratio is low, say around 50:1, it indicates that silver is relatively expensive, or gold is undervalued. In such situations, investors might consider selling silver and buying gold. The expectation is that the ratio will normalize or increase, meaning that gold’s value could rise relative to silver, offering a favorable return on the gold investment.
The Gold-Silver Ratio can be a valuable indicator of when to buy or sell gold and silver. However, since the ratio is not stable but upward trending over time, we could not use a mean-reversion strategy. The price band for normal, high and low ranges should be updated regularly.
Trade Setup with Micro Gold and Silver
Traders could deploy the Gold-Silver Ratio trading strategy using COMEX Micro Gold Futures ( AMEX:MGC ) and Micro Silver Futures ( AMEX:SIL ). The big advantages of using futures contracts are capital efficiency and leverage.
MGC contracts have a notional value of 10 troy ounces of gold. With Friday settlement price of $3,330.7, each June contract (MGCM5) has a notional value of $33,307. Buying or selling one contract requires an initial margin of $1,500 at the time of writing.
By putting a deposit equivalent to less than 0.5 ounce, traders could gain the full exposure to 10 ounces of gold. If gold prices move up by 5%, a long futures position would double in value (= (33307*0.05) / 1500 = 111%). This futures contract has a built-in leverage of 22:1.
Conversely, Micro Silver (SIL) contracts have a notional value of 1,000 troy ounces of silver. With Friday settlement price of $33.02, each June contract (SILM5) has a notional value of $33,020. Buying or selling one contract requires an initial margin of $3,000 at the time of writing.
By putting a deposit equivalent to 91 ounces, traders could gain the full exposure of 1,000 ounces of silver. If silver prices move up by 5%, a long position in Micro Silver futures would gain 55% (= (33020*0.05) / 3000). This futures contract has a built-in leverage of 11:1.
Micro gold futures (MGC, 10 oz) contracts tap into the deep liquidity of standard-size gold futures contracts (GC, 100 oz). As of last Friday, GC has an open interest (OI) of 447,356 contracts, while the OI for MGC is 44,449, according to data from CME Group.
The OI for standard Silver Futures (SI, 5000 oz) and Micro Silver Futures (SIL, 1000 oz) are 154,276 and 12,345, respectively.
Happy Trading.
Disclaimers
*Trade ideas cited above are for illustration only, as an integral part of a case study to demonstrate the fundamental concepts in risk management under the market scenarios being discussed. They shall not be construed as investment recommendations or advice. Nor are they used to promote any specific products, or services.
CME Real-time Market Data help identify trading set-ups and express my market views. If you have futures in your trading portfolio, you can check out on CME Group data plans available that suit your trading needs tradingview.sweetlogin.com
Gold is expected to rise in the US market
🌐 Driving factors
Geopolitical situation: US President Trump's special envoy Witkov held a three-hour meeting with Russian President Putin in Moscow last Friday to discuss the US plan to end the war in Ukraine. The Kremlin said that the positions of the two sides have become closer.
Iran and the United States said on Saturday that they have agreed to continue nuclear talks in the coming week, but Iranian Foreign Minister Abbas Araqchi was "extremely cautious" about whether the negotiations aimed at resolving the decades-long deadlock can be successful. US President Trump expressed confidence in reaching a new agreement with Iran to prevent the country from developing nuclear bombs.
Latest news: Russian President Putin announced on the 28th that a ceasefire will be implemented from 0:00 on May 8 to 0:00 on May 11.
Bullish sentiment in the market cools down
📊Comment analysis
After the Asian session gold gapped up and opened, it began to fall back quickly to around 3267. After a small rebound in the European session, it continued to retreat. It is currently maintained near 3290. It may continue to fall in the short term, and the support below is maintained near the previous low of 3265-3260 US dollars. This position will also determine the trend of the long and short positions in the later period. It is very likely to retreat again near this position in the evening and continue to make directional choices in the later period. Once the support is effective, the US session may usher in a rebound again, and the key suppression area above is maintained near the integer level of 3300. This position is also the high point of the rebound in the European session, and it will also be the key suppression position of the US session. The operation idea of the US session is very simple. Continue to maintain a certain fluctuation in this range. Once it breaks through, consider stopping loss and exiting.
🔷Technical side:
For the current gold, the 4-hour chart is fluctuating widely between 3330-3270, and is currently near $3295.
✔Operational suggestions, keep short-term trading:
US gold operation strategy:
If you try to go long at 3265-60 first, the target is around 3280-3290, and the loss is 3255. If you first pull back to 3295-00, go short with a light position, and the target is around 3270-3265, and the loss is 3205. In the short term, the long and short positions may continue to pierce, so you need to operate with caution!
💥Risk warning
Liquidity risk: The market may be bearish in early May, and price fluctuations may be amplified.
Policy black swan: Trump may suddenly change tariff policies or personnel changes at the Federal Reserve, causing violent market fluctuations.
Technical false breakthrough: There are a large number of stop-loss orders near $3350, so be wary of reversals after inducing longs.
Summary: This week, the gold market will be affected by geopolitics, the Fed's policies and the trend of the US dollar, and the fluctuation range is expected to be between $3260 and $3350. Investors need to pay close attention to key support and resistance levels and adjust their strategies flexibly.
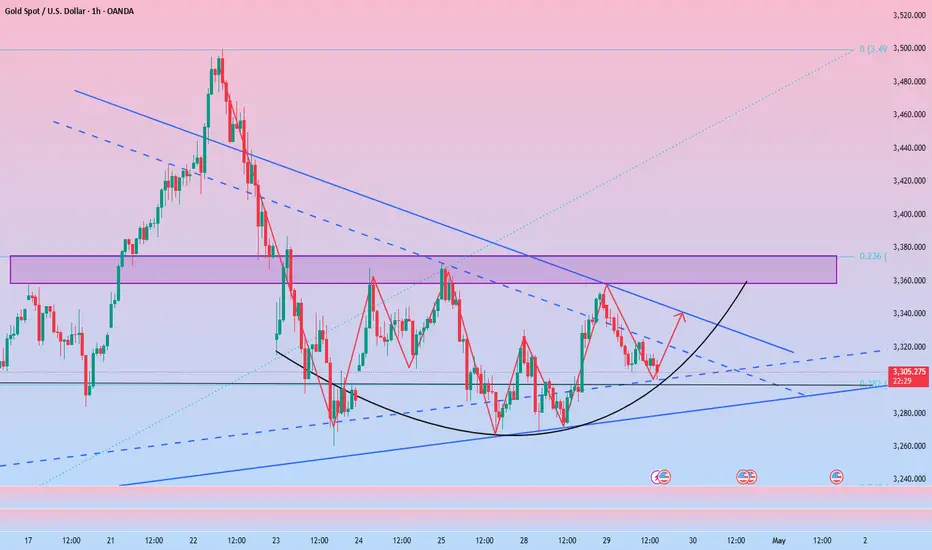
Gold prices fell at the beginning of this week
🌐Drivers
Gold prices fell slightly to $3,310 in early Asian trading on Monday, retreating from the record high set last week as signs of easing global trade tensions grew.
According to Reuters, U.S. Agriculture Secretary Brooke Rollins revealed on Sunday that the Trump administration is in daily consultations with China on tariffs. Rollins also stressed that agreements with several other countries are "very close" to being finalized.
"The news suggesting a possible partial exemption from retaliatory tariffs further boosted market sentiment and caused gold prices to fall below the $3,300 mark," said Tang Yuxuan, a strategist at JPMorgan Private Bank.
📊Commentary Analysis
At the beginning of this week, gold prices were mainly sideways, without much news impact, trading around 3,300 points, and gradually falling back.
🔷Technical side:
For the current gold, the 1-hour chart is fluctuating widely between 3,300-3,270, and is currently at $3,276.
✔Operational suggestions, keep short-term trading:
Bearish strategy:
If the gold price rebounds to the range of 3320-3330 US dollars, you can try to short, with a target of 3280 US dollars and a stop loss of 3335 US dollars.
Bullish strategy:
If the gold price falls to the support of 3260-3270 US dollars, you can go long with a light position, with a target of 3330 US dollars and a stop loss of 3275 US dollars.
💥Risk warning
Liquidity risk: The market may be bearish in early May, and price fluctuations may be amplified.
Policy black swan: Trump may suddenly make tariff policies or personnel changes at the Federal Reserve, causing violent market fluctuations.
Technical false breakthrough: There are a large number of stop-loss orders near 3350 US dollars, and you need to be wary of reversals after inducing more.
Summary:
This week, the gold market will be affected by geopolitics, Federal Reserve policies and the trend of the US dollar. The fluctuation range is expected to be between 3260 and 3350 US dollars. Investors need to pay close attention to key support and resistance levels and adjust their strategies flexibly.
Gold fluctuates at high levels, waiting for adjustmentGold fell back after a cyclic rise in the morning, and the price lost today's starting point. The current position is near the starting point of Friday! If the Asian session cannot bottom out and rebound, then we must be careful of further declines to 3260 in the European session to test around 3230. This position will not be reached soon, but after the loss of the key position, the momentum below will gradually open up, so today the long position is at 3260.
This week's data reference: Wednesday's ADP employment report, Friday's non-agricultural data
Recent fundamental news is complicated, and the fluctuations in the past two weeks are relatively large compared to before. The fluctuations in a single day will basically exceed 100 US dollars, so we must pay attention to strict loss control in operations.
Intraday view: After a short-term retracement, the first pressure level: 3315-17 top and bottom conversion position Strong pressure focus: 3337-43
If it can't reach the support, it's still at 3260. If it breaks down, the US session will look for a position to fall back.
Next week's ups and downs analysis and operation ideasGold closed with a long upper negative line in the weekly chart last week, and retreated to the lowest level of 3260 after being under pressure at the integer level of 3500. So can the decline continue next week?
First, let's look at a few weekend fundamental news: The Federal Reserve's financial report said that global trade wars and policy uncertainties are the biggest risks to financial stability, and have also led to concerns about the value of the US dollar in most countries. Secondly, the Federal Reserve officials made remarks that interest rates may be cut in June, and the geopolitical situation has become unstable, which has also provided some support for the price of gold in the short term.
Technical aspect: The bald positive line closed on Friday's 4-hour and 1-hour lines. If it opens flat at the beginning of the week, it is likely to continue the recent morning cycle recovery rhythm. Note: After the daily level suppressed the decline of 3500, it has been fluctuating in a large range for three consecutive trading days.
The upper and lower edges are relatively clear 3385-3260. According to the recent morning cycle recovery rhythm, the bullish momentum will basically be released before 10 o'clock. Therefore, if the market cannot continue to rise after 10:00 at the beginning of the week, the European session will continue to fluctuate downward. In particular, it cannot break through the upper edge of the daily oscillation cycle before 3385.
Operation: Open flat at the beginning of the week. Short-term support focuses on 3300. Strong support: 3260-70
Pressure level: Gains and losses of key pressure near 3385

Analysis of gold price trend next week!Market news:
Spot gold fell nearly 1% on Friday, closing at 3316. Although the price of gold closed above 3300 this week, the trend of London gold prices this week can be described as ups and downs. Intraday transactions have fluctuated by nearly $100 many times. Under the situation of trade tensions, the market has a high risk aversion sentiment, pushing the international gold price above 3500. The easing of global tensions, especially between the United States and China or in Eastern Europe, may significantly reduce the demand for safe havens. Although this is not the base case in 2025, it is still an unexpected risk that traders must consider. In fact, after US President Trump hinted that tariffs on my country may be reduced! The positive risk tone weakened the demand for safe-haven assets. In addition, optimistic US macroeconomic data on Thursday supported the US dollar, which also hit gold prices. Next week, the gold market will welcome the release of the World Gold Council's first quarter "Gold Demand Trends" report. In addition, Trump's 100th day rally on Tuesday may become an important window for gold prices to choose to test the 3,500 mark again or continue to fall from 3,300. In the short term, gold prices may face technical corrections and profit-taking pressures, and the $3,260-3,300 area will be the key battlefield for long and short tug-of-war.
Technical Review:
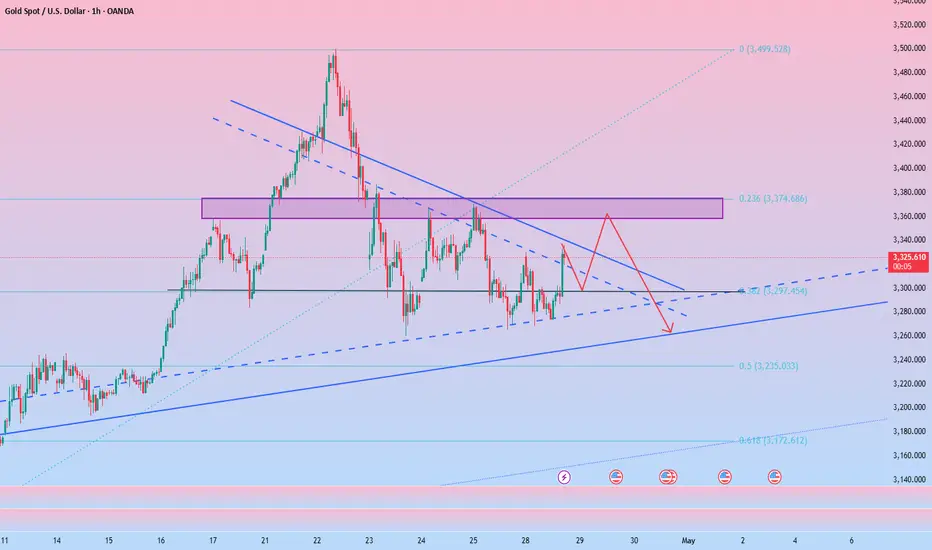
From the perspective of market sentiment, interest-free gold as a safe-haven asset has performed strongly this year, and its price has soared by nearly $700 and refreshed its historical high several times. However, the recent optimistic expectations of easing global economic and trade relations have boosted market risk appetite, and the equity market has generally performed positively. Some funds have flowed out of safe-haven assets such as gold and turned to risky assets, which is also the main psychological factor under pressure on gold prices. If the market risk appetite continues to improve, global economic and trade relations further ease, and the US dollar strengthens, gold prices may face greater downward pressure and will first test the $3,260 support. If it fails, it may drop to $3,225 or even challenge the $3,200 integer mark. In addition, if the US economic data performs strongly, the market's expectations for the Fed's interest rate cut may further cool, which will also put pressure on gold prices. From the performance of the daily chart, the recent trend of gold prices has shown a high consolidation trend, and there has been a significant correction from the high point near $3,500. After hitting the low point of the week, gold prices rebounded to a certain extent, but the rebound strength was blocked near the 23.6% Fibonacci retracement level (about $3,368-3,370), which has now become an important short-term resistance. The weekly gold line is also a shooting star with a long upper shadow line at a high level. If gold does not have the support of big bullish news in the short term, then gold will still be under pressure at a high level in the short term, and the daily line is also down from a high level without a strong counterattack. Overall, there is still room for adjustment in the short term for gold.
Analysis for next week:
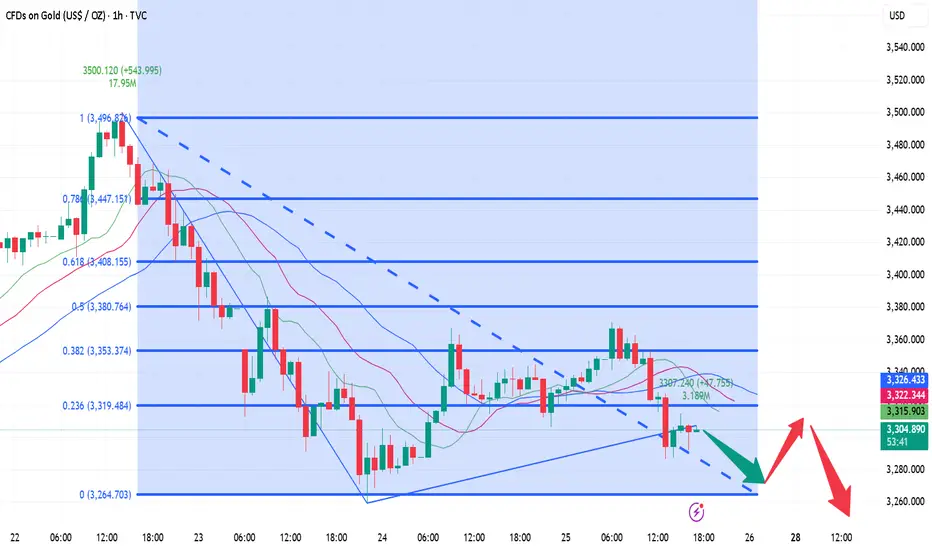
In view of the important trend of gold prices breaking through key points, the subsequent market will most likely continue to sell. From the current market structure, the position of $3260 has become the focus of the market. Investors need to pay close attention to whether the gold price can reach or even fall below this point. Once it effectively falls below, the selling trend will be further strengthened, and the market may usher in a deeper adjustment. The gold 1-hour moving average continues to sell, but after gold bottomed out near the first-line support of 3265, gold rebounded by more than 50 US dollars. Is this rebound a reversal? Not necessarily, because now it basically fluctuates by about 100 US dollars every day, and it is difficult to say that a rebound of 50 US dollars is a reversal. The strength of next week is the key. If the rebound of gold next week is not very strong, then gold will still fluctuate and sell. The resistance of the gold 1-hour moving average is near 3354, and the top of the gold negative line on Friday is near 3352. If there is no effective breakthrough of these two positions next week, it will still fluctuate and sell.
Operation ideas:
Buy short-term gold at 3275-3278, stop loss at 3267, target at 3310-3330;
Sell short-term gold at 3363-3366, stop loss at 3375, target at 3300-3310;
Key points:
First support level: 3300, second support level: 3285, third support level: 3260
First resistance level: 3327, second resistance level: 3343, third resistance level: 3366
Interpretation of ideas after gold opensTechnical pattern: This week, gold closed in a "shooting star" pattern, which is a common peak signal, indicating that the price of gold may face a correction or decline.
Influence of news: This week, affected by Trump's tariffs and dismissal of Powell, gold first hit a record high of 3500 due to its safe-haven properties. Then Trump's remarks changed, and the price of gold plunged from the high point to around 3260. Overall, it ended in a volatile situation under the uncertainty of tariffs, Powell's stay and interest rate cuts. If there are no new safe-haven factors in the market news, there is room for further decline in the price of gold.
Short-term trend analysis
Four-hour level: After the safe-haven, the price of gold rebounded at the low point of 3260, but was unable to continue near 3370. It is believed that the high-level selling repair and low-level buying intervention have affected it. The opening of the gold price next week may continue to fall.
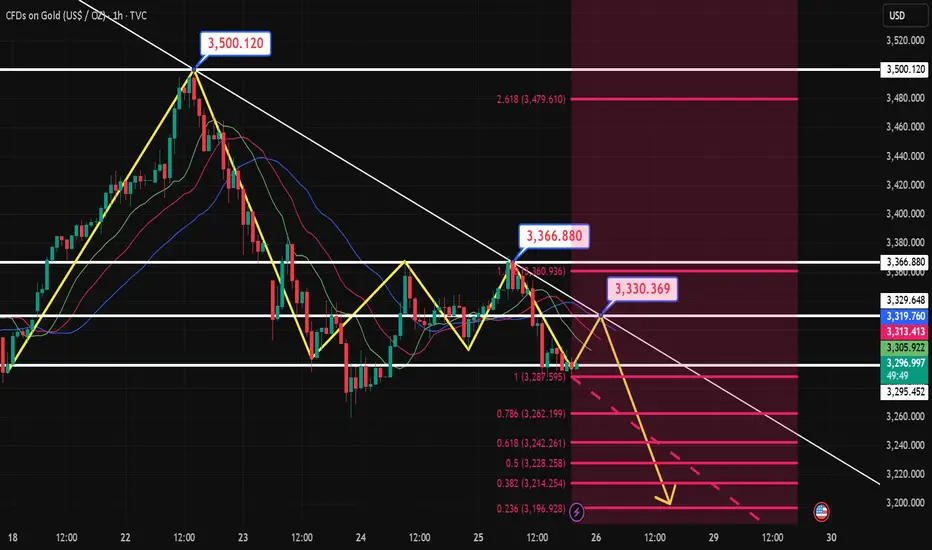
Hourly level: Since the decline in the price of gold, the rebound strength has been insufficient. It rebounded twice near 3260 below, and the overall center of gravity was downward before crossing 3380. Next week, pay attention to the 3330-3346 range to determine the nature of the rebound at the end of this week. At the same time, pay attention to whether 3260 can be broken. If there is a break, you can look down to 3221.
Operational suggestions: Overall, the overall idea for next week will continue to be bearish. Pay attention to the resistance of the 3330-3346 range on the top, and try to go short if it is touched; the initial support below is 3260, and the bearish trend can continue to 3221-3219 if it breaks.
Suggestions for being stuck at high positions: For investors who are standing guard at high positions, if they can withstand the pullback of gold prices, they can continue to hold and wait for the return of their capital; if not, it is recommended to recognize the loss and leave the market first, and then enter the market after the gold price has adjusted to the right level.
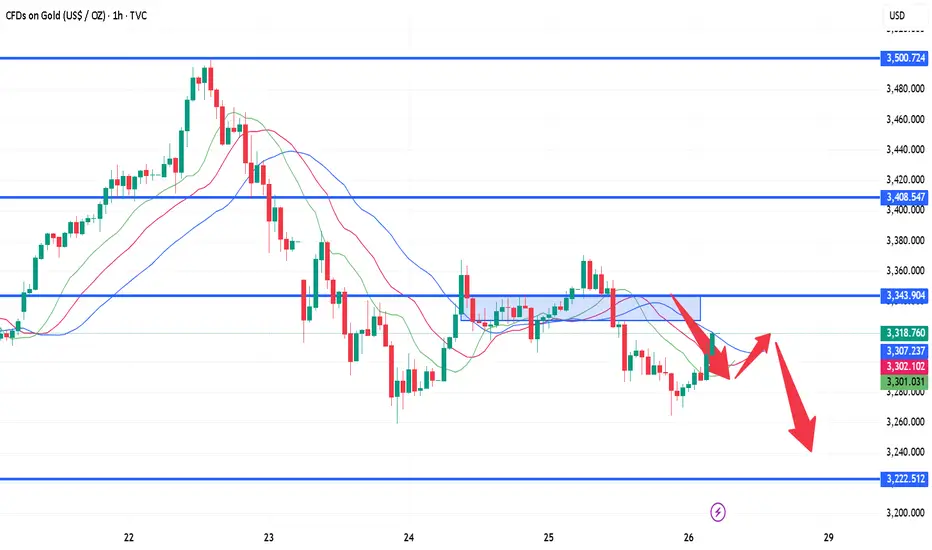
The gold weekly line is about to close and the short position coThe downward trend remains unchanged!
At the same time, after the current decline in gold, traders who have positions above should pay attention that the early morning rebound cannot exceed the stage pressure of 3292-3300. The larger the rebound, the weaker the downward momentum. After a continuous decline, the 3260 position can be seen below. After breaking, the 3230 point needs to be paid special attention to below. This is the golden section position of 50% retracement since the rise from 2956 to 3500 in this round. It is also a multiple resonance area in the trading concentration area. After reaching this point, traders who hold short positions should consider being more cautious.

4.25 gold short-term operation technical analysis!Spot gold suddenly fell sharply during the Asian session on Friday (April 25). At the end of the session, the current gold price was around $3,307/ounce, a plunge of more than $40 during the day.
Gold prices turned lower on Friday as hopes of a trade deal between China and the United States weakened safe-haven assets. The positive risk tone weakened the demand for safe-haven assets. In addition, optimistic US macroeconomic data on Thursday supported the dollar, which also hit gold prices.
Cleveland Fed President Hammack made it clear in an interview on Thursday that the Federal Reserve has basically ruled out the possibility of a rate cut in May. But she also released key information that if there is clear evidence of the direction of the economy, there is room for policy action in June.
Gold prices are currently supported near the $3,300/ounce mark, which is also the 38.2% Fibonacci retracement level of gold prices from this month's low (around $2,950/ounce) The latest round of gains is located.
If gold price falls below the $3300/oz mark, the next support for gold price is the weekly low near the $3260/oz area; if it falls below the above area, gold price may accelerate its decline and fall to the 50% retracement level (i.e. the area near $3225/oz) and finally fall to the $3200/oz mark. Some follow-up selling will indicate that gold has peaked and turn the short-term bias in favor of bearish traders.
Gold price resistance is around the $3368-3370/oz area, which should be a key level now. If it breaks through the above area, gold price may return to the $3400/oz mark. The subsequent rise may push gold price further to the $3425-3427/oz barrier. Once this barrier is overcome, bulls may retry to conquer the psychological $3500/oz mark.
Interpretation of 4.25 Gold Short-term Operation IdeasFrom the technical analysis of the hourly market, yesterday's low was at $3,306, and the rebound just now showed an obvious stop signal at this position. Based on this, the current short-term suppression level can refer to $3,315, and the higher level is $3,328. For short-term investors, you can consider waiting for the gold price to rebound to around $3,315 to arrange short orders and continue to be bearish on the gold price. The first thing to pay attention to below is the support of the low point just touched at $3,287. If this support level is lost, the next key support level will be $3,260, the first low point on the previous downward journey. If $3,260 is also effectively broken, the short-selling force will be further released, and the gold price may face a larger decline.
Confrontation between India and Pakistan pushes for risk aversioYesterday, the gold market opened at 3291.1 in the morning and then the market rose directly. The daily line reached a high of 3367.7 and then fell under pressure. The daily line finally closed at around 3345, and the daily line closed with a long upper shadow line. After this pattern ended, the short positions at 3496, 3468 and 3442 this week were reduced and the stop loss was followed up at 3400.
SELL: 3340 Stop loss: 58
TP1: 3330
TP2: 3320
TP3: 3305
BUY: 3300 Stop loss: 3295-92
TP1: 3320
TP2: 3335
TP3: 3360
We will update regularly every day to introduce how we manage active thinking and settings. Thank you for your likes, comments and attention. Thank you very much

Gold fluctuates in the short term, but you can still make a prof
Gold is still fluctuating. Due to the pressure from the upper moving average, don't chase high for the time being. Wait for gold to pull back and you can still continue to short.
During the US trading time today, short-term gold bulls have begun to be powerless, so when gold pulls back to around 3350, shorts can enter the market at any time, and gold still has the opportunity to adjust. Gold continues to wait and see the adjustment market in the short term, and pay attention to trading signals in time.
Keep an eye on the price and participate well. Grasp the rhythm of gold pullback short-selling transactions. You will find that this kind of fluctuation is much more fun than the big fluctuation.
📊Comment analysis
Gold is currently just a rebound. If there is no special risk-averse news for gold, it will still be difficult to go up directly. At least it will fluctuate first, and it is still a bearish fluctuation now.
💰Strategy Package
Short position:
Actively participate at 3350 points, profit target is around 3310 points
⭐️ Note: Labaron hopes that traders can properly manage their funds
- Choose the number of lots that matches your funds
- Profit is 4-7% of the capital account
- Stop loss is 1-3% of the capital account

Interpretation of gold short-term operation ideasAfter a surge in the morning, gold was suppressed and fell again in the afternoon and has been in a narrow range of fluctuations!
Evening operation ideas:
If the European session does not continue the Asian session's pull-up and continue to strengthen, the probability of evening fluctuations will increase. After a sharp pullback, it is not easy for gold to turn strong in the short term, so before yesterday's opening is broken, the possibility of continued pullback will increase!
Short-term suppression of the US market: 3330-35, look at a high and then fall
Support below: 3310-3300-3293
Data reference: The Federal Reserve will release the Beige Book of brokerage conditions at 2 a.m.
Trump will sign an executive order at 5 a.m.