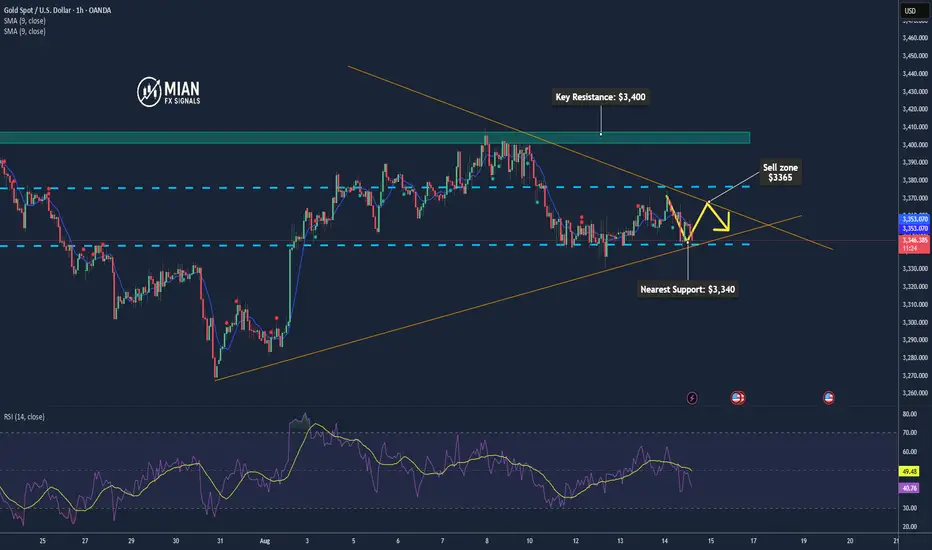
XAUSUD: A large-scale buying opportunityGood morning, traders. Yesterday, I mentioned that the XAUUSD will initially decline after the Asian market opens. Our trading strategy of selling first and then buying has been effective and has shown some promising results. Gold prices hit a low of 3323 after the Asian session opened, a drop of approximately $12 per ounce. It then rebounded and is now trading at 3354. Long positions are continuing to profit. We await the target price of 3365. A new week, a new beginning. With the London session about to open, we'll have to wait and see whether it will push the XAUUSD to new heights.
Goldinvesting
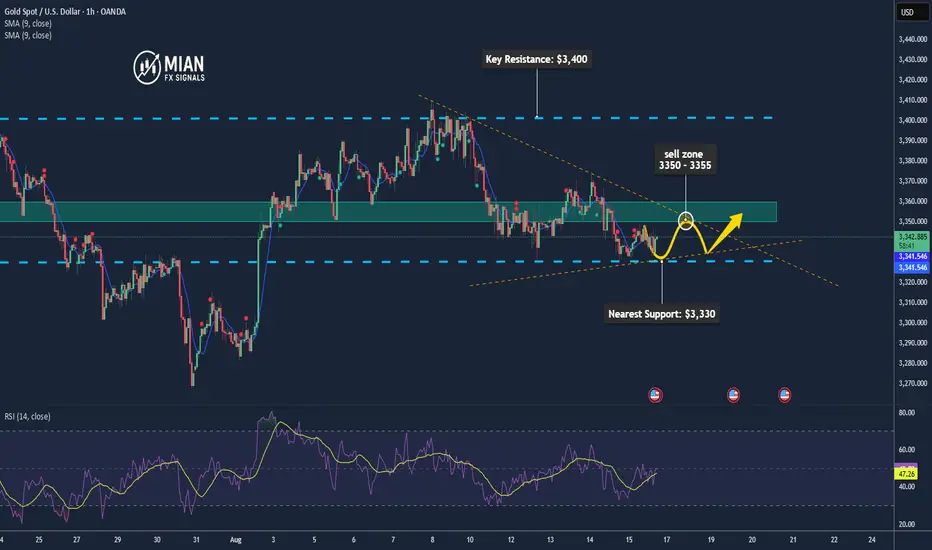
Gold May Correct Amid U.S. Inflation Concerns📊 Market Overview
• Spot gold edged up slightly as the U.S. dollar weakened, but is still heading for a ~1.5% weekly drop as strong U.S. inflation data reduced expectations for significant Fed rate cuts.
• Earlier this week, softer-than-expected U.S. CPI data (up 0.2% in July) briefly lifted gold prices to $3,351.46/oz.
📉 Technical Analysis
• Key Resistance: ~$3,350–3,360/oz
• Nearest Support: ~$3,330–3,340/oz
• EMA 09:
If price is above EMA09 → short-term trend is bullish.
If price is below EMA09 → trend is bearish
• Candlestick / Volume / Momentum:
Price action is consolidating in a narrow range, showing a cautious market tone.
No significant breakout signals from volume yet.
📌 Outlook
Gold may rise slightly in the short term if the U.S. dollar continues to weaken and inflation data remains soft. However, if incoming data reinforces the view of fewer rate cuts (e.g., higher PPI, lower jobless claims), gold could correct lower.
💡 Suggested Trade Strategy
SELL XAU/USD: $3,350–3,355
🎯 TP: ~$3,330–3,340
❌ SL: ~$3,360
BUY XAU/USD: $3,330–3,335
🎯 TP: ~$3,350–3,360
❌ SL: ~$3,320
Swing Trading OutlookThe market trend was flat over the weekend.
The prices of Bitcoin and Ethereum rose slightly before retreating slightly. There aren't any major market fluctuations.
We're still looking forward to next week's trends. Bitcoin is still in its bottoming phase. Periodic buying is a good option. The foreign exchange and futures markets will open in Asia on Monday. I'll be focusing on Wednesday's Federal Reserve interest rate decision. This is a key data point that will determine whether the US dollar rises or falls. It also serves as an important data point for our trading products.
My approach is to continue to sell at high levels before the interest rate decision. Then, monitor market sentiment. I'll focus on GOLD/XAUUSD, the two most impactful products. Secondly, the foreign exchange market. So, the strategy is: sell first, then buy next week. The subsequent buying will be determined based on the direction after the interest rate decision.
I hope everyone enjoyed this holiday. Maintain an optimistic and positive attitude when trading at all times. Once your mindset is affected, many things will be difficult to do, not just trading. Dear traders, see you next week.
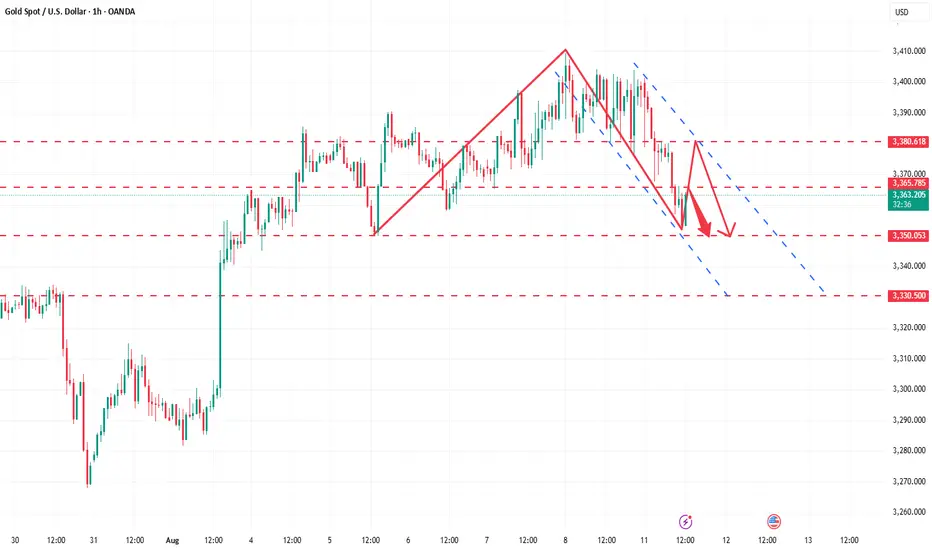
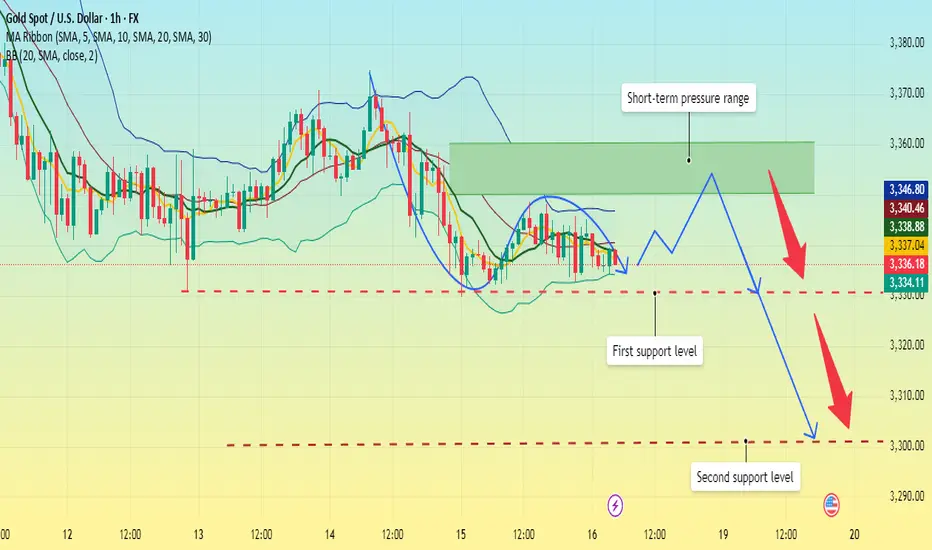
Next Week's Analysis: Will the Price Continue to Fall?Gold has been trending downward throughout this week. While it has generally remained within a broad range, with minor rebounds at lows, there's still a chance it will continue its decline and find strong support. The current strong support level is 3330, and the second support level is around 3300. The upper pressure is maintained at 3350-3360. After touching this position on Friday, it was under pressure again.
From the 1-hour chart, the moving averages are currently crossing downward, and this trend is likely to continue. After hitting a high near 3375 on Thursday, the price has been fluctuating downward, trading mostly below the middle Bollinger Band. Although it rebounded slightly after hitting a low at 3329, it failed to break through the resistance level of 3350, and after coming under pressure there, it has continued its downward trend. Overall, gold bears still have momentum, and there are currently no signs of a reversal.
Therefore, we can continue our bearish trend position at the beginning of next week.
The Asian gold market is about to open. Good luck to all traders.
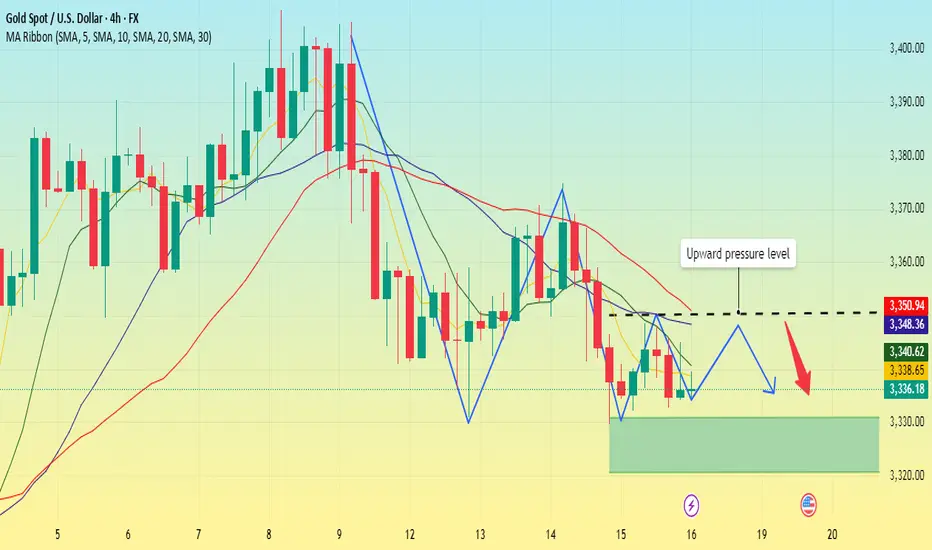
Gold's weakness is likely to continue next week.Gold fell immediately after the Asian market opened on Monday, dropping 64 points. After a minor mid-term pullback, it continued its decline, hitting a low near 3329 before stabilizing. It rebounded slightly on Friday, fluctuating slightly before weakening near the close. Meanwhile, it is under pressure below its short- and medium-term moving averages, a pattern that signals a continued decline.
At present, although the price remains in a large range of fluctuations, it is still expected to continue to decline in search of support, and the primary support below is maintained at 3300. This position is also the key point for a band-like rebound in the later period, and it is also the position that may be touched next week. The upper pressure continues to remain around 3350, which is also the previous top and bottom conversion position. If the market is still in a bearish trend next week, the rebound will most likely not break through this position.
On the whole, if gold rebounds first in the early Asian session next week, the main strategy is to short it when it touches around 3345, with the profit range around 3330-3320; if the European session continues to be weak, then the US session will continue to rebound and short it.
A happy weekend has begun. I wish you all a happy weekend.
Profitable 10-Minute Selling of GoldBased on the analysis in the previous article regarding the decline in gold prices, investors who followed the sell trend certainly made some profit. The drop was approximately $10 per ounce, and since it's Friday, this profit is quite positive. Market volatility is expected to be minimal as the market nears its closing. If you're serious about trading, consider buying at a low price.
Gold pulls back, should we go long or short?Gold Market Analysis:
Unfortunately, the inverted hammer pattern emerged, and the price continued testing the recent low around 3330.
Although it held, the bearish engulfing pattern suggests that the bullish momentum has yet to recover.
The price correction from the past two days is gradually turning into a consolidation phase.
Notably, after breaking higher the day before yesterday, yesterday’s price action reversed sharply, breaking below the previous day’s low and extinguishing the bullish momentum.
Key Observations:
1. The day before yesterday saw an upward move, with the morning low acting as the dividing line. For the uptrend to continue, the price should not fall below the previous day’s starting point. However, yesterday’s break below that low confirmed the end of the bullish trend.
2. After breaking the low, watch for a potential secondary decline on any rebound.
3. In the afternoon, the downtrend continued, testing the previous low of 3330. In a downtrend, we avoid betting on a double bottom.
Today’s Situation:
The hourly chart shows a brief rebound with consecutive bullish candles, but after testing 3350, the price faced resistance and pulled back. Currently, it is consolidating around 3340.
Short-Term Outlook:
- Resistance Levels: 3357–3363
- Support Level: 3330 (A break below this level would signal a continuation of the downtrend).
Thank you all for your likes, comments and follows, we really appreciate it!
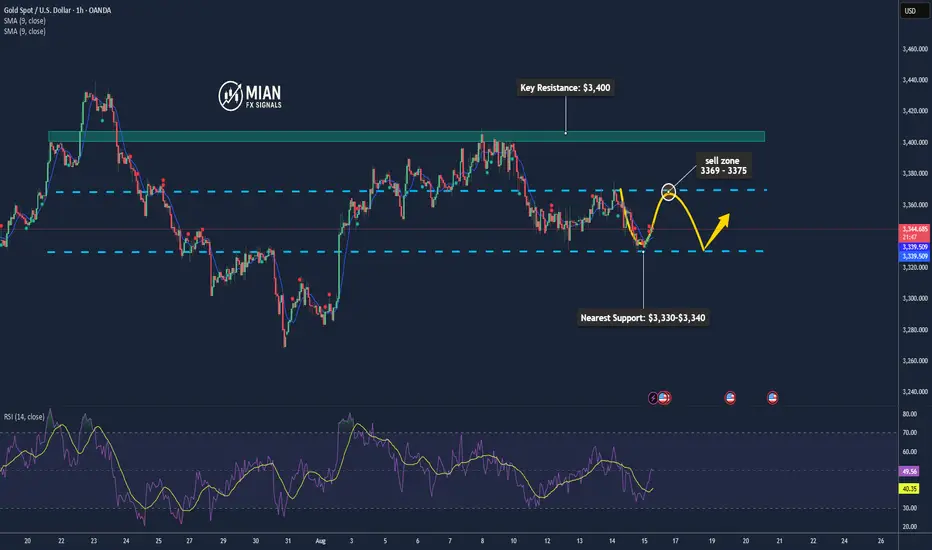
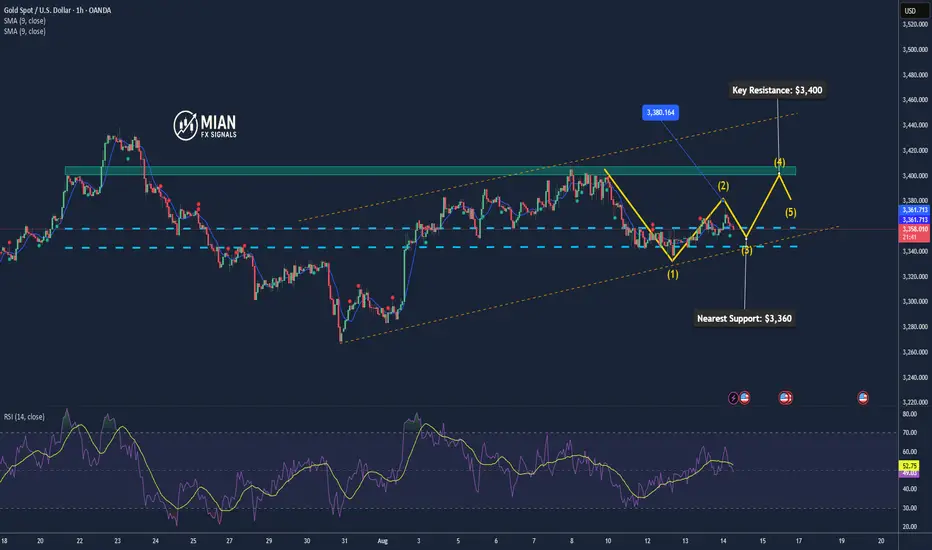
Gold Likely to Retrace Short-Term – Hot PPI Caps Gains📊 Market Overview:
Gold is facing mild downward pressure after July’s US PPI rose 3.3% YoY, stronger than expected, reducing optimism for an aggressive 50 bps Fed rate cut next meeting. Safe-haven demand remains supported by geopolitical risks ahead of the Trump–Putin meeting, but Fed caution is capping further upside.
📉 Technical Analysis:
• Key Resistance: ~$3,370 (near-term), ~$3,400 (major)
• Nearest Support: ~$3,345 (near-term), ~$3,330–$3,340 (major)
• EMA 09: Price is currently below EMA 09, indicating a mild short-term bearish bias.
• Candlestick / Volume / Momentum: Current structure shows a mild retracement with steady volume; momentum softens as hot inflation data limits upside potential.
📌 Outlook:
Gold may continue easing in the short term if US economic data remains strong. A rebound above resistance could occur if rate-cut expectations revive or geopolitical tensions escalate.
________________________________________
💡 Trade Strategy Suggestion:
🔻 SELL XAU/USD: $3,369–$3,372
🎯 TP: 40/80/200 pips
❌ SL: ~$3,375
🔺 BUY XAU/USD : $3,330–$3,333
🎯 TP: 40/80/200 pips
❌ SL: ~$3,327
Grasp the market rhythm and improve trading success rateAfter a sharp drop on Monday, gold prices saw a volatile rise on Tuesday and Wednesday, closing with small bullish candles. The rebounds on these two days were relatively limited, so for now, we can define them as a correction after a sharp drop. This correction isn't a trend reversal, but rather a brief respite after a sharp decline, reflecting a temporary balance of power between bulls and bears. The 5-day moving average is trending downward, indicating continued downward pressure on gold in the short term. Meanwhile, the 10-day moving average remains upward, suggesting that the previous upward trend in the medium term has not been fully broken. The death cross formed between the two is a key signal, signaling a divergence between short-term and medium-term trends, and increasing market uncertainty. The current moving average system is somewhat disorganized, lacking a clear alignment. In the short term, we should continue to monitor volatility, focusing on shifts in bullish and bearish forces during this period. For today's market, we should prioritize a rebound in gold. On the upside, focus on resistance near 3375-3385, marking the 0.618 golden ratio level during gold's decline from 3409 to 3331. On the downside, focus on support near 3330-3320.
Trading strategy: We recommend buying gold on a pullback near 3335-3320, with the target at 3350-3360-3370.
Gold is weak. Continue to decline?Last week, gold prices fluctuated upward, but Monday's sharp drop wiped out all the gains, sparking market concerns about further downside. Subsequently, Tuesday and Wednesday saw a fluctuating rise, with small gains closing in on the day. The rebound was relatively limited, failing to form a valid reversal signal, and can be seen as a correction of Monday's decline. Thursday's breakout and subsequent decline became a key turning point, with the daily candlestick chart directly swallowing up the gains from Tuesday and Wednesday. In technical analysis, this pattern often signals the end of the previous rebound and the re-establishment of market control by bears.
In terms of indicators, the 5-day moving average is extending downward, signaling a short-term downward trend and a suppressive effect on prices. Meanwhile, the 10-day moving average is also showing signs of downward movement, suggesting a gradual divergence in the medium-term trend toward the bears, with the moving average system showing a bearish alignment.
On the final trading day of this week, upward pressure will focus on the 3350 level, followed by the 3360 level, the high point where Thursday's European session rebound was stalled and the decline continued. Focus on support around 3320-3310 below.
Trading strategy:
Short around 3355, stop loss at 3365, profit range 3330-3320-3300
Long around 3315, stop loss at 3300, profit range 3330-3350.
Gold Holds Around $3,350 After Volatile Swings📊 Market Overview:
Gold is currently steady around $3,350/oz after intraday moves between $3,341 and $3,375, according to Investing.com. Reuters reports spot gold near $3,357.65/oz, supported by expectations of Fed rate cuts and a softer USD.
📉 Technical Analysis:
• Key Resistance: $3,400
• Nearest Support: $3,341 – $3,342
• EMA 09: Price is hovering near the 9-day EMA, showing a short-term neutral bias.
• Candlestick / Volume / Momentum: Small-bodied candles with long wicks indicate market indecision, awaiting clear macroeconomic cues.
📌 Outlook:
Gold may range sideways around $3,350 in the short term unless new economic data triggers strong movement. A weaker dollar or stronger rate-cut expectations could lift prices toward $3,360–$3,400, while renewed USD strength may pressure gold down to $3,340 or lower.
💡 Suggested Trading Strategy:
SELL XAU/USD: $3,362 – $3,365
🎯 TP: 40/80/200 pips
❌ SL: $3,368
BUY XAU/USD: $3,340 – $3,343
🎯 TP: $3,360
❌ SL: $3,337
Be cautious when trading. Will data trigger a market ripple?Information Summary:
Currently, most gold traders are awaiting US Producer Price Index (PPI) and Initial Jobless Claims data for renewed trading incentives. US Treasury Secretary Bensont issued his clearest call yet for the Federal Reserve to begin a cycle of rate cuts, stating that the Fed's benchmark rate should be at least 1.5 percentage points lower than it is now.
According to the Fed Interest Rate Watch Tool, market expectations for a rate cut at the Fed's September 17 meeting continue to rise, with traders betting on a 25 basis point probability of a cut to 99%, a significant increase from 91.4% the previous day.
Meanwhile, the probability of a 50 basis point rate cut in September has also risen to 1.4%, from almost zero previously.
Market Analysis:
The relative strength index remains above its midline, favoring a bullish outlook for gold on the daily chart.
Quaid believes that gold prices need to break through the static resistance level near 3380 to unlock additional upside potential and launch an attack on the 3400 round-figure mark. The 5-day and 10-day moving averages formed a death cross, indicating a directionless market movement, suggesting that pending the release of the data, the market will maintain minimal volatility, awaiting a new trend. The current resistance level of 3380-3390 will be tested.
On the downside, the 50-day moving average (SMA) currently around 3350 provides short-term support. A break below this level would prompt sellers to target the 100-day moving average around 3302.
Quid believes that if the US data is mild, the market reaction is likely to be limited, as traders turn their attention to Friday's meeting between US President Trump and Russian President Putin in Alaska on the Ukraine peace agreement.
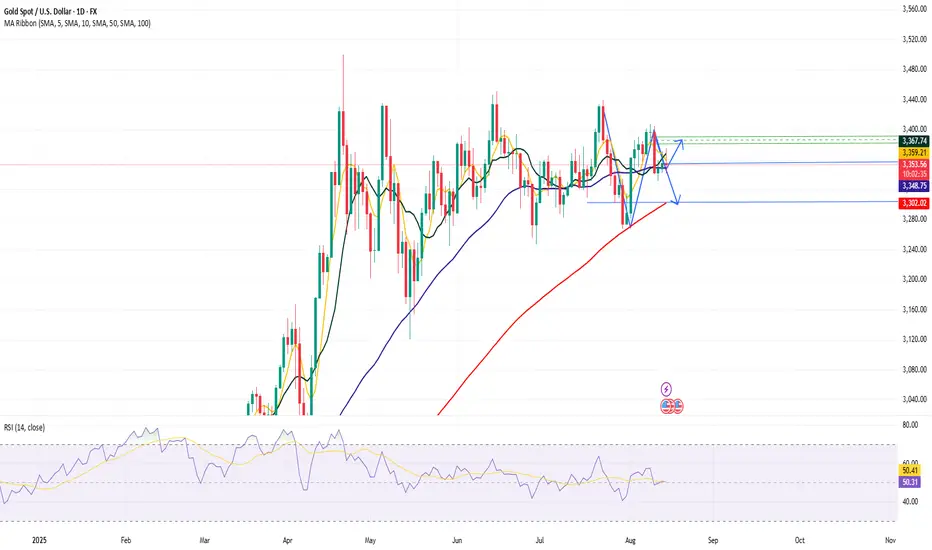
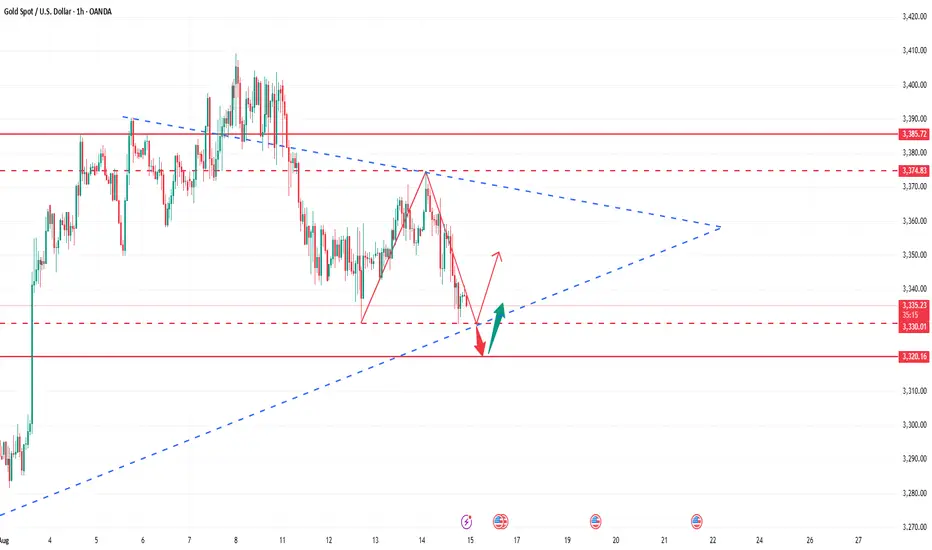
Gold Extends Rally as Rate-Cut Expectations Rise📊 Market Overview:
Gold prices extended gains for the third consecutive session, supported by rising expectations that the US Federal Reserve will cut interest rates in September, following softer US inflation data and a weaker US dollar.
📉 Technical Analysis:
• Key Resistance: $3,400 / $3,435
• Nearest Support: $3,358–$3,360 / $3,345
• EMA: Price is trading above EMA50 → bullish short-term signal.
• Candle / Volume / Momentum: Forming an ascending triangle pattern with positive momentum, suggesting potential for further upside.
📌 Outlook:
Gold may continue to rise in the short term if it breaks and sustains above $3,400. A drop below $3,360 could trigger a pullback toward $3,3345.
💡 Trade Strategy Suggestions:
🔻 SELL XAU/USD: $3,400–$3,403
🎯 TP: 40/80/200 PIPS
🛑 SL: $3,406
🔺 BUY XAU/USD : $3,350–$3,353
🎯 TP: 40/80/200 PIPS
🛑 SL: $3,347
Gold Gains Amid USD Weakness📊 Market Overview:
Gold rose modestly as the U.S. dollar weakened following softer-than-expected July CPI data, increasing the likelihood of a Federal Reserve rate cut in September. Geopolitical tensions surrounding the Trump–Putin meeting and ongoing trade war developments further supported demand for safe-haven assets like gold.
📉 Technical Analysis:
• Key Resistance: $3,360–$3,361 (near EMA50 area), $3,375–$3,380 (major resistance zone, 0.618 Fibonacci & option barrier)
• Nearest Support: $3,350–$3,351 (break below may lead to downside at $3,325), additional supports at $3,336, $3,324, $3,313
• EMA: Short-term trend neutral, slight bearish bias near resistance
• Candlestick / Volume / Momentum: RSI on H1 around 45–50 (neutral), volume declining, possible upcoming breakout
📌 Outlook:
Gold may continue to edge higher in the near term if it breaks resistance at $3,361 with strong volume and the USD remains weak. Otherwise, failure to surpass $3,375–$3,380 could lead to pullback toward support at $3,350 or further down to $3,330–$3,325.
________________________________________
💡 Suggested Trading Strategy:
🔺 BUY XAU/USD
Entry: 3,320 – 3,323
🎯 TP: 40/80/200 pips
❌ SL: 3,317
🔻 SELL XAU/USD
Entry: 3,375–3,378
🎯 TP: 40/80/200 pips
❌ SL: 3,381
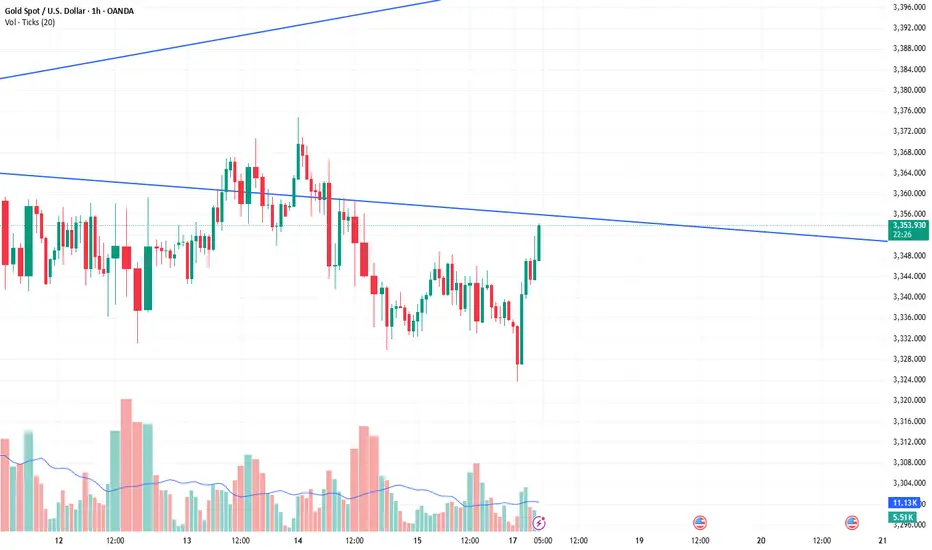
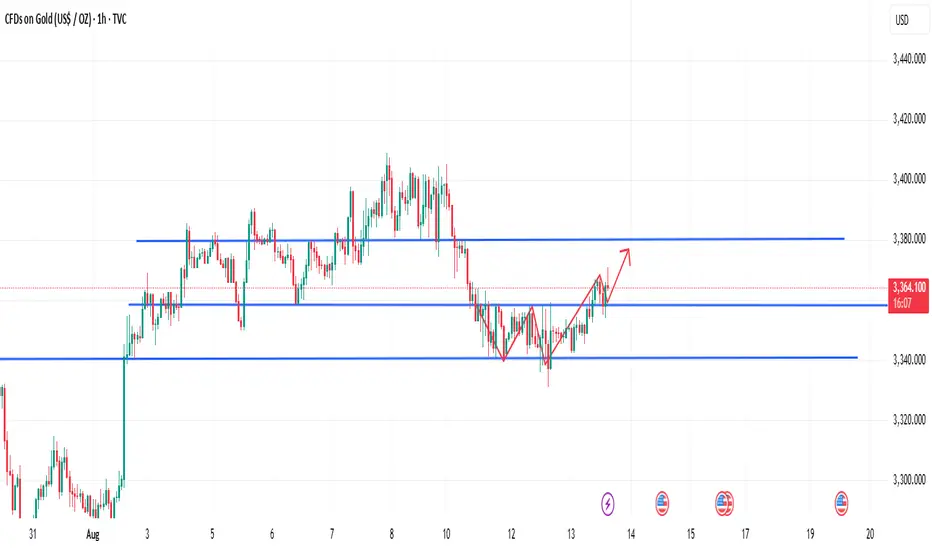
The pullback is for a better riseGold is currently showing signs of gradual technical recovery on the 4-hour chart after a period of consolidation. The price is slowly breaking out of the previous low-range oscillation zone, with short-term moving averages beginning to curve upward and diverge, indicating a potential strengthening trend in the near term. Moving forward, watch for a possible secondary upward surge after a retracement and consolidation. In the short term, keep an eye on the resistance zone around 3380.
On the hourly chart, there has been a minor pullback, but the momentum and follow-through remain limited. The expectation is that after a brief adjustment, the upward trend may continue with further room for gains.
Gold Poised for Mild Rebound amid Tariff Relief📊 Market Movement:
Gold eased after President Trump announced tariff exclusions on imported gold bars, easing prior market uncertainty. Safe-haven demand stays supported by macroeconomic and Fed policy concerns.
📉 Technical Analysis:
• Key Resistance: $3,385 – $3,410 – $3,460
• Nearest Support: $3,330 – $3,332
• EMA: Price fluctuates around medium-term EMA.
• Candlestick / Momentum: Ascending triangle, neutral RSI, rising volume → mild accumulation signs.
📌 Outlook:
Gold may see a mild rebound in the short term if trade policy remains stable and the Fed keeps rates unchanged. Strong US economic data could pressure prices downward.
________________________________________
💡 Suggested Trading Plan
🔻 SELL XAU/USD: $3,410–$3,413
🎯 TP: 40/80/200 pips
❌ SL: $3,416
🔺 BUY XAU/USD: $3,330–$3,333
🎯 TP: 40/80/200 pips
❌ SL: $3,327
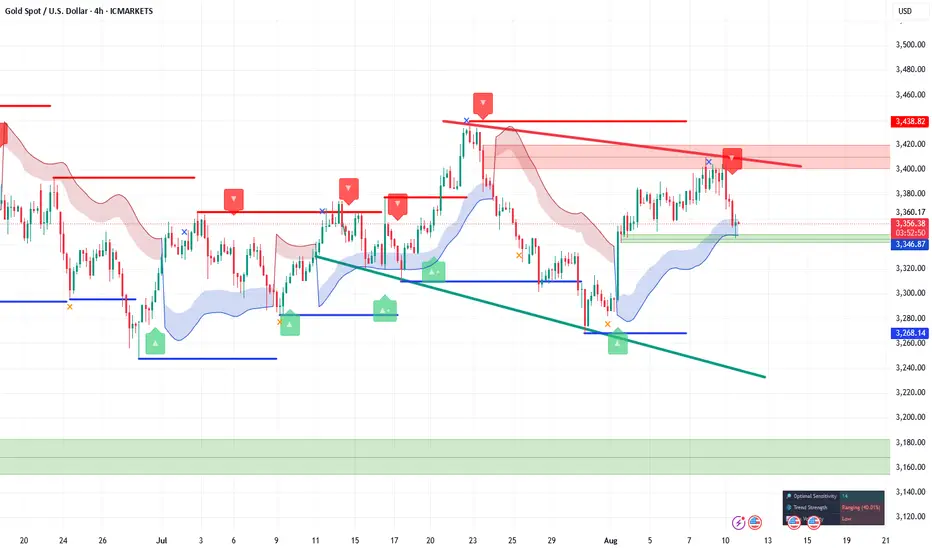
xauusd (GOLD): a signal Hi guys!
Key Technical Points:
Ascending Channel:
Price action has been moving within a well-defined ascending channel.
Currently, the price has pulled back and is approaching the lower boundary of this channel.
This lower boundary often acts as a support area where buyers might step in.
Support Zone (Red Box):
The red highlighted area, around $ 3,340-$ 3,350 USD, is a key support zone.
This zone aligns w ith the lower boundary of the channel , adding more weight to the support.
Price is currently testing this area, which could act as a springboard for the next upward move.
Resistance Zone (Blue Box):
The upper resistance zone between roughly 3,425 and 3,440 USD is a major target for bulls.
This is a previous high area where sellers might re-enter the market.
-------------------------------------------------------
Trade Idea:
Long Position:
Entry could be considered near the lower boundary of the channel and the red support zone (around 3,340-3,350 USD).
Stop loss placement: Just below the red support zone to limit downside risk.
Target: The upper resistance zone at around 3,425-3,440 USD.

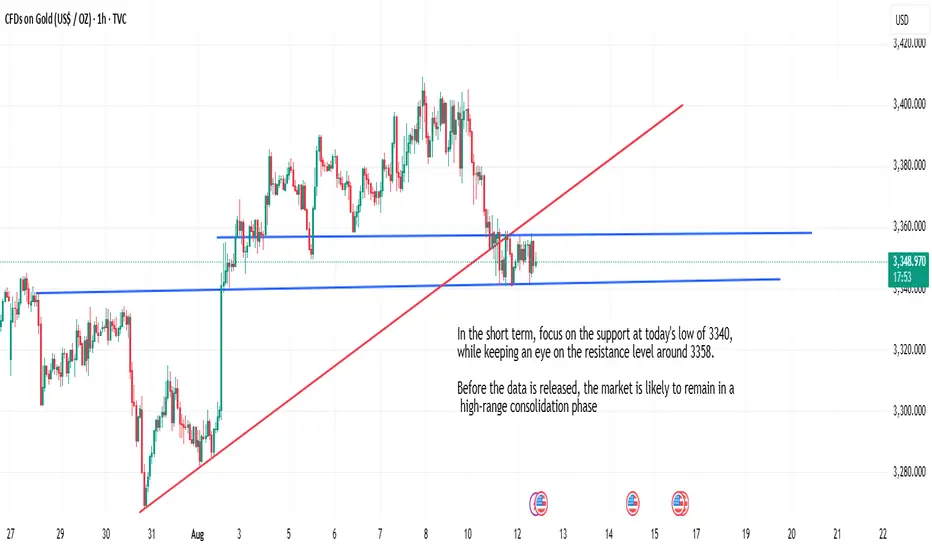
3400 failed again, what will be the subsequent trend?Breaking News: Trump signed the Sino-U.S. tariff "truce" agreement at the last minute, deciding once again to extend the deadline by 90 days starting from August 12. Another three months—the Sino-U.S. tariff risks have been temporarily averted. This news came as no surprise, so the market reaction has been muted. Next, all eyes are on the Trump-Putin meeting on August 15, which the market sees as the last opportunity to end the Russia-Ukraine war, making it a highly anticipated event.
Tonight, the CPI data will be released, and its trend will directly influence market expectations about whether the Fed will cut rates in September. As such, this data is certain to have a major impact on gold prices. If inflation exceeds expectations, gold may initially rally but then pull back, as rising inflation data is bullish in itself but would reduce rate-cut expectations, which is bearish. If the data falls short of expectations, gold may dip first before rising.
Last night, gold broke below last week’s starting rally point of 3,345, hitting a low near 3,340, indicating weak momentum. The 3,340 level is a critical support—a break below it would suggest that gold’s unilateral rise from 3,270 may shift back into a consolidation phase.
Technically, gold has managed to hold above the key support of the 200-period SMA on the 4-hour chart, currently positioned around the 3,344-3,342 range. Given that the oscillators on this chart reflect bearish momentum, a decisive break below this support could push gold toward the next intermediate support at 3,320.
Conversely, if prices rebound and break above the 3,358-3,360 zone, strong resistance is likely to emerge near 3,380.
Thank you all for your likes, comments and follows, we really appreciate it!
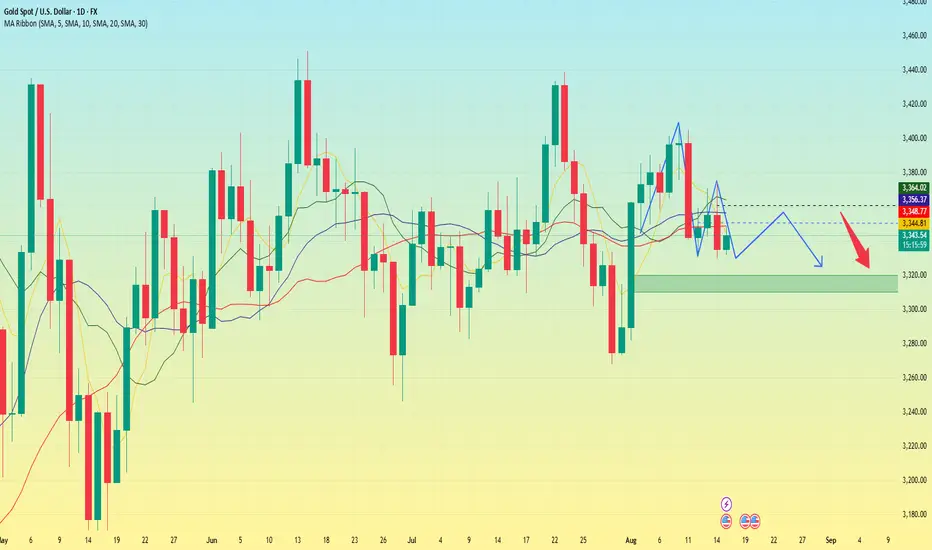
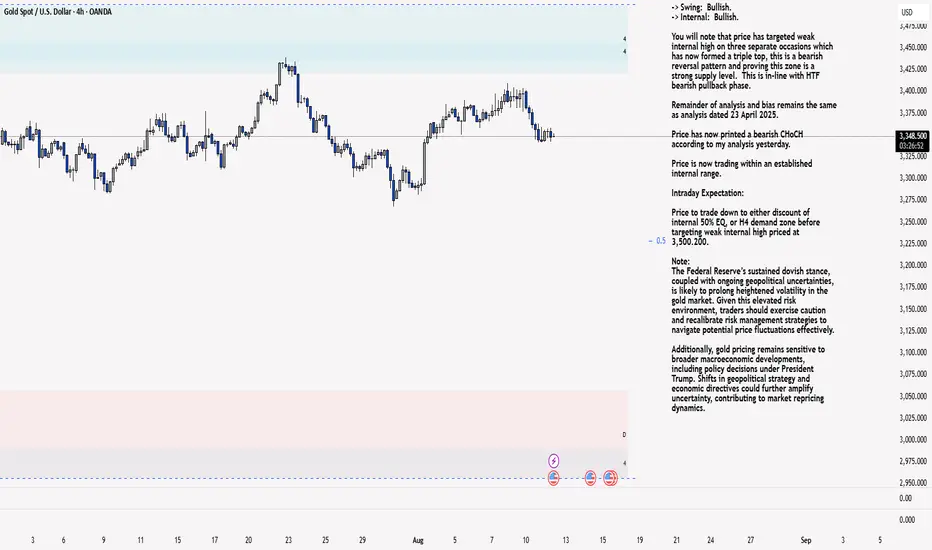
XAU/USD 12 August 2025 Intraday AnalysisH4 Analysis:
-> Swing: Bullish.
-> Internal: Bullish.
You will note that price has targeted weak internal high on three separate occasions which has now formed a triple top, this is a bearish reversal pattern and proving this zone is a strong supply level. This is in-line with HTF bearish pullback phase.
Remainder of analysis and bias remains the same as analysis dated 23 April 2025.
Price has now printed a bearish CHoCH according to my analysis yesterday.
Price is now trading within an established internal range.
Intraday Expectation:
Price to trade down to either discount of internal 50% EQ, or H4 demand zone before targeting weak internal high priced at 3,500.200.
Note:
The Federal Reserve’s sustained dovish stance, coupled with ongoing geopolitical uncertainties, is likely to prolong heightened volatility in the gold market. Given this elevated risk environment, traders should exercise caution and recalibrate risk management strategies to navigate potential price fluctuations effectively.
Additionally, gold pricing remains sensitive to broader macroeconomic developments, including policy decisions under President Trump. Shifts in geopolitical strategy and economic directives could further amplify uncertainty, contributing to market repricing dynamics.
H4 Chart:
M15 Analysis:
-> Swing: Bullish.
-> Internal: Bullish.
H4 Timeframe - Price has failed to target weak internal high, therefore, it would not be unrealistic if price printed a bearish iBOS.
The remainder of my analysis shall remain the same as analysis dated 13 June 2025, apart from target price.
As per my analysis dated 22 May 2025 whereby I mentioned price can be seen to be reacting at discount of 50% EQ on H4 timeframe, therefore, it is a viable alternative that price could potentially print a bullish iBOS on M15 timeframe despite internal structure being bearish.
Price has printed a bullish iBOS followed by a bearish CHoCH, which indicates, but does not confirm, bearish pullback phase initiation. I will however continue to monitor, with respect to depth of pullback.
Intraday Expectation:
Price to continue bearish, react at either M15 supply zone, or discount of 50% internal EQ before targeting weak internal high priced at 3,451.375.
Note:
Gold remains highly volatile amid the Federal Reserve's continued dovish stance, persistent and escalating geopolitical uncertainties. Traders should implement robust risk management strategies and remain vigilant, as price swings may become more pronounced in this elevated volatility environment.
Additionally, President Trump’s recent tariff announcements are expected to further amplify market turbulence, potentially triggering sharp price fluctuations and whipsaws.
M15 Chart:
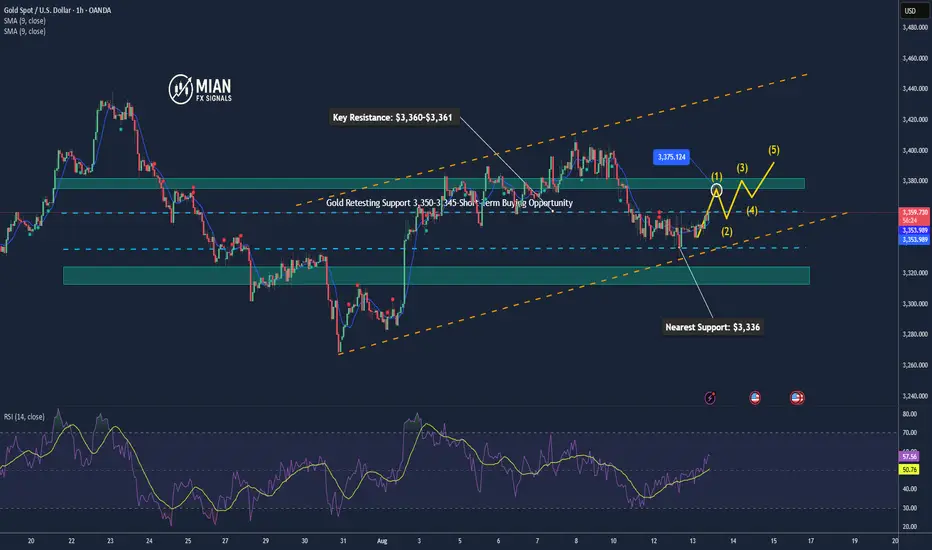
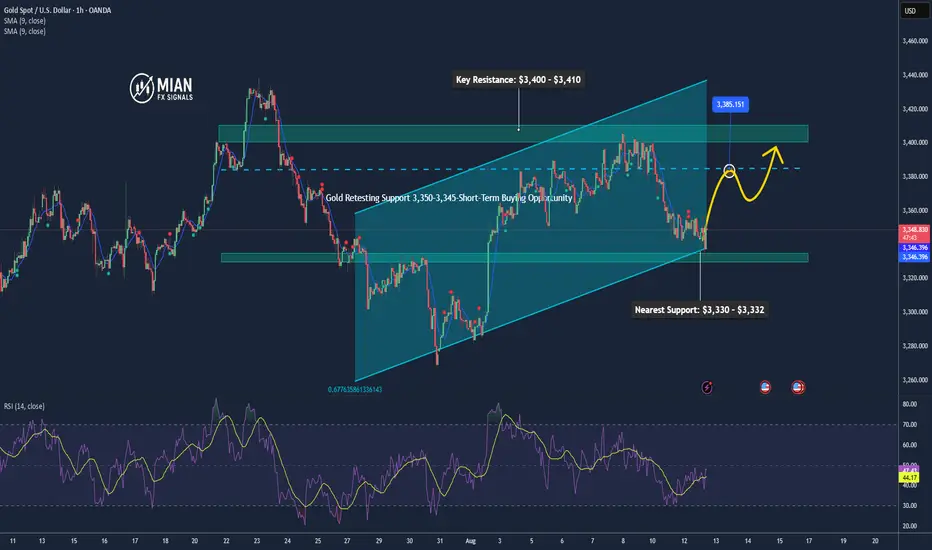
Gold Retesting Support 3,350–3,345-Short-Term Buying Opportunity📊 Market Overview
Gold is currently trading around 3,350 USD/oz, slightly higher than the previous session thanks to expectations that the Fed will cut interest rates amid a weakening USD. The market remains cautious ahead of upcoming U.S. inflation data, which could provide new momentum for gold prices. Additionally, President Trump’s confirmation that gold imports will not face tariffs has helped stabilize investor sentiment.
📉 Technical Analysis
• Key Resistance: 3,400 – 3,410 USD/oz
• Nearest Support: 3,345 – 3,350 USD/oz
• EMA09: Price is currently below the EMA09 on the H1 timeframe → short-term downward pressure still persists.
• Candlestick / Volume / Momentum: After a sharp drop on August 11, price is sideways around the support zone; RSI on H1 is about 56, not yet overbought, indicating potential for a rebound if support holds.
📌 Outlook
Gold could rebound short term from the 3,350–3,345 zone if U.S. inflation data comes in lower than expected and the USD continues to weaken. However, if price breaks below 3,345 with strong selling pressure, the downtrend may extend to 3,335 or 3,330.
💡 Suggested Trading Strategy
BUY XAU/USD: 3,346 – 3,343 USD/oz
🎯 TP: 40/80/200 pips
❌ SL: 3,339 USD
SELL XAU/USD: 3,407 – 3,410 USD/oz
🎯 TP: 40/80/200 pips
❌ SL: 3,413 USD

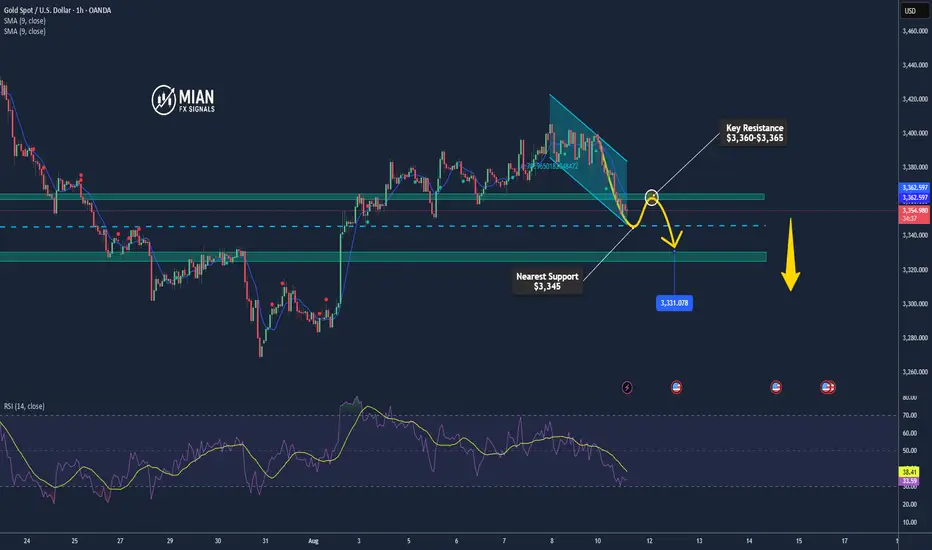
Gold Breaks $3,352 Support – Further Downside Risk📊 Market Overview:
• Spot gold is now trading at $3,352–3,356/oz, sliding sharply on profit-taking and uncertainty over potential U.S. import tariffs on gold.
• Weak buying interest at support pushed the price below the 200-hour MA, opening the door for deeper declines.
📉 Technical Analysis:
• Key resistance: $3,360–$3,365
• Nearest support: $3,345; next at $3,330
• EMA 09: Price remains below EMA09 → short-term trend is bearish
• Momentum: RSI below 45, sellers maintain control
📌 Outlook:
• Gold may continue to decline toward $3,345 or $3,330 if the H1 candle closes below $3,350.
• Only a break back above $3,365 with strong volume could trigger a short-term reversal.
💡 Suggested Trading Strategy:
SELL XAU/USD: $3,362–3,365
🎯 TP: 40/80/200 pips
❌ SL: $3,368
BUY XAU/USD: $3,345–$3,348 (only if clear bullish reversal candlestick forms)
🎯 TP: 40/80/200 pips
❌ SL: $3,342
GOLD Touches the Order blocks and does a little retracement.Gold is stuck in some range bond and is still not able to break 3500. Watch the DXY and be very careful when it breaks the supports or resistances. Can be fake-outs. Check your support and resistances and open positions accordingly. Wait for Price Again and strong solid breakouts to enter the market.
Disclaimer:
The content presented in this IMAGE is intended solely for educational and informational purposes. It does not constitute financial, investment, or trading advice.
Trading foreign exchange (Forex) on margin involves a high level of risk and may not be suitable for all investors. The use of leverage can work both for and against you. Before deciding to participate in the Forex market, you should carefully consider your investment objectives, level of experience, and risk tolerance.
There is a possibility that you may incur a loss of some or all of your initial investment, and therefore, you should not invest money that you cannot afford to lose. Be fully aware of all the risks associated with foreign exchange trading, and seek advice from a licensed and independent financial advisor if you have any doubts.
Past performance is not indicative of future results. Always trade responsibly.
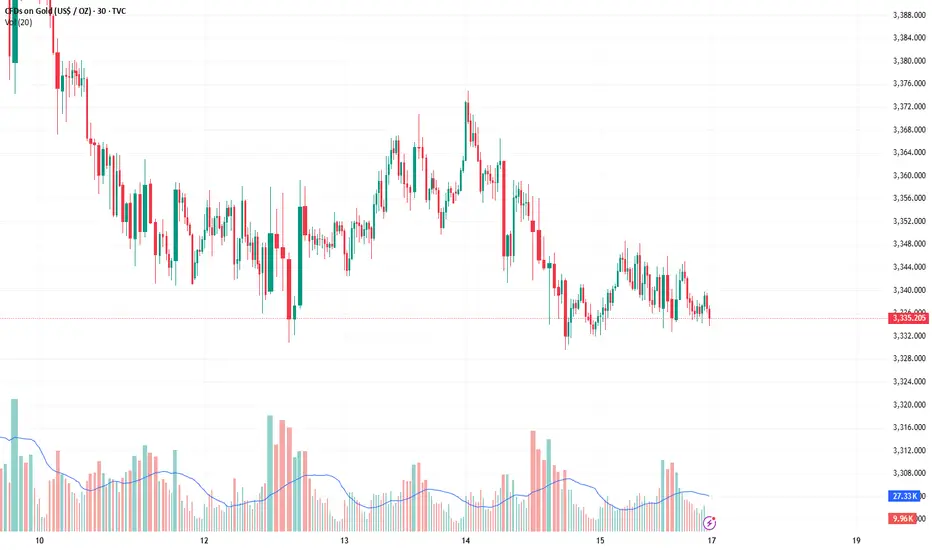
Gold weakness confirmed, short selling may accelerateAfter short-term sideways consolidation, gold continued its downward trend in the European session. It is expected to break the previous wide sweeping pattern today. In the 4H cycle, the price effectively fell below the middle Bollinger band under the pressure of continuous negative lines, showing the momentum of continued decline; after the short-term support of 3360 was lost, the lower Bollinger band space was further opened, and the weak pattern was confirmed. Strategically, the European and American sessions were adjusted to maintain a downward trend. The upper pressure focused on the 3365-3380 area. The operation was mainly rebound shorting. If 3350 was further broken below, the target could be extended to the 3340-3330 area.
Gold operation suggestion: short gold when it rebounds around 3365-3380, target 3350-3340-3330.