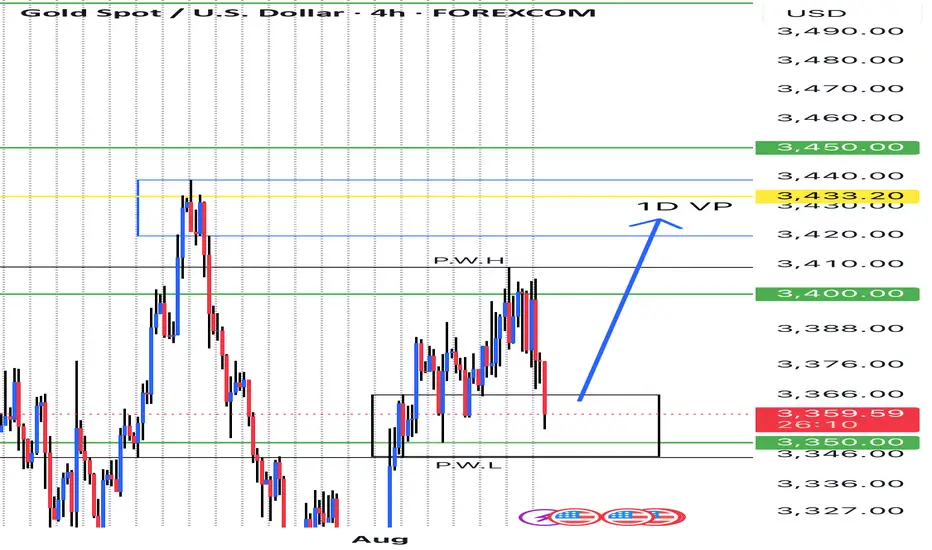
XAUUSDNext Reaction for GOLD will be around 3365- 3344. Once we see the reaction then we will wait for the raise.
Disclosure: We are part of Trade Nations Influencer program and receive a monthly fee for using their tradingview charts in our analysis.
Goldinvesting
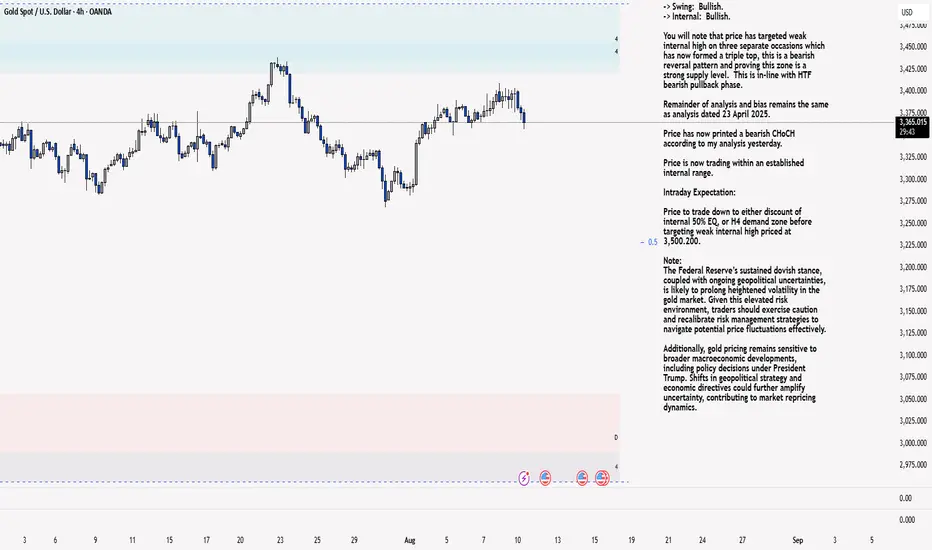
XAU/USD 11 August 2025 Intraday AnalysisH4 Analysis:
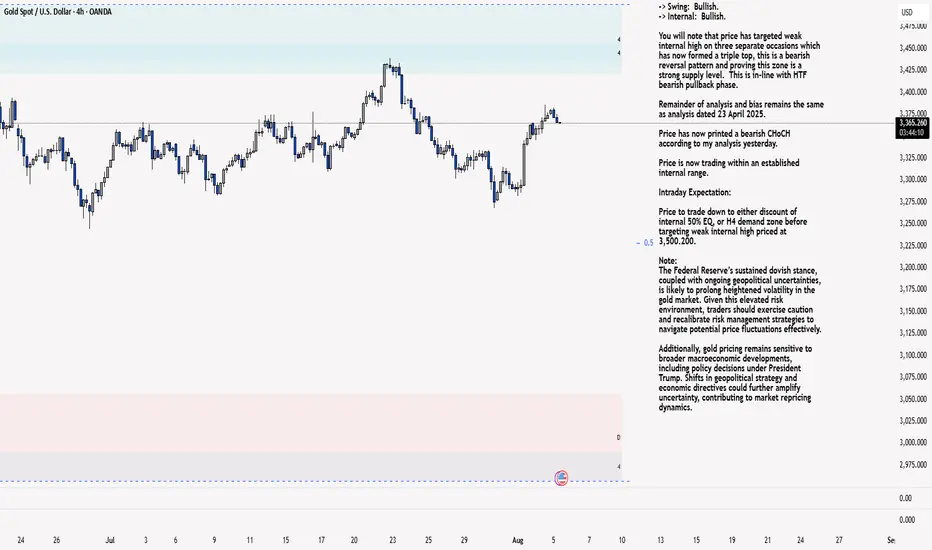
-> Swing: Bullish.
-> Internal: Bullish.
You will note that price has targeted weak internal high on three separate occasions which has now formed a triple top, this is a bearish reversal pattern and proving this zone is a strong supply level. This is in-line with HTF bearish pullback phase.
Remainder of analysis and bias remains the same as analysis dated 23 April 2025.
Price has now printed a bearish CHoCH according to my analysis yesterday.
Price is now trading within an established internal range.
Intraday Expectation:
Price to trade down to either discount of internal 50% EQ, or H4 demand zone before targeting weak internal high priced at 3,500.200.
Note:
The Federal Reserve’s sustained dovish stance, coupled with ongoing geopolitical uncertainties, is likely to prolong heightened volatility in the gold market. Given this elevated risk environment, traders should exercise caution and recalibrate risk management strategies to navigate potential price fluctuations effectively.
Additionally, gold pricing remains sensitive to broader macroeconomic developments, including policy decisions under President Trump. Shifts in geopolitical strategy and economic directives could further amplify uncertainty, contributing to market repricing dynamics.
H4 Chart:
M15 Analysis:
-> Swing: Bullish.
-> Internal: Bullish.
H4 Timeframe - Price has failed to target weak internal high, therefore, it would not be unrealistic if price printed a bearish iBOS.
The remainder of my analysis shall remain the same as analysis dated 13 June 2025, apart from target price.
As per my analysis dated 22 May 2025 whereby I mentioned price can be seen to be reacting at discount of 50% EQ on H4 timeframe, therefore, it is a viable alternative that price could potentially print a bullish iBOS on M15 timeframe despite internal structure being bearish.
Price has printed a bullish iBOS followed by a bearish CHoCH, which indicates, but does not confirm, bearish pullback phase initiation. I will however continue to monitor, with respect to depth of pullback.
Intraday Expectation:
Price to continue bearish, react at either M15 supply zone, or discount of 50% internal EQ before targeting weak internal high priced at 3,451.375.
Note:
Gold remains highly volatile amid the Federal Reserve's continued dovish stance, persistent and escalating geopolitical uncertainties. Traders should implement robust risk management strategies and remain vigilant, as price swings may become more pronounced in this elevated volatility environment.
Additionally, President Trump’s recent tariff announcements are expected to further amplify market turbulence, potentially triggering sharp price fluctuations and whipsaws.
M15 Chart:
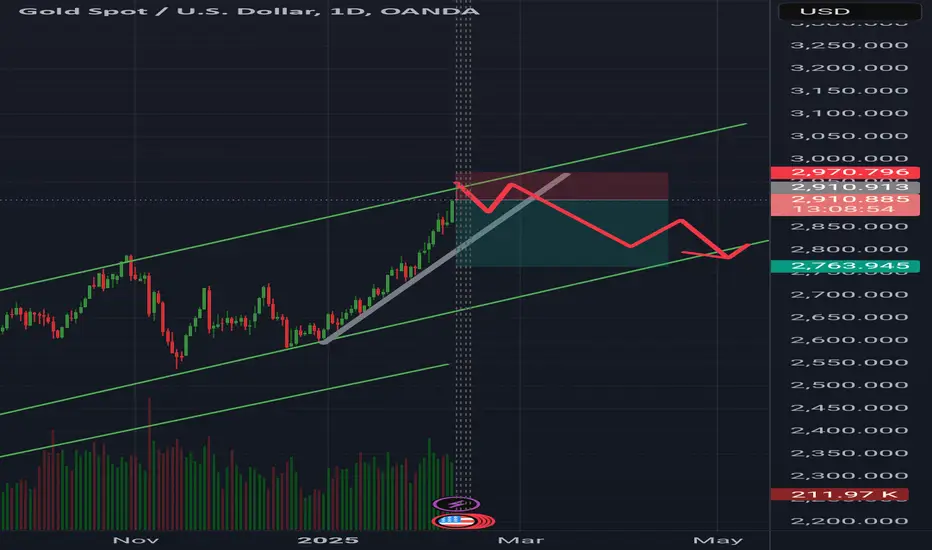
GoldGold usd daily analysis
Time frame daily
Risk rewards ratio >2.3
If we don't hear any news about war in middle east or Russia, I think gold come down to 2780$ area
Then, may be we have a war and new high for gold
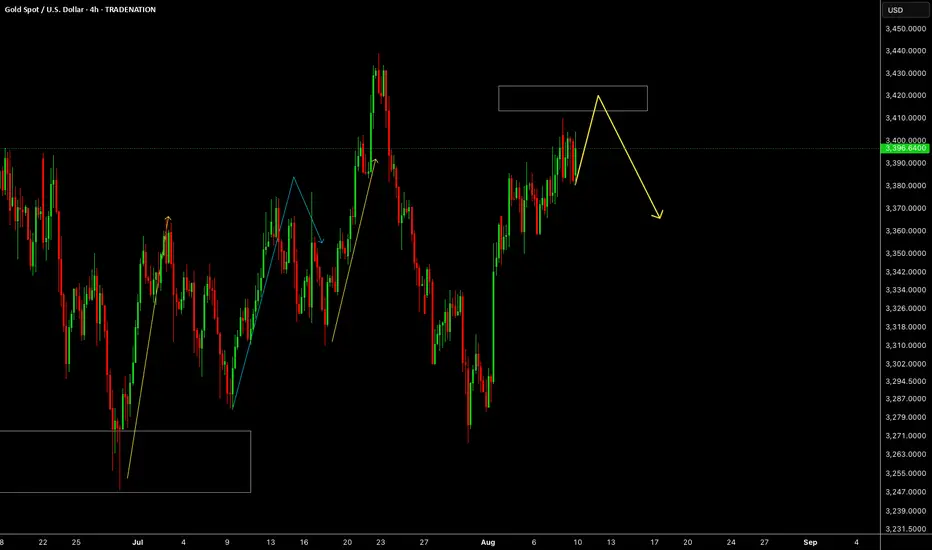
GOLDNext Reaction for Gold will be around 3415-3420. Once we see the reaction then we will wait for the drop.
Disclosure: We are part of Trade Nation's Influencer program and receive a monthly fee for using their TradingView charts in our analysis.
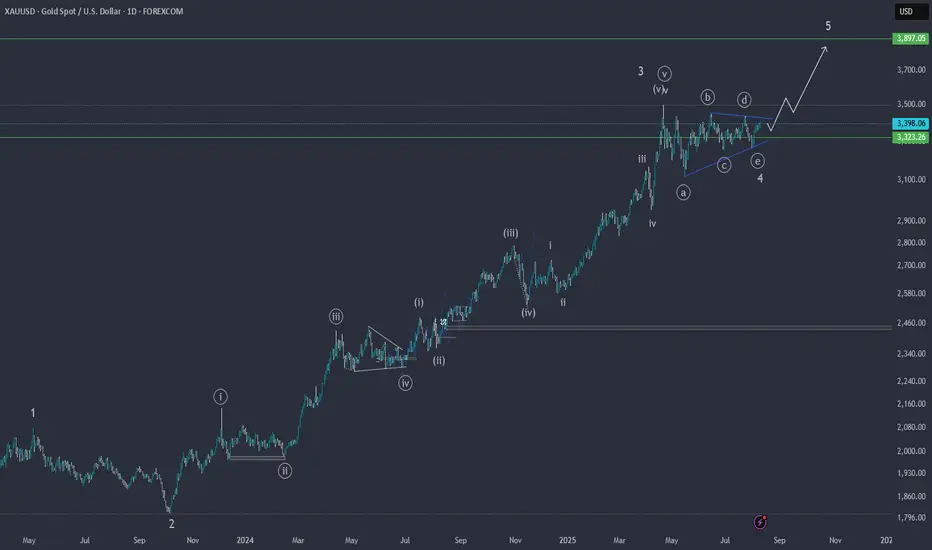
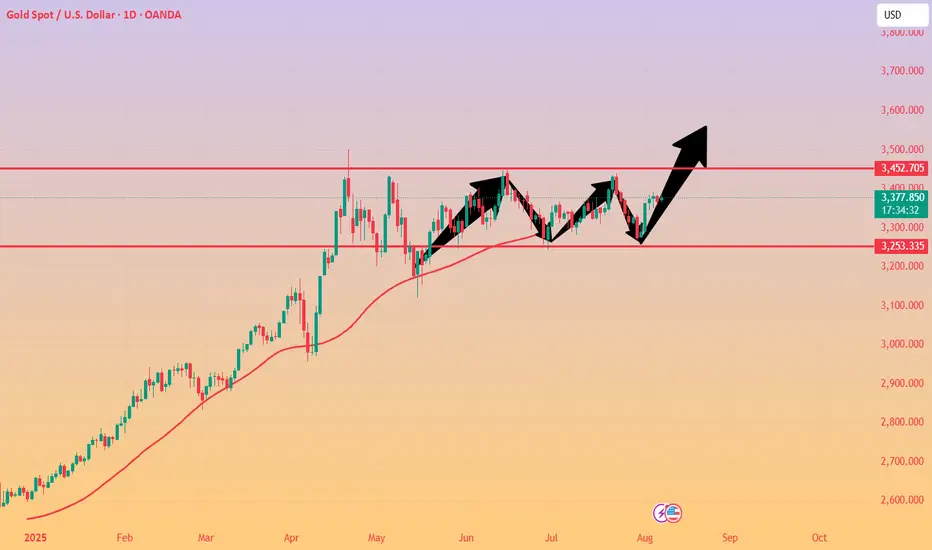
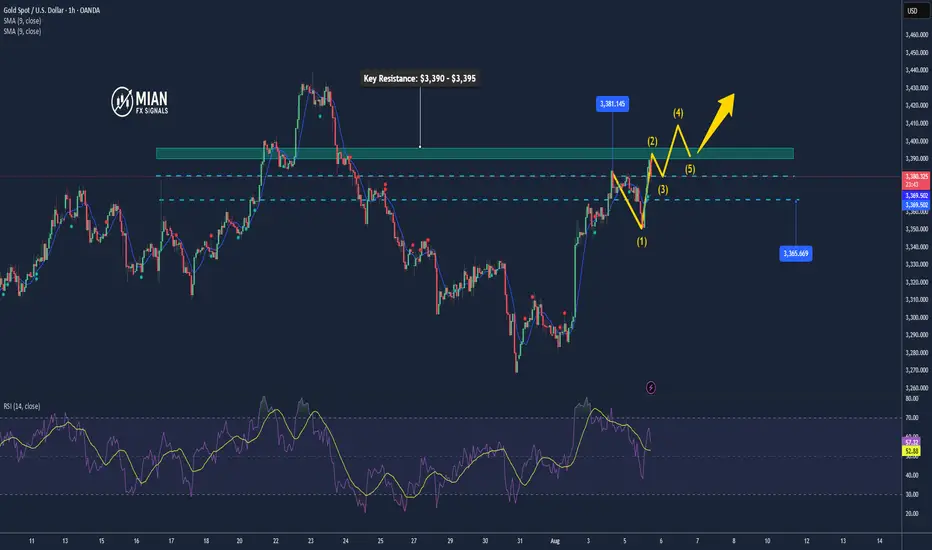
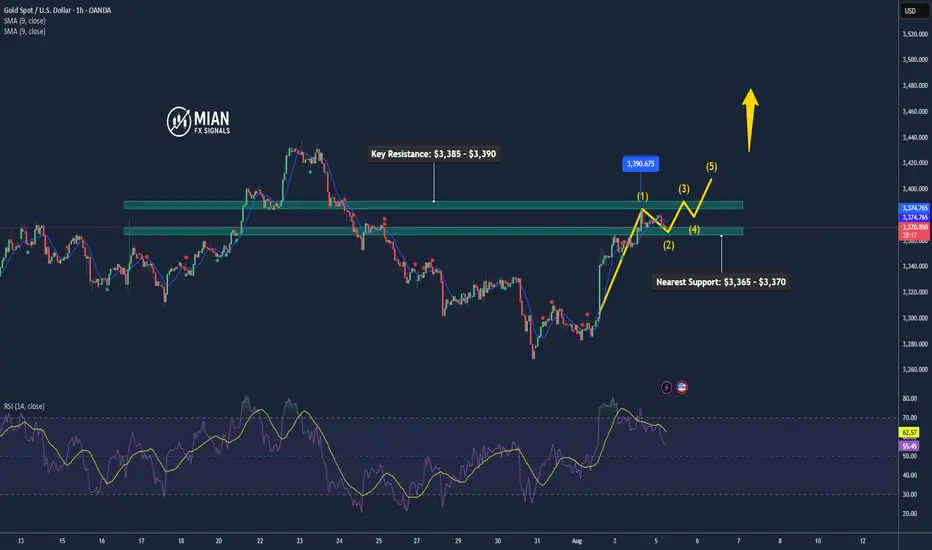
XAUUSD – Is Gold Ready for Its Final Rally? 📈 Elliott Wave Analysis on XAUUSD – Is Gold Ready for Its Final Rally? 💥
On the daily chart of XAUUSD, we’re observing the completion of a wave 4 triangle correction (ABCDE), which seems to be setting the stage for the beginning of wave 5 in the larger bullish cycle.
✅ Wave 3 showed a strong impulsive structure, and now the wave 4 triangle suggests consolidation before an explosive breakout toward the $3900 zone.
📍Key Resistance: 3900
🌀 We're anticipating a breakout above the upper channel line, potentially launching a sharp move as wave 5 unfolds.
💬 Share your thoughts in the comments! Do you think gold is ready to break its all-time high?
🔥 Save this idea & follow for future updates!
------------------------------------------------------------------------------------------------------
🚀 Who am I?
I'm Mahdi, a prop firm trader with 7+ years of experience in technical analysis, mainly focusing on Smart Money Concepts and Elliott Wave theory.
I specialize in delivering high-quality trading signals, market insights, and educational content tailored for serious traders and investors.
📊 My Tools: SMC, Elliott Wave, Fibonacci, Liquidity Grabs, Order Blocks
💼 Prop Challenge Passed: Yes | Funded Account: In Progress
🔗 Follow for consistent updates and trading insights.
Gold May Continue Its Short-Term Uptrend📊 Market Snapshot:
• Gold is holding above the $3,383–3,385 zone, reflecting strong buying pressure and slightly higher liquidity.
• Weaker-than-expected U.S. economic data, along with expectations of Fed rate cuts, are supporting gold’s upward momentum.
📉 Technical Analysis:
• Key Resistance: ~$3,408 (intraday high)
• Nearest Support: ~$3,383–3,385
• EMA: Price is currently above EMA 20, 50, and 100, indicating a clear bullish trend.
• Candlestick / Volume / Momentum: The $3,408 resistance zone could trigger a short-term pullback; momentum is showing signs of slowing near this level.
📌 Outlook:
Gold may continue rising in the short term if it holds above the $3,383–3,385 support zone and breaks through $3,408 with strong liquidity.
However, watch volume and price action at resistance — if momentum weakens, a pullback could occur.
💡 Suggested Trades:
SELL XAU/USD : $3,406–3,409
🎯 TP: 40/80/200 pips
❌ SL: ~$3,412
BUY XAU/USD : $3,381–3,384
🎯 TP: 40/80/200 pips
❌ SL: ~$3,378

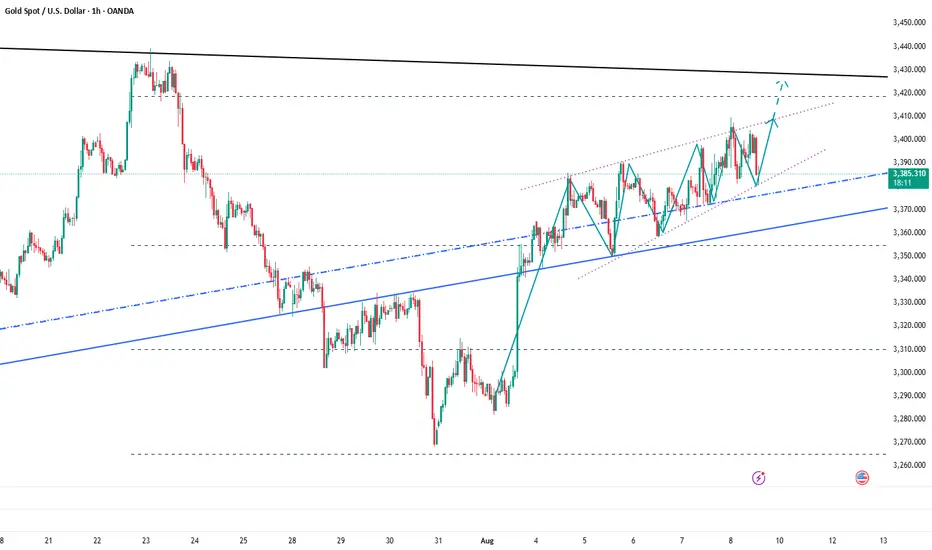
Next Stop 3420? Gold Bulls Push the Limit!Gold has shown a step-by-step rise in the short term, and has stood above 3,400 many times, and the bullish force is relatively strong. However, correspondingly, after gold stood above 3400, it fell under pressure several times, so the shape was not particularly good, which increased the risk of pullback in the short term.
However, we do not need to worry. Gold is still running in an ascending wedge structure. Although it has been under pressure and fallen back several times during the attack on 3400, the bullish structure has not been effectively destroyed so far. Moreover, with the sharp increase in gold buying, the 3380-3370 area below has become an obvious intensive trading area, which has greatly limited the gold retracement space.
In addition, after gold broke through 3340, market sentiment tended to be optimistic. If gold experiences a short-term pullback, more funds will flow into the gold market, especially for those who have missed out on long trades before, who will rush into the gold market even more frantically. Under the resonance of the current technical structure and market optimism, gold still has the potential to hit 3400, and bulls are even expected to stand firm at 3400 and make further efforts.
So in terms of short-term trading, I still advocate that gold pullbacks are buying opportunities. And I cherish the opportunity to enter the market and go long in the 3385-3375 area, and am optimistic that gold will hit 3400 again, and may even continue the bull trend to the 3420-3430 area.
OANDA:XAUUSD FOREXCOM:XAUUSD TVC:GOLD FX:XAUUSD CAPITALCOM:GOLD
XAUUSD GOLD BUYS Gold hit all take profits and now will be taking more trades into the correct direction for the rest of the trend , keep the trading simple and straightforward
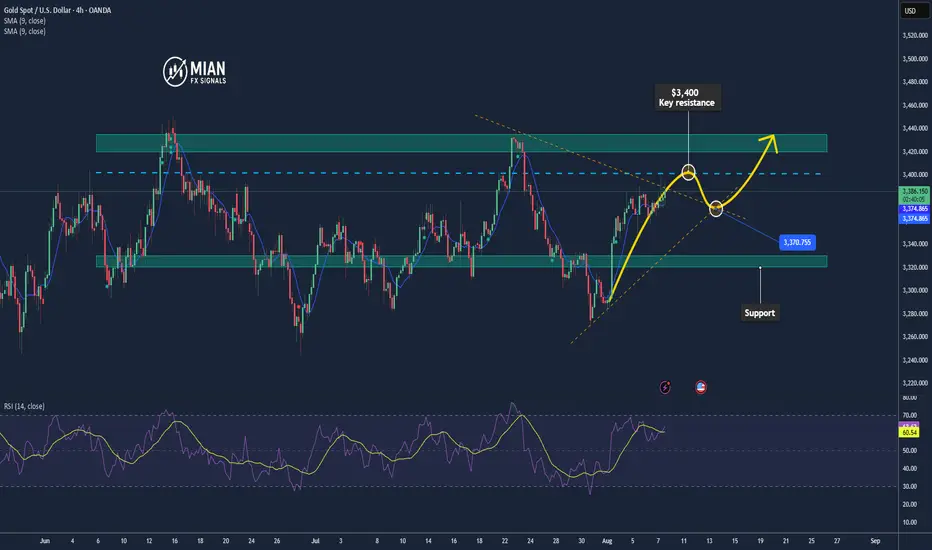
Gold Continues to Attract Safe-Haven Flows📊 Market Brief
Gold prices remain firm above the 20-day EMA and 50-day MA, reflecting increased safe-haven demand amid ongoing trade tensions and growing expectations of a Fed rate cut.
The price is currently testing the resistance area around $3,400/oz, while immediate support lies in the $3,320–$3,330/oz range.
📉 Technical Analysis
• Key Resistance:
- $3,400
- Followed by: $3,420–$3,435
• Nearest Support:
$3,320–$3,330
- If broken, next levels are $3,300–$3,268
• EMA Position:
- Gold remains above both the 20-day EMA and 50-day MA, indicating a short-term uptrend
• Patterns & Momentum:
- RSI ~54 (neutral), MACD positive – indicating underlying bullish momentum
- EMA 8/21 crossover is turning upward, signaling short-term bullish reversal potential
📌 Outlook
Gold may continue rising modestly if it holds above the $3,320–$3,330 support zone and successfully breaches the $3,400 resistance. However, a break below $3,320 could lead to a test of $3,300 or even $3,268.
💡 Suggested Trading Strategy
SELL XAU/USD : $3,395–$3,3400
o 🎯 TP: 40/80/200 pips
o ❌ SL: ~$3,405
BUY XAU/USD :$3,325–$3,330
o 🎯 TP: 40/80/200 pips
o ❌ SL: ~$3,320
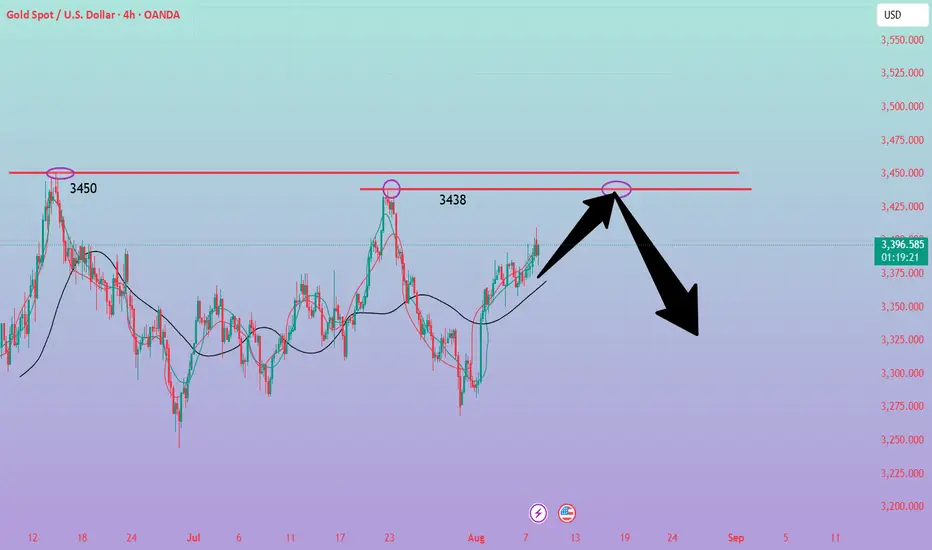
Buy gold near 3381, target 3399-3438Gold Market Analysis:
Gold's daily chart shows, as we previously discussed, a period of significant volatility within a high range. The previous non-farm payroll data and a series of other data points haven't triggered a major rally in gold. This period of volatility on the daily and weekly charts has lasted for four months. Gold needs a breakout in the future. Whether it breaks above or below, it will likely trigger a massive unilateral move. New traders fear unilateral moves, while experienced traders fear volatile trading. Large unilateral moves will likely take advantage of new traders, so it's crucial to establish stop-loss orders on each trade. In the short term, gold is currently rising in a wave structure. Yesterday, the US market reached 3408. The 3438 to 3450 range on the analysis chart is a barrier. Selling will require a major rebound here. I predict several more upward rallies today, so the short-term strategy for today is to buy low. The 4H chart of gold clearly shows a major upward and downward movement. Therefore, if it approaches the resistance range again, there's a possibility of a dip or reversal. The 1H chart reached 3370. If this level isn't broken today, we'll continue to buy. If it does, we'll adjust our strategy. We already bought at 3383 in the Asian session. Be mindful of volatile markets; wait and see, not rush into them. Gold trading in the Asian session between 3383 and 8370 presents buying opportunities.
Support is at 3383-3380, with strong support at 3370. Resistance lies at 3408 and 3438, with 3383 being the dividing line between strength and weakness.
Fundamental Analysis:
The tariff war has been the most significant fundamental factor impacting gold recently, but it will support it in the long term. This surge in gold prices is driven by Trump's renewed efforts, and the Federal Reserve's future monetary policy remains a key focus.
Trading Strategy:
Buy gold near 3381, target 3399-3438
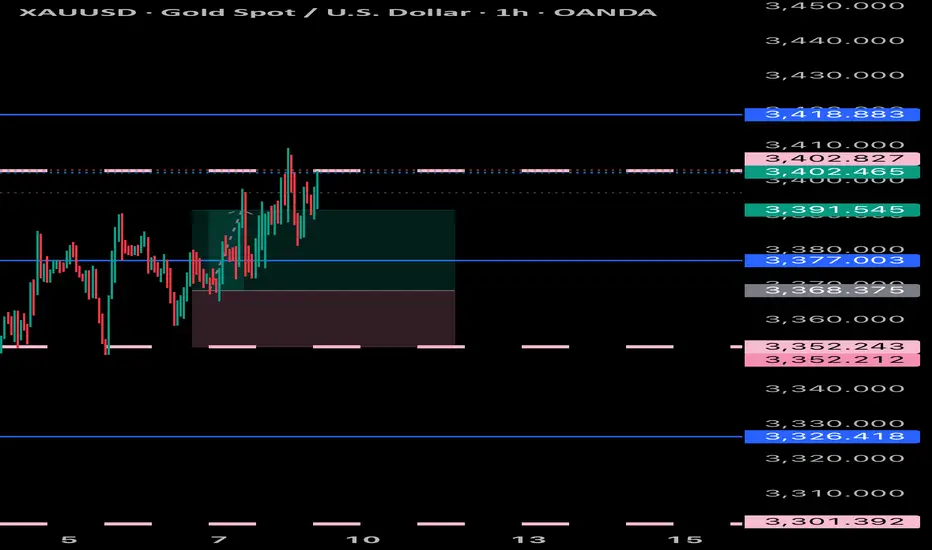
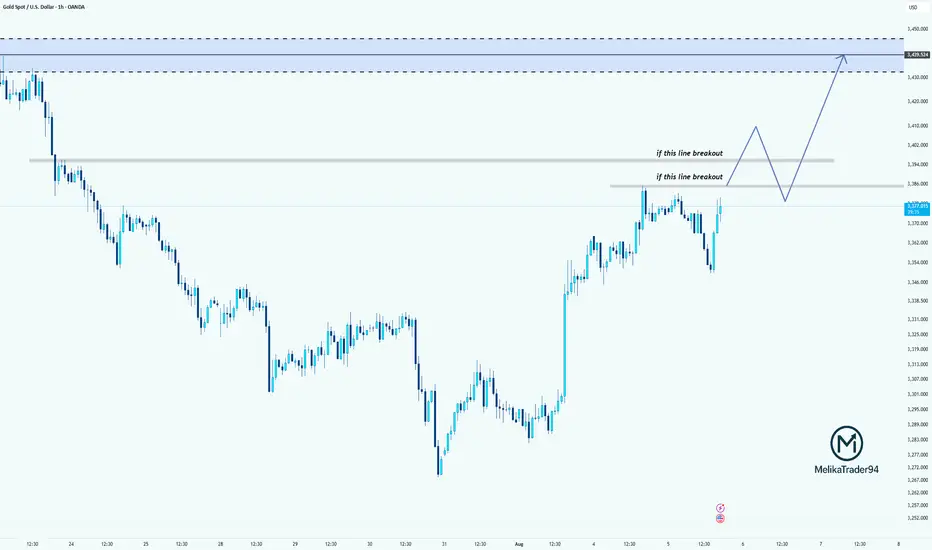
Breakout Levels in Focus for XAUUSDWhy did I say to cancel the last position? because gold is in the critical area!
Price is testing a key resistance area around 3374.
If it breaks above the first resistance level, we may see a bullish continuation toward the second breakout line.
If both levels are broken and retested successfully, the path toward the supply zone at 3430–3440 opens up.
Patience and confirmation are key here!
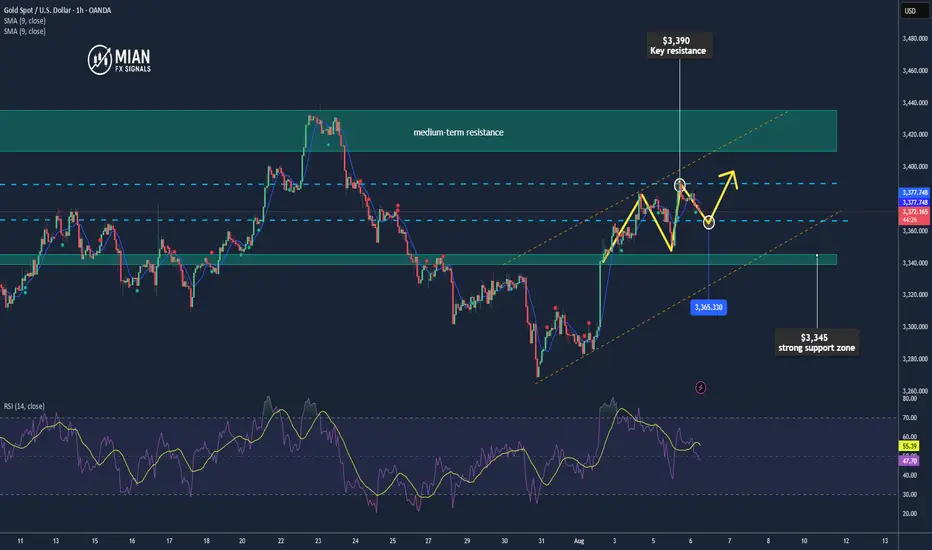
Analysis of subsequent gold price trends!Market News:
In early Asian trading on Thursday (August 7), spot gold prices fluctuated within a narrow range, currently trading around the 3,370 mark. International gold prices retreated slightly from a two-week high, primarily due to profit-taking by some investors, but the overall pullback was mild, indicating that bullish sentiment remained strong. The market is focused on US President Trump's upcoming announcement of his Federal Reserve nominee, a development that could profoundly impact the future path of interest rates and have a medium- to long-term impact on gold prices. Currently, while London gold prices have retreated slightly due to technical adjustments, the overall bullish structure remains intact. At the macro level, factors such as the slowdown in US service sector expansion, a cooling job market, rising business costs, and tariff uncertainty are compounding the market's heightened vigilance against stagflation and policy miscalculations. Furthermore, attention will be focused on changes in US initial jobless claims, the Bank of England's interest rate decision, and speeches by Federal Reserve officials.
Technical Analysis:
Gold prices fluctuated back and forth throughout the day. The US dollar index is declining significantly, suggesting a buy signal on the daily and weekly charts for gold. The 10/7-day moving averages are forming a golden cross and rising, the RSI indicator remains above the central axis, and the price is trading within the upper middle Bollinger Band. The Bollinger Bands on the four-hour chart are opening upwards, the moving averages are consolidating around the 70 mark, and the RSI indicator is trading above the central axis. With the US dollar's sharp decline and weakening, the key strategy for gold trading remains to buy at low prices. Don't chase highs when bullish on gold; wait for a pullback to buy. Don't speculate on the top of the rally; trade wherever the price can reach. Technically, gold has seen four consecutive days of gains on the daily chart, demonstrating strong trend strength. The upside is near the upper Bollinger Band of 3430. This price may be tested this week. A significant rally is not yet evident until the daily Bollinger Bands open up. Whether a significant rally will break through the previous high is not a matter of speculation; trade accordingly. Focus on two support levels within the short-term cycle: 3358 and 3350. After the Asian and European sessions conclude, consider placing effective buy orders based on actual conditions. We anticipate the upward trend will continue during the US session.
Trading Strategy:
Short-term gold buy at 3365-3368, stop loss at 3356, target at 3380-3400;
Short-term gold sell at 3387-3390, stop loss at 3398, target at 3360-3370;
Key Points:
First Support Level: 3365, Second Support Level: 3358, Third Support Level: 3343
First Resistance Level: 3390, Second Resistance Level: 3408, Third Resistance Level: 3420
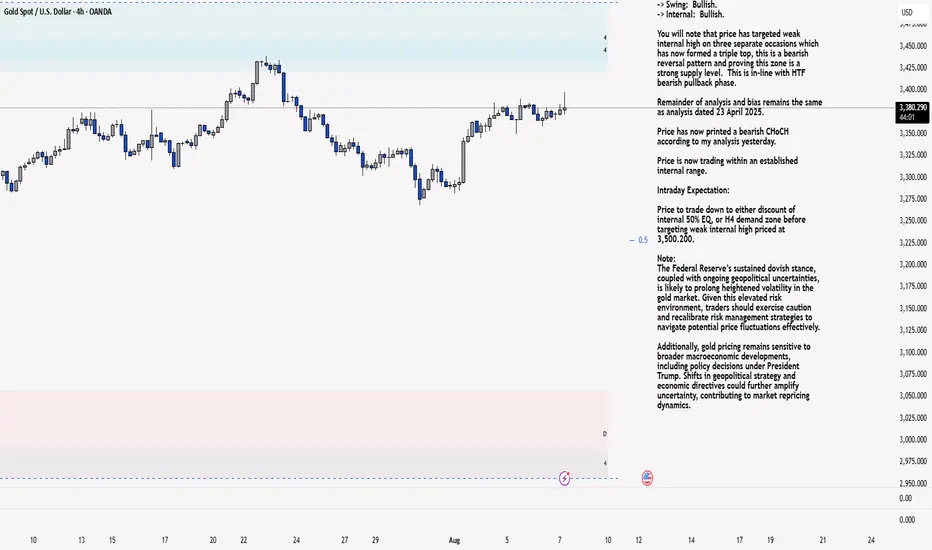
XAU/USD 07 August 2025 Intraday AnalysisH4 Analysis:
-> Swing: Bullish.
-> Internal: Bullish.
You will note that price has targeted weak internal high on three separate occasions which has now formed a triple top, this is a bearish reversal pattern and proving this zone is a strong supply level. This is in-line with HTF bearish pullback phase.
Remainder of analysis and bias remains the same as analysis dated 23 April 2025.
Price has now printed a bearish CHoCH according to my analysis yesterday.
Price is now trading within an established internal range.
Intraday Expectation:
Price to trade down to either discount of internal 50% EQ, or H4 demand zone before targeting weak internal high priced at 3,500.200.
Note:
The Federal Reserve’s sustained dovish stance, coupled with ongoing geopolitical uncertainties, is likely to prolong heightened volatility in the gold market. Given this elevated risk environment, traders should exercise caution and recalibrate risk management strategies to navigate potential price fluctuations effectively.
Additionally, gold pricing remains sensitive to broader macroeconomic developments, including policy decisions under President Trump. Shifts in geopolitical strategy and economic directives could further amplify uncertainty, contributing to market repricing dynamics.
H4 Chart:
M15 Analysis:
-> Swing: Bullish.
-> Internal: Bullish.
H4 Timeframe - Price has failed to target weak internal high, therefore, it would not be unrealistic if price printed a bearish iBOS.
The remainder of my analysis shall remain the same as analysis dated 13 June 2025, apart from target price.
As per my analysis dated 22 May 2025 whereby I mentioned price can be seen to be reacting at discount of 50% EQ on H4 timeframe, therefore, it is a viable alternative that price could potentially print a bullish iBOS on M15 timeframe despite internal structure being bearish.
Price has printed a bullish iBOS followed by a bearish CHoCH, which indicates, but does not confirm, bearish pullback phase initiation. I will however continue to monitor, with respect to depth of pullback.
Intraday Expectation:
Price to continue bearish, react at either M15 supply zone, or discount of 50% internal EQ before targeting weak internal high priced at 3,451.375.
Note:
Gold remains highly volatile amid the Federal Reserve's continued dovish stance, persistent and escalating geopolitical uncertainties. Traders should implement robust risk management strategies and remain vigilant, as price swings may become more pronounced in this elevated volatility environment.
Additionally, President Trump’s recent tariff announcements are expected to further amplify market turbulence, potentially triggering sharp price fluctuations and whipsaws.
M15 Chart:
Bullish Momentum Builds: Gold Set to Challenge 3400 and BeyondAlthough gold encountered resistance again near 3385 in the short term, the retracement has not been effectively continued so far, and the downward momentum is not particularly strong. Gold has always remained above the 3375-3365 area, with strong buying support below and the market bearish sentiment is not serious. In comparison, the bulls still have a considerable advantage!
The current gold price structure clearly maintains a strong bullish trend. With gold reclaiming the 3375-3365 area yesterday, bullish sentiment has further strengthened. As gold's center of gravity shifts upward, multiple strong support areas have formed below, limiting any potential pullbacks and further supporting its upward trajectory. Therefore, as long as gold can maintain above the 3375-3365 area, I believe that gold will definitely refresh the short-term high of 3390 again, and is expected to launch a strong impact on the 3400 mark, and may even continue to the 3420-3430 area.
So for short-term trading, I don’t have much desire to short gold for the time being. I am happy to watch for opportunities to enter long positions after gold retreats to the 3375-3365 area!

Gold May Pull Back Ahead of Fed Decision📊 Market Dynamics:
Spot gold is trading around $3,376.69/oz, down approximately 0.1%, as the US dollar strengthens and investors await Federal Reserve appointments, with continued rate-cut expectations for September
📉 Technical Analysis
• Key Resistance: ~$3,400 (analysts expect a test around this level)
• Nearest Support: ~$3,370 (near current trading range)
• EMA 09 (assumed): Price below EMA 09 → suggests short term bearish or consolidating momentum.
• Candlestick / Volume / Momentum: Mild selling pressure as USD gains, creating short term resistance for gold.
📌 Outlook:
Gold may experience a mild pullback or trade sideways in the short term if the dollar remains firm and no new catalysts strengthen rate cut expectations.
💡 Suggested Trading Strategy:
SELL XAU/USD : ~$3,395–3,398
o TP: 40/80/200 PIPS
o SL: ~$3,401
BUY XAU/USD : ~$3,365–3,370
o TP: 40/80/200 PIPS
o SL: ~$3,360
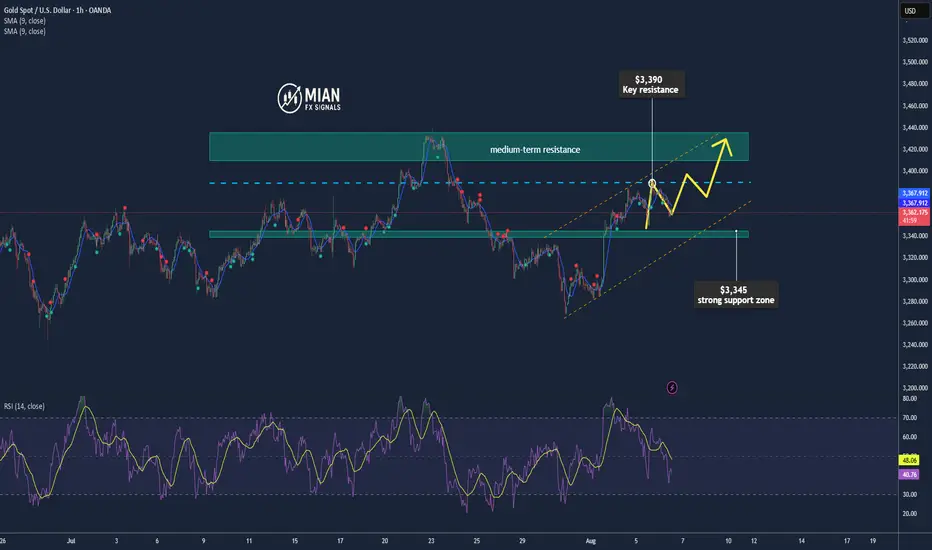
Gold May Correct Short-TermMarket Overview:
• Gold trading around $3,366–3,371 USD/oz, easing from two-week highs.
• Pressure from firmer US yields and USD recovery.
• Weak US jobs data boosted Fed rate cut expectations to ~90%.
• Still supported by global economic/political uncertainties and safe haven demand.
Technical Analysis:
• Resistance: ~$3,385–3,390, near psychological $3,400.
• Support: ~$3,345–3,350; break could target ~$3,310.
• Trading above EMA50, EMA9 direction still bullish short-term.
• RSI and MACD momentum fading; July monthly candle formed bearish “shooting star” near $3,431—invalidated only if price closes above that level.
Outlook
Gold may dip if USD and yields recover; but may rally if macro data deteriorate further. The $3,385–3,390 zone is pivotal.
Trading Strategy:
• Sell 3,392–3,395
TP ~40/80/200 pips
SL ~3,397
• Buy 3,345–3,348
TP ~40/80/200 pips
SL ~3,342
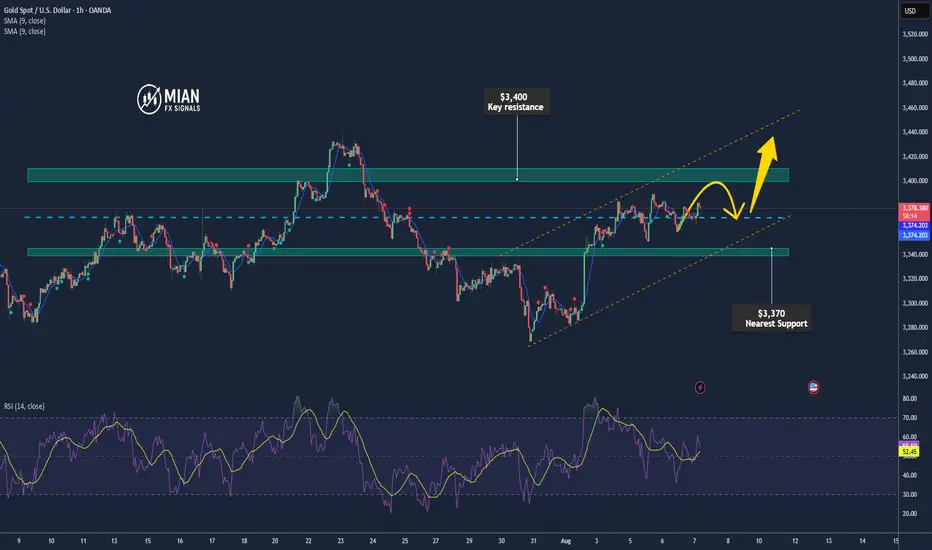
Gold Slightly Pulls Back – Awaiting Fed & Dollar Direction📊 Market Drivers:
Spot gold slipped ~0.1% to $3,376/oz, pressured by a firmer USD and caution ahead of Trump’s Fed chair and governor appointments
📉 Technical Analysis
• Key resistance levels:
o $3,390: previous session high – near-term ceiling
o $3,410: weekly high – stronger upside barrier
o $3,435: medium-term resistance – break above confirms strong bullish continuation
• Nearest support levels:
o $3,365: current Asian session low
o $3,345: strong support zone – EMA50 on H4 chart
o $3,305: last week's low – breakdown here may trigger deeper pullback
• EMA: Price remains above EMA09 and EMA50, suggesting a short-term bullish bias, though momentum is slowing.
• Candlestick / Volume / Momentum: Low volume in Asian session; H1 candles show indecision (doji with long wicks), signaling a tug-of-war between buyers and sellers.
📌 Outlook:
Gold may consolidate or dip slightly short-term unless it decisively breaks above $3,395 to confirm a new bullish leg.
________________________________________
💡 Suggested Trading Strategy:
SELL XAU/USD: ~3,392– 3,395
🎯 TP: 40/80/200 pips
❌ SL: ~3,398
BUY XAU/USD : ~3,366 - 3363
🎯 TP: 40/80/200 pips
❌ SL: ~3,360
Gold Maintains Bullish Momentum – Eyes $3,400📊 Market Summary:
Gold surged past the $3,385 resistance to reach a new high at $3,390, driven by weaker-than-expected ISM Services PMI data. The U.S. dollar softened and Treasury yields dipped, fueling the rally. However, after hitting the peak, some profit-taking emerged, causing gold to pull back slightly and currently trade around $3,383.
________________________________________
📉 Technical Analysis:
• Key Resistance:
$3,390–$3,395 – short-term local high. If this zone breaks, the next target is $3,400+.
• Nearest Support:
$3,380, followed by the previous breakout level at $3,365, both likely to act as support during any pullback.
• EMA 09 (Daily):
Price remains above the 9-day EMA, confirming the continuation of the short-term uptrend.
• Momentum / Volume / Candlestick:
RSI is holding above 60 – bullish. However, a long upper wick near $3,390 suggests short-term selling pressure or hesitation.
________________________________________
📌 Outlook:
Gold is showing bullish momentum, with the uptrend confirmed after breaking above $3,385. If price holds above $3,380, there's a strong possibility of testing the $3,400 level. However, a failure to sustain above this zone could lead to a retest of $3,365.
________________________________________
💡 Suggested Trade Strategy:
🔺 BUY XAU/USD : $3,380–$3,383
🎯 TP: 40/80/200 pips
❌ SL: $3,377
GOLD TRADES IN 2025 TILL AUGUSTThat is the result of discipline and consistency.
follow for more swing analysis on indices, commodities,and currencies.

Gold Breaks Support – Risk of Pullback Toward $3,310📊 Market Summary:
Gold prices initially rose on weaker-than-expected U.S. jobs data, which lowered Treasury yields and weakened the U.S. dollar. However, after breaking the key support at $3,365, gold continued to decline toward $3,354, and briefly touched $3,352, signaling rising technical selling pressure. Despite a 92% market expectation for a Fed rate cut in September, the technical breach increases the risk of a deeper correction.
📉 Technical Analysis:
• Key Resistance: Around $3,365–$3,370 – this zone now acts as short-term resistance; stronger resistance lies at $3,375–$3,380 if prices recover.
• Nearest Support:
The $3,365 level was broken.
New support is seen at $3,352–$3,350; a continued drop may bring prices to $3,335, and possibly toward $3,310–$3,300.
• EMA 09: Price is now below the 9-day EMA, suggesting a short-term bearish trend.
• Momentum / Volume / Candlestick:
RSI is near 50, slightly bearish; volume is tapering on the downside, indicating distribution.
Early signs of a head-and-shoulders (H&S) pattern are developing.
📌 Outlook:
Gold may continue declining in the short term if it stays below the $3,350–$3,352 zone.
A further drop toward the $3,335 – $3,310 region is possible.
If price rebounds and closes above $3,365, the bearish momentum could be neutralized.
💡 Suggested Trade Strategy:
🔻 SELL XAU/USD : $3,355–$3,358
🎯 TP: 40/80/200 pips
❌ SL: ~$3,361
🔺 BUY XAU/USD : $3,305–$3,302 (if price pulls back deeper)
🎯 TP: 40/80/200 pips
❌ SL: ~$3,299

XAU/USD 05 August 2025 Intraday AnalysisH4 Analysis:
-> Swing: Bullish.
-> Internal: Bullish.
You will note that price has targeted weak internal high on three separate occasions which has now formed a triple top, this is a bearish reversal pattern and proving this zone is a strong supply level. This is in-line with HTF bearish pullback phase.
Remainder of analysis and bias remains the same as analysis dated 23 April 2025.
Price has now printed a bearish CHoCH according to my analysis yesterday.
Price is now trading within an established internal range.
Intraday Expectation:
Price to trade down to either discount of internal 50% EQ, or H4 demand zone before targeting weak internal high priced at 3,500.200.
Note:
The Federal Reserve’s sustained dovish stance, coupled with ongoing geopolitical uncertainties, is likely to prolong heightened volatility in the gold market. Given this elevated risk environment, traders should exercise caution and recalibrate risk management strategies to navigate potential price fluctuations effectively.
Additionally, gold pricing remains sensitive to broader macroeconomic developments, including policy decisions under President Trump. Shifts in geopolitical strategy and economic directives could further amplify uncertainty, contributing to market repricing dynamics.
H4 Chart:
M15 Analysis:
-> Swing: Bullish.
-> Internal: Bullish.
H4 Timeframe - Price has failed to target weak internal high, therefore, it would not be unrealistic if price printed a bearish iBOS.
The remainder of my analysis shall remain the same as analysis dated 13 June 2025, apart from target price.
As per my analysis dated 22 May 2025 whereby I mentioned price can be seen to be reacting at discount of 50% EQ on H4 timeframe, therefore, it is a viable alternative that price could potentially print a bullish iBOS on M15 timeframe despite internal structure being bearish.
Price has printed a bullish iBOS followed by a bearish CHoCH, which indicates, but does not confirm, bearish pullback phase initiation. I will however continue to monitor, with respect to depth of pullback.
Intraday Expectation:
Price to continue bearish, react at either M15 supply zone, or discount of 50% internal EQ before targeting weak internal high priced at 3,451.375.
Note:
Gold remains highly volatile amid the Federal Reserve's continued dovish stance, persistent and escalating geopolitical uncertainties. Traders should implement robust risk management strategies and remain vigilant, as price swings may become more pronounced in this elevated volatility environment.
Additionally, President Trump’s recent tariff announcements are expected to further amplify market turbulence, potentially triggering sharp price fluctuations and whipsaws.
M15 Chart:
Gold Extends Gains as USD Weakens📊 Market Overview:
Gold prices are extending their gains during the Asian and European sessions today, as the US dollar weakens following weaker-than-expected US jobs data. Rising unemployment and a softer Non-Farm Payroll report boosted expectations that the Fed may cut interest rates in September. The US 10-year Treasury yield also dipped slightly, supporting gold's safe-haven appeal.
📉 Technical Analysis:
• Key Resistance: $3,385 – $3,390
• Nearest Support: $3,365 – $3,370
• EMA: Price is trading above the EMA 09, indicating a short-term bullish trend
• Candles / Volume / Momentum: H1 candles show steady buying pressure with stable volume, but we should monitor potential profit-taking if price nears the $3,390–$3,400 zone.
📌 Outlook:
Gold may continue to rise in the short term if USD weakness persists and bond yields stay low. However, failure to break above $3,390 could lead to a pullback toward support levels.
💡 Suggested Trading Strategy:
🔺 BUY XAU/USD: $3,365 – $3,368
🎯 TP: 40/80/200 pips
❌ SL: $3,362
🔻 SELL XAU/USD : $3,392 – $3,395 (if reversal signal appears)
🎯 TP: 40/80/200 pips
❌ SL: $3,398
XAU/USD(20250805) Today's AnalysisMarket News:
Goldman Sachs: We expect the Federal Reserve to cut interest rates by 25 basis points three times starting in September; if the unemployment rate rises further, a 50 basis point cut is possible.
Technical Analysis:
Today's Buy/Sell Levels:
3367
Support and Resistance Levels:
3407
3392
3383
3352
3342
3328
Trading Strategy:
If the stock breaks above 3383, consider buying, with the first target price at 3392. If the stock breaks below 3367, consider selling, with the first target price at 3352.
