Can Patience Unlock This XAU/EUR Opportunity? 🚨💰XAU/EUR: EURO HEIST IN PROGRESS – THIEVES GO BULLISH!💥🏴☠️
🕵️♂️ Attention, Market Robbers & Vault Crackers!
Thief Trader’s back with a high-stakes golden heist – and this time, EUR is the getaway car. 🎯💶
Forget breakout hype – this is pure limit-layered infiltration. Stealth entry. Silent profit. Heavy bags. 🎒📈
🧠 PLAN OF ATTACK:
🎯 Bias: Bullish (Gold’s about to flex on the Euro)
🎯 Entry: Any price – thief don’t chase, we wait in the dark. ☠️
🎯 Stop Loss: 2877.00 – 💥 tripwire before we vanish
🎯 Target: 2950.00 – get in, grab the gold, ghost the market 👻✨
🎯 STRATEGY: LAYERING METHOD – THE THIEF'S FINE ART
💼 We don’t go all-in… we stack limit orders like C4 charges.
💣 Layered entries across key price zones – stealth mode ON.
🧱 Let the market walk into our trap — snatch liquidity, don’t provide it.
🛠️ Execution Details:
🔹 No breakout chasing. No FOMO.
🔹 Set multiple Buy Limits across the zone.
🔹 Let price come to us like moths to gold flame 🔥
🛑 RISK PLAN – NEVER BLEED ON A ROBBERY
🎯 SL at 2877.00 – below vault support
🔑 Lock it. Walk it. Don’t argue with a stop.
💬 Adjust based on size, but don’t turn a job into a gamble.
🏁 TARGET EXIT: 2950.00 – THE HEIST PAYDAY
💎 That’s our clean escape.
⏱️ Don’t overstay. This isn’t a staking farm – it’s a smash-and-grab.
📉 Trailing SL recommended if you’re playing with size.
📊 Thief's Quick Insight:
🔍 Momentum: 📈 building
💶 EUR softness = GOLD opportunity
⚠️ Caution: No trades into news – thieves hate flashing sirens 🚓
📢 CREW CALL TO ACTION:
🚀 BOOST this setup
💬 Comment if you're riding with the robbers
💥 Hit LIKE if you love silent wins over loud losses
Stay low. Stack gold. Rob smart.
💼 Thief Trader™ – We rob the market, not the people.
🔐 This chart is for education only. Plan your own crime. This ain’t advice – it’s a blueprint for freedom. 🧠💼
Goldinvesting

Gold Continues Its Upward Momentum Despite Short-Term Pullback📊 Market Summary
• Spot gold slipped slightly by ~0.1% to around $3,354–$3,361/oz due to profit-taking after last week’s sharp rally following weaker-than-expected U.S. job data
• The U.S. added only 73,000 jobs in July, boosting expectations of a Federal Reserve rate cut in September, with a current market probability of around 81%
• Ongoing geopolitical risks, trade tensions, and robust central bank and ETF gold demand continue to support the long-term bullish outlook
________________________________________
📉 Technical Analysis
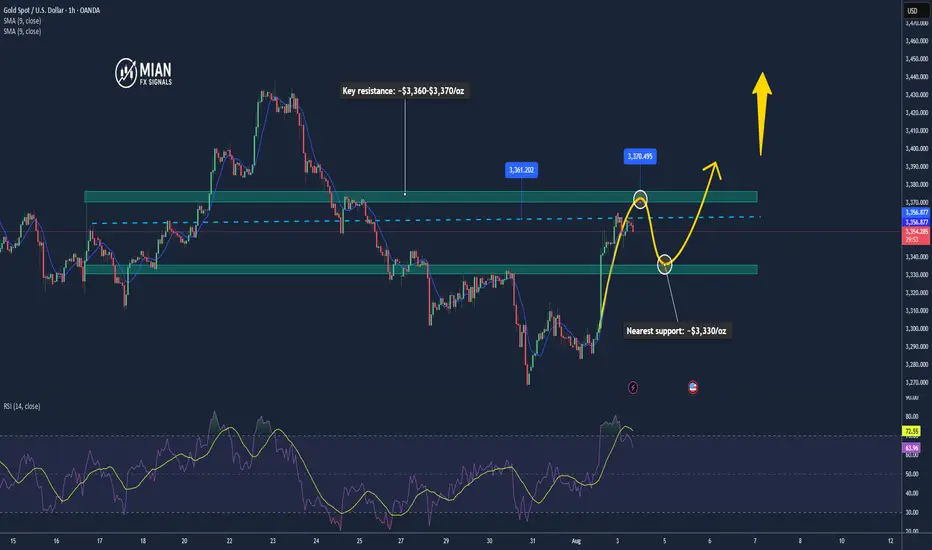
• Key resistance: ~$3,360–$3,370/oz (short-term highs, potential profit-taking zone).
• Nearest support: ~$3,330/oz (watch for buying interest on pullbacks).
• EMA09: Price is currently hovering around the short-term EMA (~EMA09), still below EMA50, indicating a mild sideways bias. According to Economies.com, gold hasn’t confirmed a stable uptrend above EMA50 yet
• Candlestick / volume / momentum:
o Today's candle shows mild profit-taking, but momentum remains bullish from the prior session. Volume shows light distribution, not strong selling.
________________________________________
📌 Outlook
• Gold may continue rising slightly in the short term if the upcoming U.S. inflation data (due August 12) remains soft, reinforcing the likelihood of a Fed rate cut
• Conversely, if the U.S. dollar strengthens unexpectedly or new data comes out more robust, gold could retreat back to the $3,330 zone.
________________________________________
💡 Suggested Trading Strategy
SELL XAU/USD : $3,370–$3,373
🎯 TP: 40/80/200 pips
❌ SL: $3,377
BUY XAU/USD : $3,330–$3,333
🎯 TP:40/80/200 pips
❌ SL: $3,327
Gold prices soar to new highs!Market News:
Spot gold prices fluctuated at high levels in early Asian trading on Monday (August 4), currently trading around $3,349 per ounce. Gold prices surged by over 2% last Friday (August 1), reaching a weekly high. This is due to the fact that US July non-farm payroll data fell far short of expectations, increasing the likelihood of a Federal Reserve rate cut. Furthermore, Trump's new round of tariff announcements has fueled safe-haven demand. Global economic uncertainty, a weakening US dollar, and rising expectations of a Fed rate cut have all provided strong momentum for the rise in international gold prices.
Against the backdrop of continued global economic uncertainty, gold's appeal as a safe-haven asset is expected to further increase. Investors should closely monitor market trends to seize potential opportunities. This trading day, attention should be paid to the US June factory orders monthly rate and continued monitoring of news related to the international trade and geopolitical situation.
Technical Analysis:
From a macro perspective, the monthly chart shows four consecutive long upper shadows and three dojis. This high-level doji formation in an uptrend is overwhelming, prompting caution in buying and caution in the market. Be wary of potential sell-offs in the future. We have repeatedly emphasized the importance of the monthly gold chart in recent months!
On a weekly basis, gold bottomed out and rebounded last week, hitting the middle support band and rebounding. Prices remain within the range, currently shrinking to 3268-3438. The Bollinger Bands continue to close, while the MA5 and MA10 levels remain in a volatile pattern. A unilateral trend still needs time to develop. On a daily basis, there was an extreme rally on Friday night, with the daily chart closing with a large real bullish candlestick. The price directly broke through the short-term moving average and the middle support band, forming a strong Yang-enclosing-Yin pattern. This is a positive bullish signal. So, is it a good time to buy on Monday?
I personally don't recommend buying directly from high levels. Gold rebounded from 3268, surging nearly $100 over two trading days without a significant pullback. Even if there was a pullback on Thursday, it was a single-digit pattern, which doesn't provide solid support for a bullish rally. Therefore, I don't recommend chasing long positions. Instead, watch for a potential sell-off after a rally. Focus on resistance at 618 and resistance near 3376, a previous top-bottom reversal.
Looking at gold on both the 4-hour and hourly charts, the Bollinger Bands are showing signs of opening after last Friday's surge. However, it's important to note that such surge-like openings are generally not sustainable, and will close again upon retracing technical indicators. The 4-hour candlestick chart is currently trading above the upper band, no longer favoring a buy-now-up move. The 1-hour moving average is blunting, and the upper band of the Bollinger Band is about to close. Overall, while gold is strong, it's best not to chase the bulls. Focus on selling opportunities on rallies today, and then consider a bullish move after a pullback.
Trading strategy:
Short-term gold: Buy at 3330-3333, stop loss at 3322, target at 3360-3380;
Short-term gold: Sell at 3375-3378, stop loss at 3387, target at 3340-3320;
Key points:
First support level: 3342, second support level: 3330, third support level: 3316
First resistance level: 3376, second resistance level: 3388, third resistance level: 3400
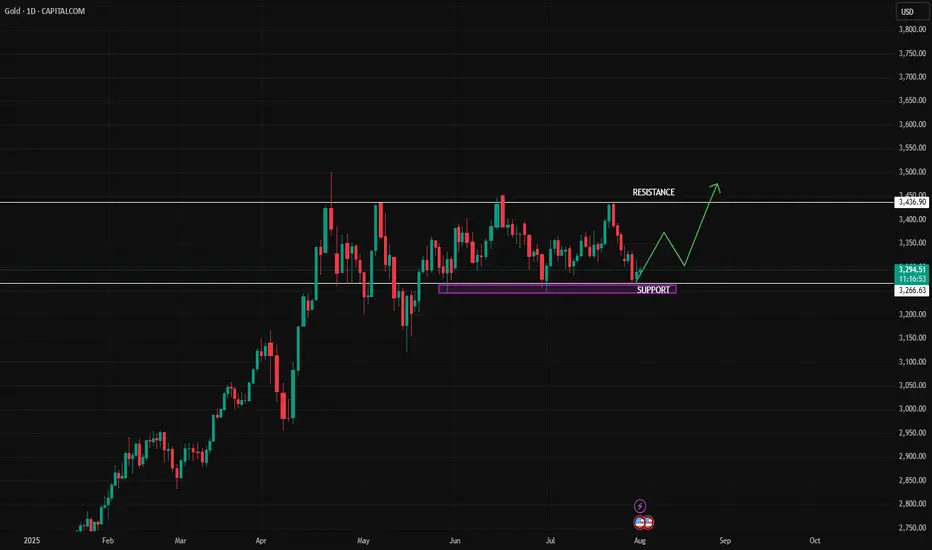
**"Gold Price Rebounding from Support:Potential Move Toward 3436This chart shows the **price movement of Gold (XAU/USD)** on a **daily timeframe**.
### Key Points:
* **Support Zone** : Around **\$3,266**, this is the area where price has bounced up multiple times, meaning buyers step in here.
* **Resistance Line**: Around **\$3,436**, this is the level where price has been rejected before, meaning sellers are strong here.
* **Current Price**: Around **\$3,293**.
### What the Chart Suggests:
* Price is near the **support** zone again.
* If the support holds, the green arrow shows a possible move **upward**.
* Price may first move up slightly, pull back, and then try to **break above resistance** at \$3,436.
Gold is in a sideways range. It's near a strong support level and might go up from here toward the resistance level, as shown by the green line.
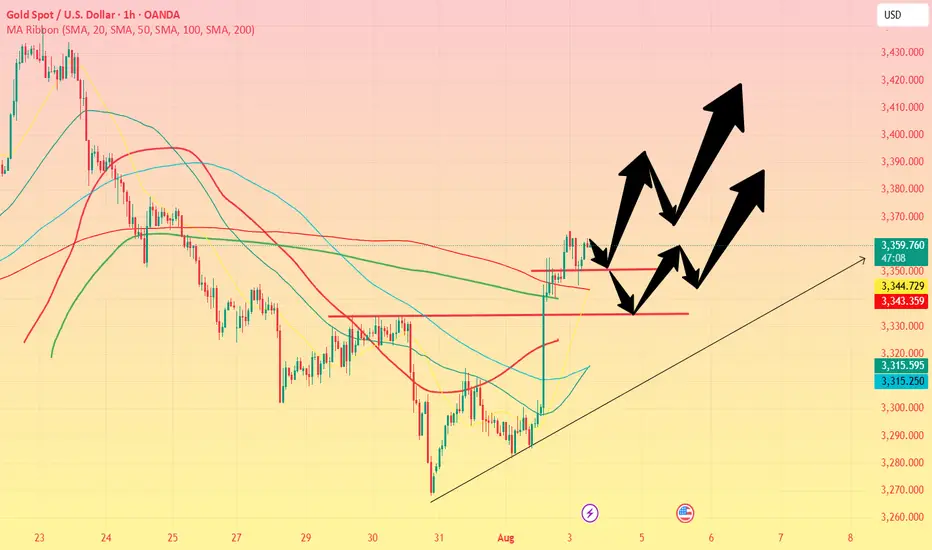
How to accurately grasp the gold trading opportunitiesGold was greatly affected by the positive non-farm payroll data, and it rose strongly, with the increase completely covering all the losses this week. The current gold trend has completely reversed the previous bull-short balance. After breaking through the 3300 level and rising to around 3355, it maintains strong upward momentum, and the possibility of further testing the 3360-3375 area cannot be ruled out. Due to the strong positive data, if everyone fails to chase the long position or set a breakout long position in time in the first wave of the market, the subsequent pullback opportunities may be relatively limited, so it is necessary to maintain an active strategy in operation. It is recommended to continue to be bullish when it retreats to the 3335-3320 area, and the upper target is the 3360-3375 pressure range.

XAUUSD: BUYThere are some good trading opportunities in the market. That's when to buy. Gold prices haven't fallen further since falling back to 3390. There's no further negative news. Therefore, there won't be a significant short-term decline. Our focus will be on tomorrow's non-farm payroll data update. This is a crucial factor that can cause gold prices to rise or fall significantly in the short term.
I'll update you with real-time buy and sell opportunities. This is based on research from the Swing Trading Center. It's highly authoritative. Don't miss out! Remember to stay tuned.
XAUUSD: BUY 3292-3282 TP 3320. SL 3265

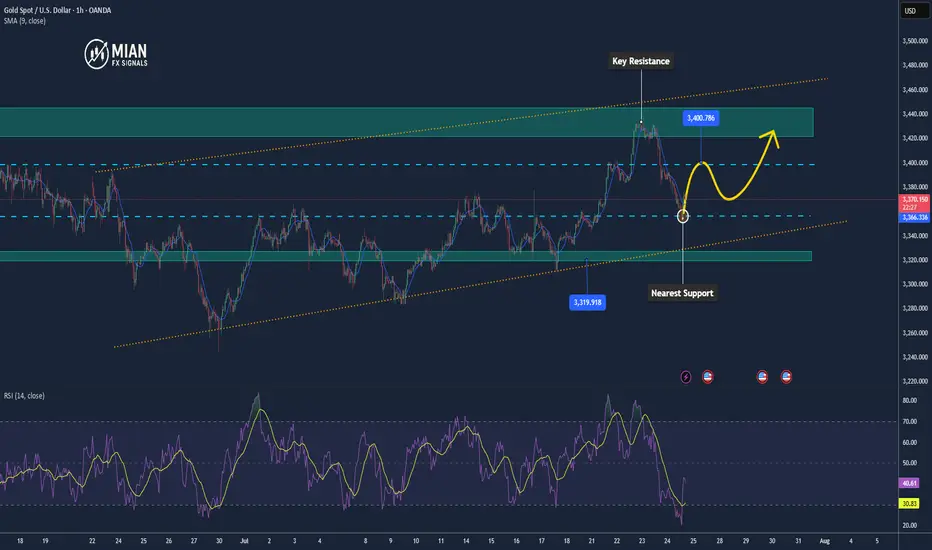
GOLD Weekly Idea💡Why Gold Pulled Back
- Gold pulled back today after hitting $3439.04, just below resistance at $3451.53. Traders took profits ahead of key Fed and trade headlines. Right now, it’s trading around $3414.48, down 0.50%.
- The dip came after the U.S.-Japan trade deal eased geopolitical tension, cutting safe-haven demand. Plus, U.S. bond yields are climbing (10-year at 4.384%), which adds pressure on gold.
Support is building at $3374.42, with stronger buying interest expected around $3347.97 and the 50-day moving average at $3336.40 — a key level bulls want to defend.
Short-term looks a bit weak, but as long as gold holds above the 50-day MA, the bullish trend remains intact. Longer-term, weakness in the dollar, central bank gold buying, and concerns about Fed independence could push prices higher.
🔍Watching the Fed’s July 29–30 meeting next
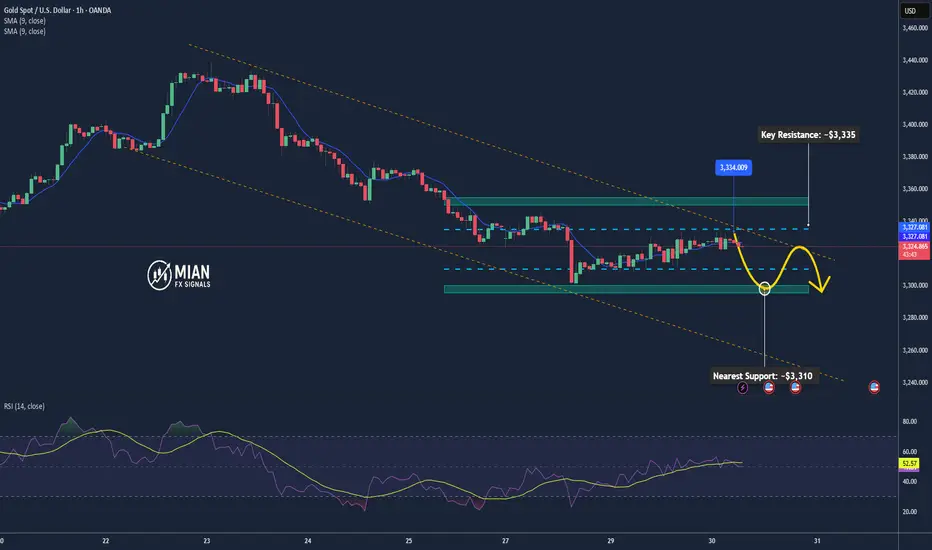
Gold May Dip Mildly Before US Data📊 Market Overview:
Spot gold is trading around $3,329/oz, up ~0.1%, supported by falling U.S. Treasury yields and a slightly weaker dollar, while investors await potential Fed dovish signals or rate cut in September . Meanwhile, easing U.S.–EU trade tensions weighed on safe-haven demand for gold.
📉 Technical Analysis:
• Key Resistance: ~$3,335–3,350 (recent highs and potential test zone)
• Nearest Support: ~$3,310 (previous stable support)
• EMA09 position: Price is above EMA9, indicating a mild bullish bias in the short term
• Momentum/Volume: RSI ~53 (neutral), MACD & StochRSI showing small buy signals. However, bullish momentum is fading, suggesting a possible mild pullback
📌 Conclusion:
Gold may dip modestly toward $3,310 if the dollar strengthens or if Fed rate-cut expectations recede. A break above $3,335–3,350 could pave the way for further gains, though current momentum remains insufficient to confirm a breakout.
💡 Suggested Trade Strategy:
SELL XAU/USD: $3,333–3,336
🎯 Take Profit: 40/80/200 pips
❌ Stop Loss: $3339
BUY XAU/USD: $3,310–3,308
🎯 Take Profit: 40/80/200 pips
❌ Stop Loss: $3305
Gold Drops After Failing to Hold Above $3322📊 Market Overview:
Gold initially surged above the $3322 resistance, hitting $3329 amid Fed pause expectations. However, a rebound in the US dollar and profit-taking triggered a sharp drop back to $3315, signaling weakening bullish momentum.
📉 Technical Analysis:
• Key resistance: $3322 – $3330
• Nearest support: $3308 – $3300
• EMA09 (H1): Price has fallen below EMA09 → turning short-term trend bearish
• Candlestick / Volume / Momentum:
• Failed breakout above $3322 with strong bearish H1 reversal
• Increasing volume during the drop → rising selling pressure
📌 Outlook:
Gold may continue declining in the short term if it fails to hold above $3312. Bears have taken control after the failed breakout attempt. Risk increases for a move toward $3300–$3295.
💡 Suggested Trade Setup:
🔻 SELL XAU/USD : $3318 – $3321
🎯 TP: 40/80/200 pips
❌ SL: $3325
🔺 BUY XAU/USD: $3295 – $3292 (only with clear bullish signal)
🎯 TP: 40/80/200 pips
❌ SL: $3288

Gold Recovers After Sharp Drop – Trend Not Yet Reversed📊 Market Overview:
Gold rebounded from a sharp fall earlier in the session, rising from $3301 to around $3315 as the U.S. dollar weakened slightly and sellers took partial profit. However, no strong fundamental catalyst confirms a trend reversal yet.
________________________________________
📉 Technical Analysis:
• Key Resistance: $3315 – $3322
• Nearest Support: $3300 – $3295
• EMA 09 (H1): Price is currently just below EMA09, indicating a slight bearish bias
• Candlestick / Volume / Momentum:
• H1 candle shows a long lower wick at $3301 → some buying interest
• No H1 candle has closed above $3315 yet → no confirmed reversal
• Volume remains weak, RSI still under 50 → limited bullish momentum
________________________________________
📌 Outlook:
Gold may continue to consolidate between $3300 and $3315 in the short term. If it fails to close above $3315, bearish pressure could return toward $3295–$3288.
________________________________________
💡 Suggested Trade Setups:
🔻 SELL XAU/USD: $3315 – $3318
🎯 TP: 40/80/200 pips
❌ SL: $3323
🔺 BUY XAU/USD: $3295 – $3300
🎯 TP: 40/80/200 pips
❌ SL: $3285
"XAU/USD Gold Heist Plan | Pullback Entry for Big Bullish Move"🔐💰“GOLD HEIST PLAN UNLOCKED: Thief Trader’s XAU/USD Breakout Blueprint”💰🔐
by The Market Robber a.k.a. Thief Trader – Stealing Pips, One Candle at a Time!
🌍 Hey Money Makers, Market Hustlers, Robbers, & Chart Crackers! 🌍
Bonjour! Hola! Marhaba! Hallo! Ola! What's poppin'?
Welcome to another exclusive robbery plan crafted in pure Thief Trading style—built off technicals, fundamentals, market psychology, and a bit of outlaw intuition. 💸⚔️
This one’s for the GOLD DIGGERS – literally. We’re targeting XAU/USD for a high-voltage bullish heist 🎯💥. Stick to the plan, follow the chart, and you might just make it out with a sack full of pips 💰🔥.
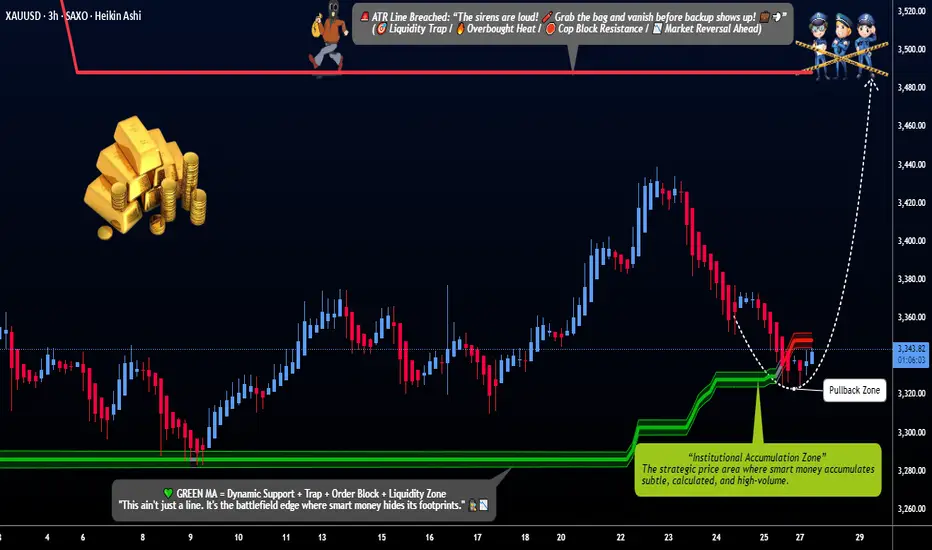
🔓 THE SETUP: GET READY TO ROB THE GOLD MARKET
We're eyeing a LONG ENTRY, with clear intent to break past the consolidation zone and avoid the trap laid by the "market police" at the ATR barricade zone 🚨. This level is where overbought drama and bear claws are strongest – we slip in, grab the profits, and bounce before they know what hit ‘em.
🧠 Use caution: This level is filled with liquidity traps, reversals, fakeouts and retail bait zones. Classic Thief style means we know where the guards are sleeping and where the cameras don't reach. 🎥🔕
💸 ENTRY PLAN:
🟢 Entry Zone: Watch for a pullback to 3320.00 or above. Don’t jump early.
💡 Tactics:
Use Buy Limit Orders (DCA / Layered Entry Style)
Drop them in on 15min/30min swing levels – catch price slipping into liquidity
Confirm with minor structure breaks / order block retests
🔔 Set those alerts – the real move happens when the breakout candle hits.
🛑 STOP LOSS STRATEGY:
🧠 Pro Rule: No stop-loss before breakout.
Once breakout confirms:
🔴 SL Zone: Recent swing low (approx. 3280.00) on the 4H chart
🎯 Adjust SL based on:
Lot size
Order count
Risk appetite
You know the game: manage your risk like a pro thief—quiet, calculated, and fast on the getaway. 💨
🎯 TARGET ZONE:
🏁 TP Zone: 3490.00
⚠️ Escape earlier if the pressure gets heavy – smart thieves never overstay the job.
🧲 SCALP MODE:
Only scalp LONG SIDE – don’t get caught chasing shorts unless you're rich enough to burn your drawdown 🔥
🔐 Use trailing SL to secure bags while climbing the ladder.
🧠 FUNDAMENTALS & MACRO EDGE:
The Gold market is currently in a BEAR structure with hints of bullish reversal potential. This heist isn’t just technical – it’s backed by:
🌍 Global Macro Flows
💼 COT Reports
📰 Sentiment & News Risk
💣 Geo-political Heat
📊 Intermarket Analysis (Dollar, Yields, Risk-On/Off correlations)
Dig deep for the full macro breakdown. Knowledge is leverage.
(Find full reports on reputable sources — you know where to look 👀)
🚨 RISK ALERT:
Before, During & After News Releases:
Avoid fresh entries 🔕
Use Trailing SLs to protect live trades
Watch spread spikes & low-liquidity traps
👉 Don't trade when the market's drunk.
💖 SHOW LOVE – BOOST THE PLAN:
💥Smash that Boost Button💥 if you want more precision heist strategies like this. Support the Thief Trading Style, and we’ll keep robbing the markets clean and teaching the crew how to get in & get out profit-heavy. 🏴☠️📈💰
🎭 I’ll be back with another chart crime scene soon. Until then, stay sneaky, stay profitable, and always move like the market’s watching (because it is). 😎
🔐 Thief Trader Out. Rob. Exit. Repeat. 🔁💸
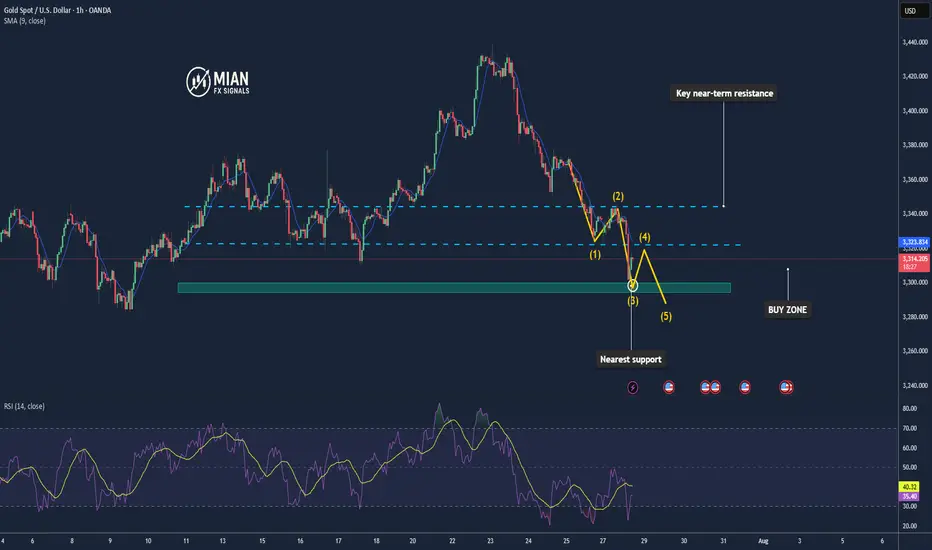
Gold short-term rise waiting for breakthrough
💡Message Strategy
During the Asian trading session, gold prices rebounded slightly from $3,320, filling the short gap at the start of the new week. As investors chose to stay on the sidelines before the Fed's two-day monetary policy meeting, the bullish force of the US dollar temporarily weakened, providing support for gold, an interest-free asset.
However, with the 15% tariff agreement between the United States and Europe and the positive progress of trade easing between the United States, Japan and the United States, market risk appetite has rebounded, weakening the appeal of gold as a safe-haven asset.
According to market surveys, "The current optimistic atmosphere of trade has weakened the safe-haven demand for gold, while the weakening of the US dollar has provided support for gold prices. The two forces offset each other, causing gold to fluctuate."
Investors are focusing on the FOMC meeting to be held on Tuesday. Although Trump continues to pressure the Fed to cut interest rates, the market generally expects that the interest rate will remain unchanged at this meeting because the US labor market remains strong.
In addition to the interest rate decision, this week will also usher in the US second quarter GDP estimate, PCE price index and non-farm payrolls report, all of which may have a significant impact on gold.
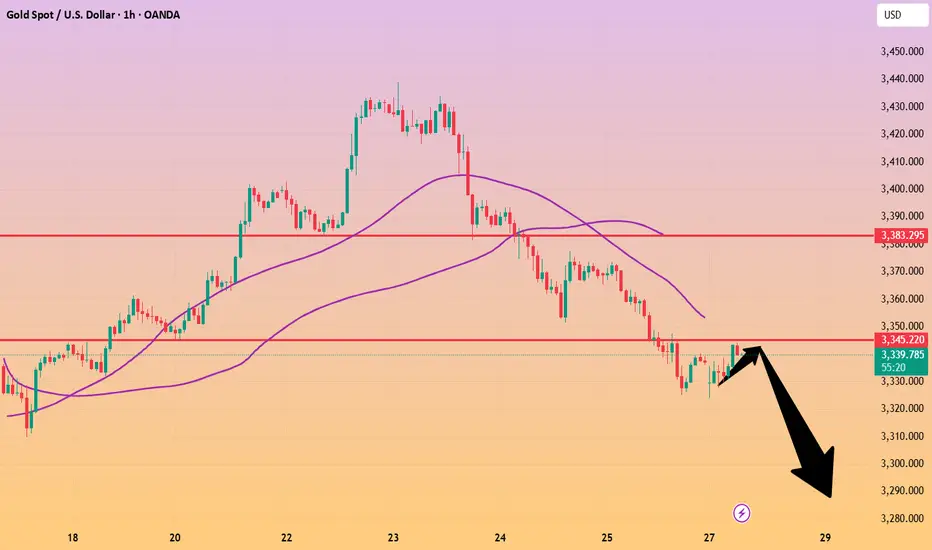
📊Technical aspects
From the technical trend, gold triggered a rapid correction after breaking below the lower edge of the short-term rising channel and the 50% Fibonacci retracement level last week. The current gold price stabilized in the $3,320 area and received some buying at the 61.8% Fibonacci support.
However, it is worth noting that the 200-period moving average on the 4-hour chart is at $3,350, which constitutes an important technical resistance for a short-term rebound. On the contrary, if gold breaks through the $3,350 level, gold will continue to develop a bullish pattern.
From the technical trend, gold triggered a rapid correction after falling below the lower edge of the short-term rising channel and the 50% Fibonacci retracement level last week. The current gold price stabilized in the $3,320 area and received some buying at the 61.8% Fibonacci support.
However, it is worth noting that the 200-period moving average on the 4-hour chart is at $3,350, which constitutes an important technical resistance for a short-term rebound.
On the contrary, if gold breaks through the $3,350 line, it will be expected to attack the $3,371-3,373 area in the short term, and further look to the key pressure levels of $3,400 and $3,440.
💰Strategy Package
Long Position:3320-3325,SL:3300,Target: 3350
Analysis of technical prospects for gold prices!Market news:
In the early Asian session on Monday (July 28), spot gold bottomed out and rebounded. At the beginning of the session, it continued the decline of last Friday to around 3320. As the United States and Europe reached a trade agreement, the international demand for gold hedging further declined. However, the price of gold was supported by bargain hunting and quickly recovered most of the decline. It is currently trading around 3337 US dollars per ounce. As the global reserve currency, the trend of the US dollar is crucial to the price of gold. Last week, the US dollar index rebounded from a low of more than two weeks, significantly pushing up the cost of gold for overseas buyers. The progress of US-EU trade negotiations has become another major driver of the recent decline in London gold prices. Although the demand for hedging has been suppressed in the short term, geopolitical uncertainty still provides long-term support for gold. At the same time, the trend of global central banks buying gold provides a solid bottom support for gold.Looking ahead to this week, the economic calendar will provide several high-impact data releases. The Federal Reserve will announce its monetary policy decision after the policy meeting on July 29-30. On Friday, the US Bureau of Labor Statistics will release the July employment report. If the number of non-farm payrolls (NFP) increases by more than 100,000, it may indicate that the labor market is in good enough condition that the Fed can prioritize controlling inflation and supporting the dollar when making policies. If the new non-farm payrolls data reaches or falls below 70,000, the dollar may find it difficult to find demand before the end of next week and help gold gain bullish momentum.
Technical analysis:
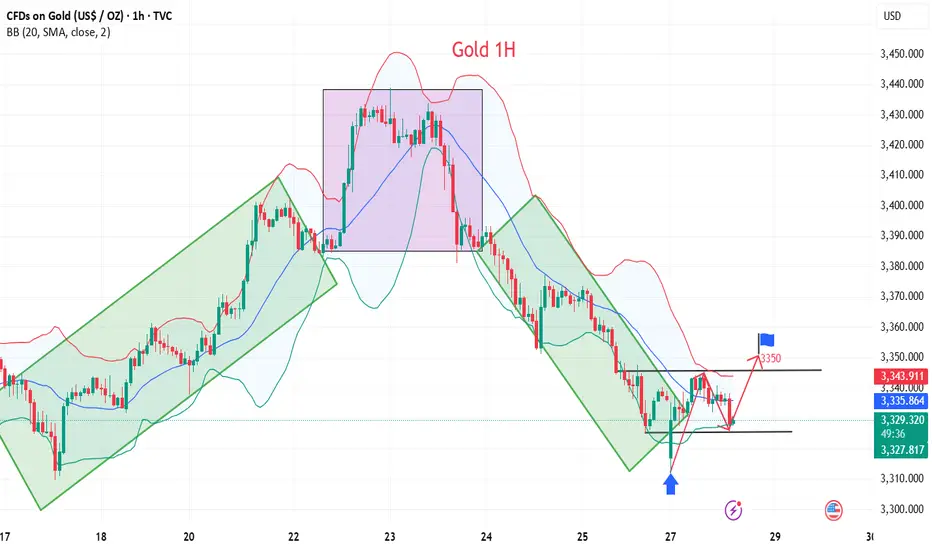
Technically, the gold daily chart forms a continuous negative structure, and the New York closing price re-loses the key support of the MA10-day moving average at 3360 and the middle track of the Bollinger Band. The RSI indicator breaks through the middle axis and runs in a short-term ... Pay attention to the rebound repair after selling low opening at the beginning of the gold week. The main idea is to sell at a high price and buy at a low price as an auxiliary.
Today's analysis:
Gold rebounded after opening low in the Asian session. Gold continued to refresh the low point. Then gold was obviously still in a selling trend. Since gold is still in a selling trend, it will continue to sell to the end. Gold rebounded in the Asian session and continued to sell. Gold continued to sell under pressure in the Asian session. Gold waited patiently for 3350 to continue selling in the Asian session. Gold's 1-hour moving average continued to cross downward and arranged for selling. There was basically no obvious rebound in this round of gold's decline. Then gold was likely to continue the short selling trend after the rebound correction. The wave structure of gold's current decline remained intact. Gold continued to sell under pressure near the last low of 3350.
Operation ideas:
Buy short-term gold at 3309-3312, stop loss at 3300, target at 3340-3360;
Sell short-term gold at 3350-3353, stop loss at 3362, target at 3320-3300;
Key points:
First support level: 3320, second support level: 3306, third support level: 3292
First resistance level: 3346, second resistance level: 3358, third resistance level: 3467
XAU/USD(20250728) Today's AnalysisMarket news:
Trump announced that the US and Europe reached a trade agreement: 15% tariffs on the EU, $600 billion in investment in the US, zero tariffs on the US by EU countries, the EU will purchase US military equipment, and will purchase US energy products worth $750 billion. However, the US and Europe have different statements on whether the 15% tariff agreement covers medicines and steel and aluminum. Von der Leyen: The 15% tariff rate is the best result that the European Commission can achieve.
US Secretary of Commerce: The deadline for tariff increases on August 1 will not be extended. The United States will determine the tariff policy on chips within two weeks.
Technical analysis:
Today's buying and selling boundaries:
3345
Support and resistance levels:
3393
3375
3363
3326
3315
3297
Trading strategy:
If the price breaks through 3345, consider buying in, the first target price is 3363
If the price breaks through 3326, consider selling in, the first target price is 3315

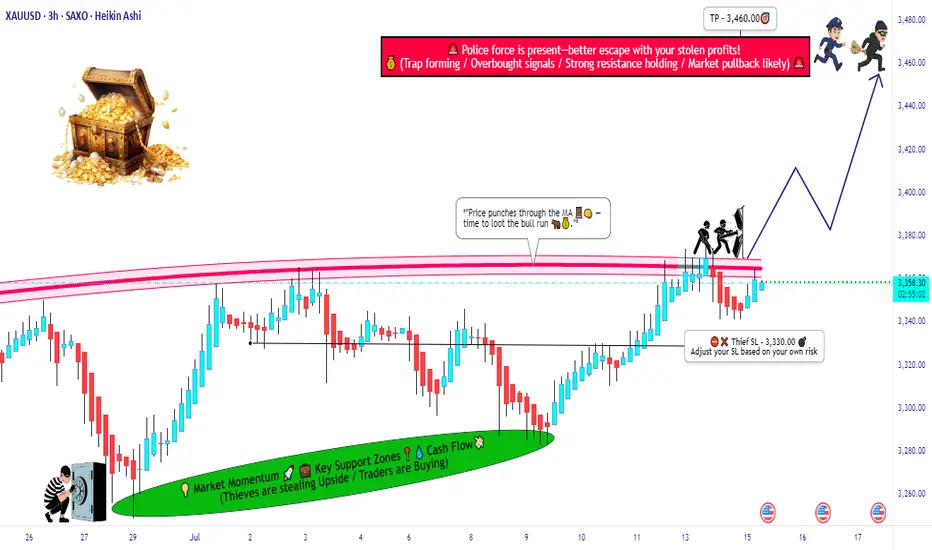
GOLD (XAU/USD) MA Breakout – High-Probability Long Setup!💰🚨 GOLD HEIST ALERT! XAU/USD MASTER PLAN (Thief Trading Style) 🎯
🔥 Steal Pips Like a Pro – High-Probability Gold Breakout Strategy! 🔥
🎯 Thief Trading’s GOLD Heist Strategy (Swing/Day Trade) �💸
👋 Hey there, Market Pirates & Profit Snatchers! 🌍✨
Based on our 🔥Thief Trading Style🔥 analysis, we’re plotting a major heist on XAU/USD (GOLD). The plan? Buy the breakout, escape before the cops (resistance) arrive! 🚔💨
📈 ENTRY ZONE: The Heist Begins!
🚀 "Wait for the MA Breakout (3400) – Then Strike!"
Bullish Confirmation: Enter on a 15M/30M pullback after MA breakout.
Thief’s Trick: Use Buy Stop above MA or Buy Limit near swing lows for best risk-reward.
DCA/Layering Strategy: Deploy multiple limit orders to maximize gains.
🔔 Set an ALERT! Don’t miss the breakout – thieves move fast! ⏳
🛑 STOP LOSS: Protect Your Loot!
📍 Thief’s SL Placement: 3330.00 (4H Swing Low) – Adjust based on your risk & lot size.
⚠️ WARNING: If using Buy Stop, DO NOT set SL until after breakout – unless you love unnecessary losses! 🔥
🎯 TARGET: Escape with the Gold!
🏴☠️ Take Profit Zone: 3460.00 (or Exit Early if Bears Show Up!)
Scalpers: Only trade LONG side – use trailing SL to lock in profits.
Swing Traders: Ride the wave but watch for resistance traps!
📰 MARKET CONTEXT: Why This Heist?
Neutral Trend (But Bullish Potential! 🐂)
Key Factors: Geopolitics, COT Data, Macro Trends, Sentiment Shift
🚨 News Alert: Avoid new trades during high-impact news – trailing SL saves profits!
💥 BOOST THIS HEIST! (Like & Share for More Pips!)
💖 Hit the 👍 Boost Button to strengthen our Thief Trading Crew!
🚀 More Heist Plans Coming Soon – Stay Tuned!
⚠️ DISCLAIMER (Stay Safe, Thieves!)
This is NOT financial advice. Do your own analysis & manage risk.
Markets change fast! Adapt or get caught.
🎯 Happy Trading, Pirates! Let’s Steal Some Gold! 🏴☠️💛
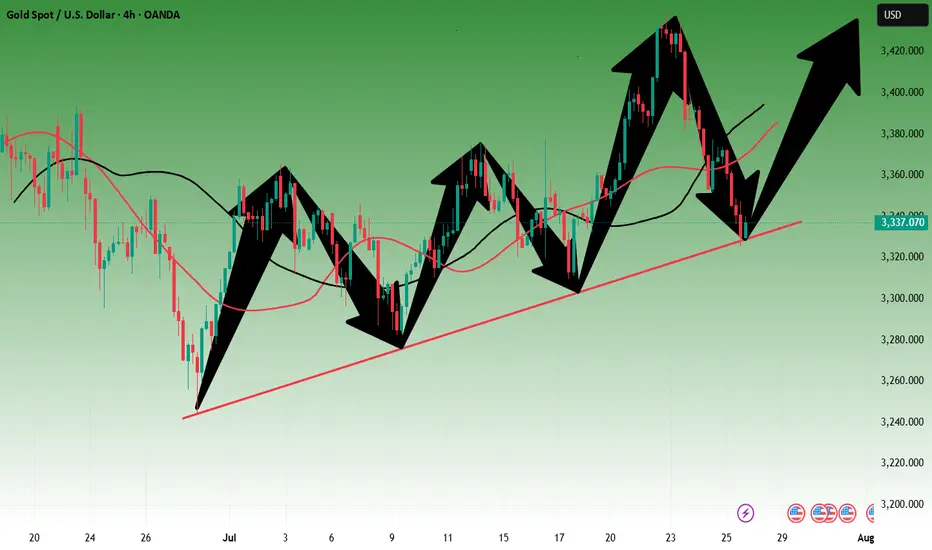
Analysis of gold price trend next week!Market news:
This week, international gold recorded its biggest weekly decline in a month. Spot gold turned sharply lower after a sharp rise and finally closed lower. Signs of progress in US-EU trade negotiations hit the safe-haven demand for London gold prices. Geopolitical situation is also a factor in the downward trend of gold prices. On the 25th local time, Tahir Noonu, a senior Hamas official, said that Hamas was absolutely positive about the efforts of the relevant mediators, but was surprised by the US statement. Before the United States and the European Union made progress in trade negotiations, fund managers raised their bullish bets on gold to the highest level since April this year. The trade war has pushed gold prices up 27% this year. Although the easing of trade tensions will weaken safe-haven demand, gold has also been supported by strong buying from central banks.Next week, international gold prices will focus on US-EU and US-China trade negotiations. If the negotiations are optimistic, gold prices may continue to test the $3,300/ounce mark; in addition, focus on the Federal Reserve's resolution. After Trump's visit to the Federal Reserve headquarters, whether the Federal Reserve will maintain its independence will be highlighted in this resolution. Non-agricultural data will also be released on Friday, which needs attention.
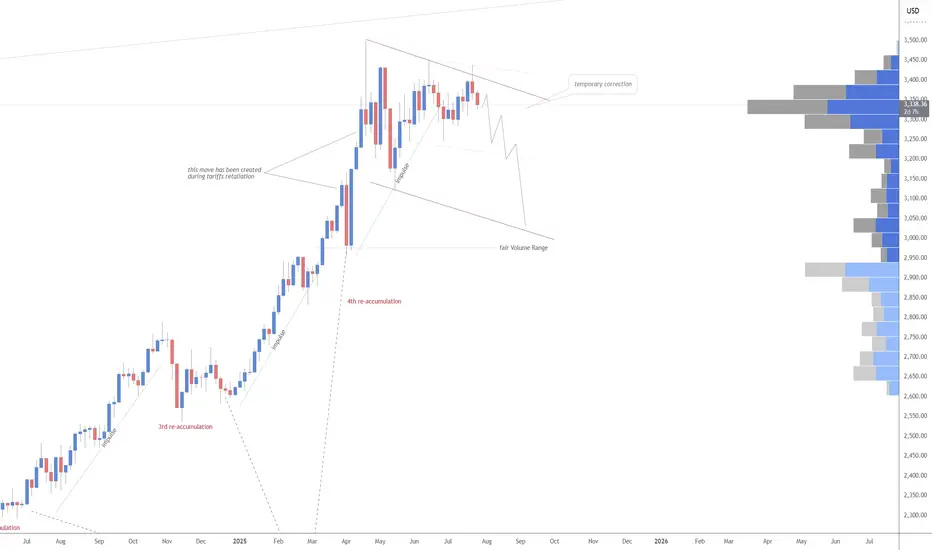
Technical Review:
From the weekly gold level, gold is still in a wide range of 3500-3120. It has been fluctuating for ten weeks. The Bollinger Bands are gradually shrinking. MA5 and MA10 are running horizontally, indicating that gold fluctuations will continue. This time, gold stabilized and rose from 3247 to 3438 and then fell back. The current short-term range is 3247-3438! Next week, pay attention to the range of fluctuations and choose a new direction after the narrowing. The daily level is currently in the 4th wave adjustment. There is a high probability that there will be a 5th wave rise after the adjustment, and then a large-scale ABC adjustment will be started. At present, there are two changes in the structure of the 4th wave, one is the triangle contraction and the other is the ABC structure. No matter how it runs, the market outlook is to wait for low-level long positions to see the 5th wave rise. In the short term, gold is still oscillating and selling.
Next week's analysis:
Gold is still adjusting, but it has basically adjusted in place. The current daily price has also adjusted to the key support level of 3300. Similarly, the four-hour chart just stepped back to the upward trend line support, which is the short-term long order entry. Buy above the 3300 mark next week! Next week, gold is expected to further test the 3310-3280 support level. Gold at the 4-hour level peaked at 3438 and then fell back. It has now formed a unilateral trend. The K-line is under pressure from the 5-day moving average and continues to set new lows, and breaks the short-term upward trend line. The Bollinger band opens downward and diverges, and the MACD water cross diverges downward to underwater, indicating that the current gold trend is in an absolute weak position! Next, gold will continue to test the support near the previous low of 3300. If 3300 is not broken, gold buying will continue to have momentum. If 3300 is broken, the short-term rise will end, and the subsequent rebound will basically be just a correction. However, the current 4-hour green column shows signs of shrinking volume, so it is not easy to sell at a low level. Try to sell after the rebound correction, or buy at a low level!
Operation ideas:
Short-term gold 3305-3308 buy, stop loss 3297, target 3350-3370;
Short-term gold 3350-3353 sell, stop loss 3362, target 3320-3300;
Key points:
First support level: 3320, second support level: 3309, third support level: 3300
First resistance level: 3346, second resistance level: 3360, third resistance level: 3375
XAU/USD 25 July 2025 Intraday AnalysisH4 Analysis:
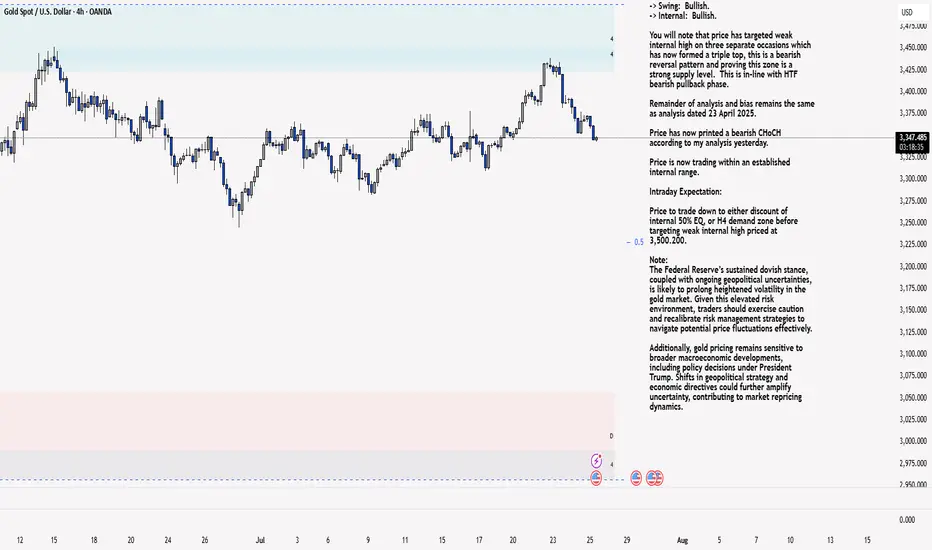
-> Swing: Bullish.
-> Internal: Bullish.
You will note that price has targeted weak internal high on three separate occasions which has now formed a triple top, this is a bearish reversal pattern and proving this zone is a strong supply level. This is in-line with HTF bearish pullback phase.
Remainder of analysis and bias remains the same as analysis dated 23 April 2025.
Price has now printed a bearish CHoCH according to my analysis yesterday.
Price is now trading within an established internal range.
Intraday Expectation:
Price to trade down to either discount of internal 50% EQ, or H4 demand zone before targeting weak internal high priced at 3,500.200.
Note:
The Federal Reserve’s sustained dovish stance, coupled with ongoing geopolitical uncertainties, is likely to prolong heightened volatility in the gold market. Given this elevated risk environment, traders should exercise caution and recalibrate risk management strategies to navigate potential price fluctuations effectively.
Additionally, gold pricing remains sensitive to broader macroeconomic developments, including policy decisions under President Trump. Shifts in geopolitical strategy and economic directives could further amplify uncertainty, contributing to market repricing dynamics.
H4 Chart:
M15 Analysis:
-> Swing: Bullish.
-> Internal: Bullish.
H4 Timeframe - Price has failed to target weak internal high, therefore, it would not be unrealistic if price printed a bearish iBOS.
The remainder of my analysis shall remain the same as analysis dated 13 June 2025, apart from target price.
As per my analysis dated 22 May 2025 whereby I mentioned price can be seen to be reacting at discount of 50% EQ on H4 timeframe, therefore, it is a viable alternative that price could potentially print a bullish iBOS on M15 timeframe despite internal structure being bearish.
Price has printed a bullish iBOS followed by a bearish CHoCH, which indicates, but does not confirm, bearish pullback phase initiation. I will however continue to monitor, with respect to depth of pullback.
Intraday Expectation:
Price to continue bearish, react at either M15 supply zone, or discount of 50% internal EQ before targeting weak internal high priced at 3,451.375.
Note:
Gold remains highly volatile amid the Federal Reserve's continued dovish stance, persistent and escalating geopolitical uncertainties. Traders should implement robust risk management strategies and remain vigilant, as price swings may become more pronounced in this elevated volatility environment.
Additionally, President Trump’s recent tariff announcements are expected to further amplify market turbulence, potentially triggering sharp price fluctuations and whipsaws.
M15 Chart:
Gold Bounces Back After Testing Key Support📊 Market Drivers
• Gold dropped to around $3,352, touching a key support zone, then quickly rebounded to $3,373, gaining over +20 points.
• The rebound is supported by continued weakness in the US Dollar and slight easing in Treasury yields, keeping gold attractive as a safe haven.
• Although some optimism around US-Japan trade negotiations slightly reduced risk aversion, it wasn’t enough to push gold below support.
📉 Technical Analysis
• Key Resistance:
o $3,397 – $3,400: psychological resistance and near the next bullish breakout zone.
o If breached, next target lies around $3,420–3,445.
• Nearest Support:
o $3,356 – $3,364: recently confirmed support zone that triggered the current rebound.
o Deeper support at $3,326 – $3,320 if the rebound fails.
• EMA (EMA50):
o Price remains above the 50-period EMA, indicating bullish momentum in the short term.
• Patterns & Momentum:
o Market structure shows a "rising low" pattern — a bullish signal that buyers are stepping in at higher levels.
o RSI was briefly in oversold territory and now supports a recovery bounce.
o If $3,356 holds, the upside targets remain valid toward $3,397 → $3,439.
📌 Assessment
• Gold has confirmed strong support at $3,356–3,364, with the rebound from $3,352 as proof.
• Short-term uptrend remains intact, unless the USD strengthens sharply or unexpected macro news hits.
• If gold breaks below $3,356, it may retrace toward $3,326–3,320, but the upside potential is currently favored.
💡 Suggested Trade Setups
BUY XAU/USD: $3,356–3,364
🎯 Take Profit: 40/80/200 pips
❌ Stop Loss: $3,346
SELL XAU/USD: $3,397–3,400
🎯 Take Profit: 40/80/200 pips
❌ Stop Loss: $3,407
XAU/USD(20250725) Today's AnalysisMarket news:
The European Central Bank announced that it would maintain the three key interest rates unchanged, reiterated data dependence, warned that the external environment is highly uncertain, and President Lagarde did not rule out the possibility of future rate hikes. Traders reduced their bets on ECB rate cuts.
Technical analysis:
Today's buying and selling boundaries:
3370
Support and resistance levels
3412
3397
3386
3355
3344
3329
Trading strategy:
If the price breaks through 3370, consider buying in, with the first target price of 3386
If the price breaks through 3355, consider selling in, with the first target price of 3344
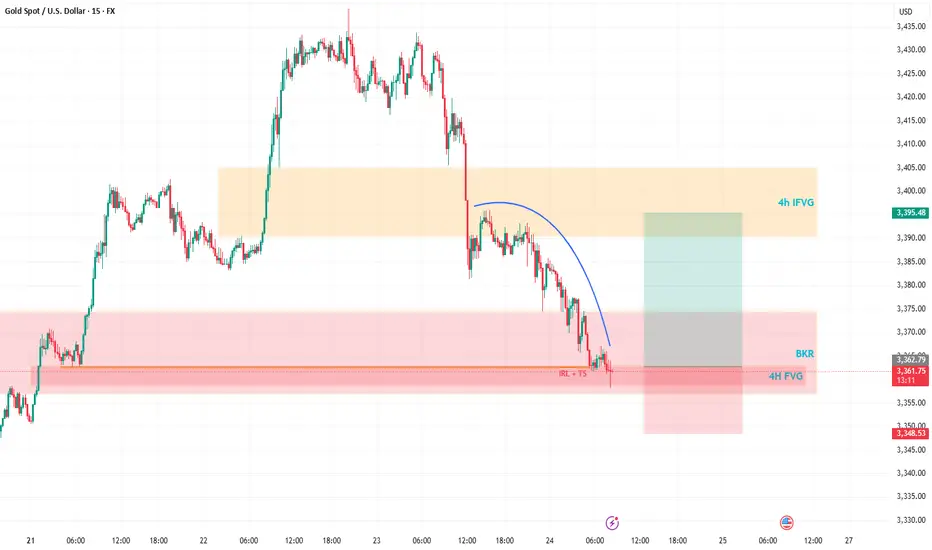
Gold’s Wild Ride: A Trader’s Take on What’s NextHey Fellow Traders! 👋
Gold’s been an absolute beast this week, smashing through both buyers and sellers like it’s playing a high-stakes game of market whack-a-mole! 😅 After Wednesday’s wild moves and today’s follow-up, Gold’s keeping us all guessing.
Right now, I’m not locking in a long-term bias—Gold’s too unpredictable for that. But here’s the exciting part: I’m eyeing a short-term long opportunity. Why? The price just dipped into a 4H Fair Value Gap (FVG) and tagged a Breaker, setting up a potential bounce. 📈
My plan? I’m expecting Gold to sweep up the highlighted liquidity and charge toward the 4H Inversion Fair Value Gap (IFVG). Once it hits that zone, I’ll be glued to the charts, watching for its reaction to decide the next move. 🧐
As always, trade smart! Set your stops, size your positions wisely, and don’t let Gold’s volatility catch you off guard. Protect your capital first—always! 💡
What’s your take on Gold right now? Are you jumping on this setup or waiting for more confirmation? Drop your thoughts in the comments below, give this post a like, and follow for more updates! 👇 Let’s keep the trading convo going! 🔥
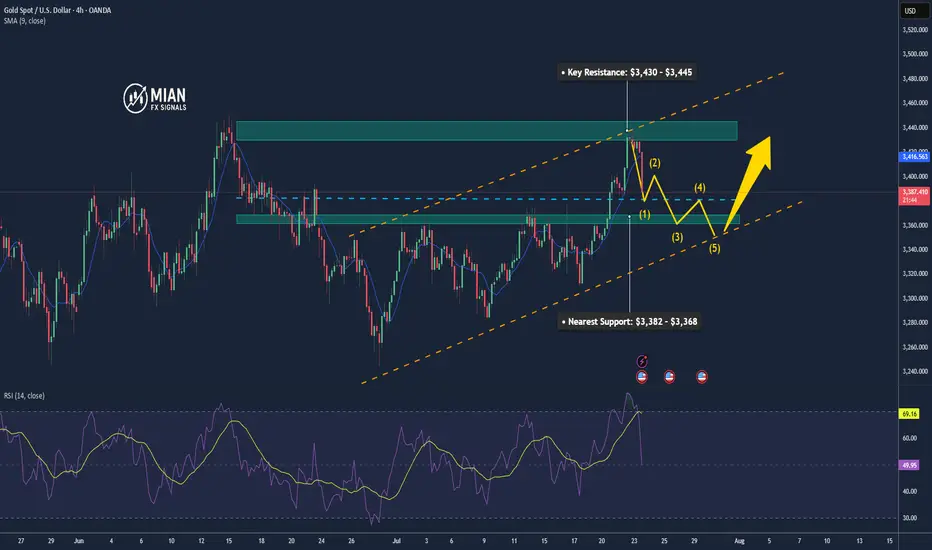
Gold Pulls Back to Support Zone📊 Market Overview:
• Gold price fell sharply to $3,385/oz, after previously testing the $3,430 zone.
• Short-term profit-taking and anticipation of upcoming U.S. economic data (PMI, durable goods orders) caused a mild USD rebound, pressuring gold lower.
• Overall sentiment remains cautious as the Fed has yet to clearly signal a rate cut path.
📉 Technical Analysis:
• Key Resistance: $3,430 – $3,445
• Nearest Support: $3,382 – $3,368
• EMA 09: Price just broke below the 9 EMA, suggesting a potential deeper correction unless it rebounds quickly.
• Candlestick/Volume/Momentum: Bearish engulfing candle with rising volume – indicates strong selling pressure and momentum currently favoring the bears.
📌 Outlook:
Gold is undergoing a short-term correction, currently testing the strong technical support zone at $3,382 – $3,385. If this zone holds, we may see a rebound toward $3,410 – $3,420. If it fails, gold could slide further toward $3,368 – $3,350.
💡 Suggested Trade Strategies:
🔻 SELL XAU/USD at: 3,395 – 3,400
🎯 TP: 3,375
❌ SL: 3,405
Gold------sell near 3392, target 3370-3350Gold market analysis:
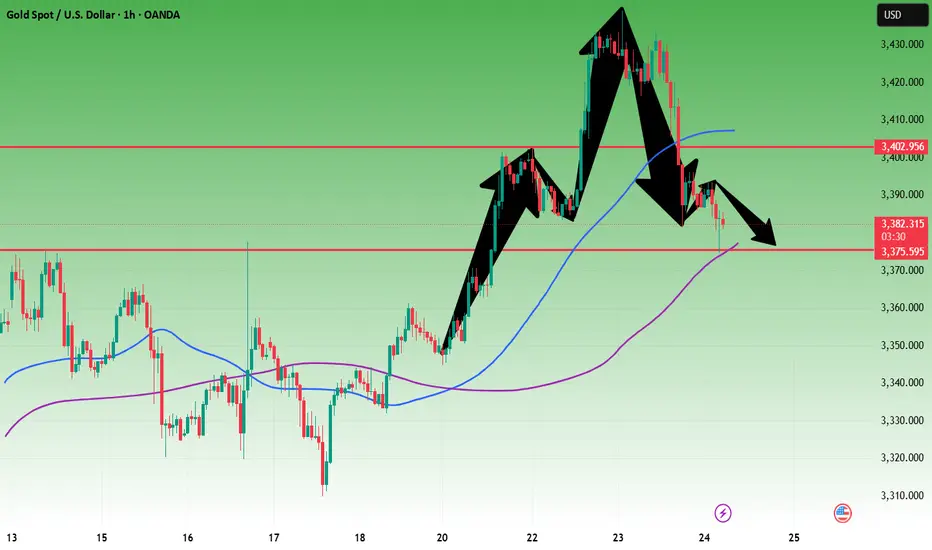
Yesterday, gold in the European and American markets plunged directly. It is cold at high places. Gold has already experienced four big plunges above 3435. From the perspective of form, there is a super pressure there. We also reminded in the analysis yesterday that the rhythm of gold daily lines in the past two days has changed very quickly, and it is all shocks and then quickly pulls up and ends directly. It is basically difficult to follow its rhythm without direct pursuit. The big negative line of the daily line has destroyed the strong support near 3402-3404. This position has been converted into a new strong pressure. Today's idea is to adjust the bearish trend and continue to sell on the rebound. The adjustment of the daily line is not sure whether it is an adjustment of the wave structure, but it can be determined to sell in the short term. We are just a trend follower. Today, gold will not rebound above 3402 and is basically weak.
Gold plunged directly in the Asian session, and the selling force is still relatively strong. At present, the new low strong support of the daily line has not appeared. The next moving average support of the daily line is around 3366. I estimate that there will be a rebound at this position. If the hourly Asian session does not fall and rebounds first, consider continuing to sell it at 3395 and 3402. Gold likes to convert quickly recently. If it stands on 3404, it will be reconsidered.
Support 3374, 3366 and 3350, suppress 3395 and 3402, and the weak watershed before the market is 3395.
Fundamental analysis:
Tariffs have not affected the market recently, and there is no major news released. The market is relatively calm.
Operation suggestion:
Gold------sell near 3392, target 3370-3350

Gold prices plunge in the short term!Market news:
In the early Asian session on Thursday (July 24), spot gold fluctuated in a narrow range and is currently trading around $3,388 per ounce. International gold suffered a fierce sell-off after a sharp rise in the previous two trading days. Media reports said that the United States and the European Union were getting closer to reaching a tariff agreement, and the news hit safe-haven demand. The decline in London gold prices was mainly due to the dual pressure of easing macro-geopolitical tensions and the recovery of risk appetite.Although the Federal Reserve is expected to keep interest rates unchanged, the controversy surrounding the independence of the Federal Reserve is heating up. According to a recent Reuters survey, most economists believe that the Federal Reserve is currently facing unprecedented political pressure, which provides potential medium- and long-term support for gold. However, in the short term, as the resilience of US economic data emerges and market risk sentiment improves, investors are cautious about the Federal Reserve's expectations of a sharp interest rate cut this year, and gold has lost the momentum to further attack.The current market focuses on the progress of trade negotiations between major economies in the world and the upcoming Federal Reserve interest rate meeting. Against the backdrop of the implementation of the US-EU and US-Japan agreements, the short-term safe-haven properties of gold may continue to weaken. In addition, this trading day will usher in the July PMI data of European and American countries, the change in the number of initial jobless claims in the United States, the annualized total number of new home sales in the United States in June, and the interest rate decision of the European Central Bank!
Technical Review:
Affected by Trump's speech, the United States reached an agreement with more trading partners, and the market risk aversion cooled down. Gold plunged sharply to a new low of 3381 in the late trading. The technical daily structure closed with a single negative line, ending the strong form of the continuous positive structure. However, the daily MA10/7-day moving average still maintained a golden cross opening upward, moving up to 3378/67. The price is currently adjusted at the 5-day moving average of 3390, and the RSI indicator is running above the middle axis. The price is in the upper and middle track of the Bollinger band.
The short-term four-hour chart retreated to the middle track of the Bollinger band at 3380 and stopped falling, and the RSI indicator adjusted its middle axis. The moving average high at 3410 opened downward in a dead cross, and the short-term gold price fell into a wide range of shocks. Today's trading strategy is to sell at high prices and buy at low prices. The strategy layout is based on fluctuations. Let's look at the 3366/3416 range first.
Today's analysis:
Yesterday, gold fell straight in the European and American trading hours, with a drop of more than 50 US dollars. The main reason is the impact of European and American tariffs. Last night, the European and American trade negotiations determined a 15% tariff. The market's risk aversion sentiment subsided, causing the gold price to fall. The gold daily line finally closed with a big negative line, and the gold daily line was covered with dark clouds! The rebound during the day is mainly sold at high prices!The high level of the gold 1-hour moving average has begun to turn around. The buying power of gold has obviously suffered a heavy blow under the influence of the news. The short-term high level of gold 1 has also formed a head and shoulders top structure. As long as the gold rebound does not break through 3400, the right shoulder of gold will be completed. Then gold will complete the short-term top structure of the head and shoulders top in the short term, and gold selling will begin to work.
Operation ideas:
Short-term gold 3366-3369 buy, stop loss 3358, target 3390-3410;
Short-term gold 3400-3403 sell, stop loss 3412, target 3380-3360;
Key points:
First support level: 3380, second support level: 3367, third support level: 3353
First resistance level: 3403, second resistance level: 3410, third resistance level: 3420