Gold Likely to Rise as USD Weakens📊 Market Overview
Spot gold (XAU/USD) is trading around $3,423–$3,427/oz, down ~0.2% after news of a US–Japan trade deal boosted risk sentiment. However, a weaker USD and lower US bond yields continue to support safe-haven demand.
📉 Technical Analysis
• Resistance: $3,447 – $3,464 – $3,496
• Support: $3,399 – $3,367
• EMA9: Price is below EMA9 → short-term bearish; medium-term outlook remains bullish if price reclaims EMA20.
• Momentum indicators: RSI ~69; MACD & ADX favor buyers.
📌 Outlook
Gold may move sideways or edge higher if USD weakness persists. A rise in risk appetite (e.g. from trade deals) could pressure prices short term.
💡 Suggested Trading Strategy
🔻 SELL XAU/USD: $3,442–$3,445
🎯 TP: 40/80/200 pips | ❌ SL: $3,449
🔺 BUY XAU/USD: $3,402–$3,405
🎯 TP: 40/80/200 pips | ❌ SL: $3,399
Goldinvesting

XAUUSD: Fluctuation of $30/ounce. Do you want to know?Yesterday, I frantically notified followers to buy around 3366-3375, and the market finally rose to 3430. This is a huge profit. I will continue to update it in the Band Trading Center Research Institute later. If you don’t want to miss it, follow me. If you see it but are still not sure how to trade. Then you can leave me a message at the Swing Trading Center Research Institute. I will reply to you one by one when I see it.
This week, some followers have achieved weekly profits of 50%-268%. If your profit is not ideal. Or don’t know how to trade. Remember to like and follow. I will lead everyone to victory.
Buy around 3400-3410. When will it close? I will post the results on the Swing Trading Center. Stay tuned.
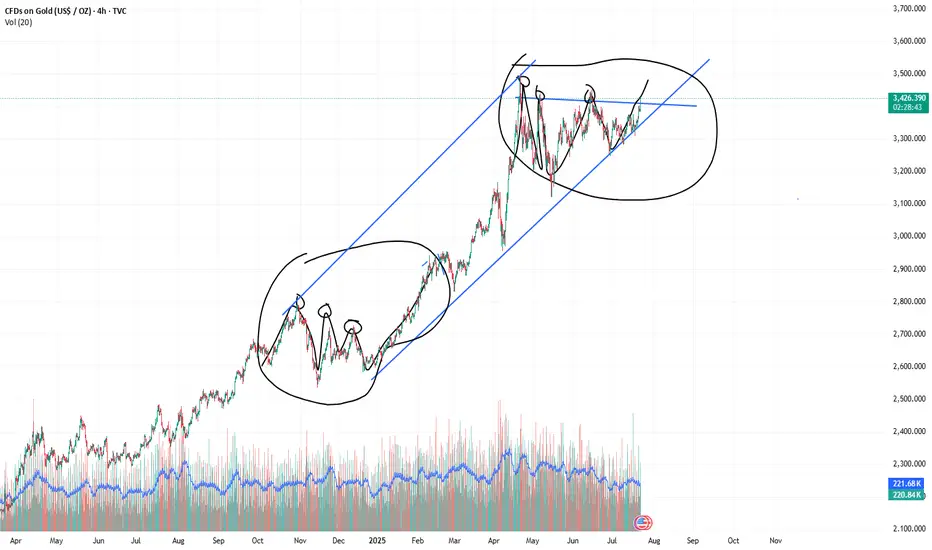
XAUUSD:3450-3500The probability of the same direction of the two histories is 95% similar. This shows one thing. The market may repeat history again.
So buy with me. The next target is 3450-3500
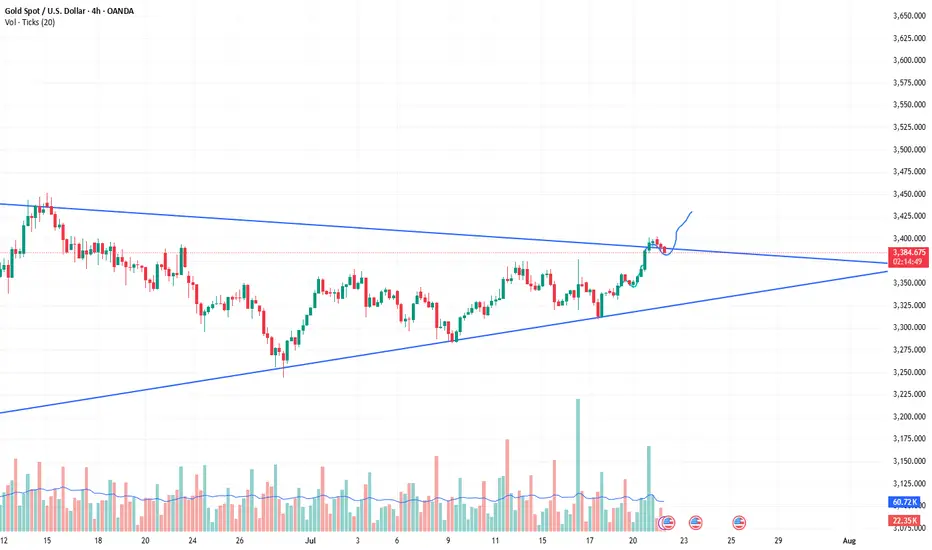
The bull market of xauusd continues, buy and wait for the rise.As predicted in the band trading center in advance over the weekend. The daily level trend is still very stable, and the breakthrough trend has been perfectly carried out. The current quotation is 3388. It is only a matter of time before it rises wildly to the position of 3430. The short-term will definitely break through. The current bull market is clear and has huge potential. The limit of the triangle consolidation phase is about to be broken. Then the bulls will continue to rise. Therefore, buying is the key operation plan.
XAUUSD:Retracement is a buying opportunityAfter the Asian market hit the highest position of 3403, there was some decline. The current gold price is 3386. From the short-term trend of the hourly level. It is still fluctuating at a high level. Combined with the trend of the daily level, there are signs of retracement and counterattack. There is no news dominance. It is purely a technical repair after hitting the high. This retracement can pay attention to the support near 3382-3378. The London and New York markets are still based on buying and profit.
Gold 3400, gold price returns strongly
💡Message Strategy
The Fed's monetary policy divergence has intensified. Fed Board member Waller advocates a 25 basis point rate cut in July, believing that tariff inflation is temporary; Board member Kugler insists on maintaining high interest rates to fight inflation; Chicago Fed member Goolsbee believes that the latest consumer price index data shows that tariffs have pushed up commodity inflation, and is "slightly concerned" about this, but then expounds on a different view, that is, interest rates are expected to fall sharply in the coming year. It implies that there may be a "substantial rate cut" in the next 12 months.
At present, the Fed has gradually begun to prepare for a rate cut. Whether this is the result of pressure from Trump or the Fed has gradually shown optimism about inflation and concerns about recession, a rate cut is imminent. At present, the market expects the probability of a rate cut in July to rise to 30%, and the probability of a rate cut in September to 54%.
In terms of tariffs, the countdown to August 1 tariffs: the United States plans to impose a 30% tariff on the EU/Mexico, and the EU has drawn up a retaliation list of $84.1 billion. The US Secretary of Commerce expressed confidence that an agreement can be reached with the EU, and small countries need to pay a 10% base tariff. Tariffs will be levied on August 1.
At present, Trump has a tough stance, requiring the minimum tariff of the European and American agreement to be set at 15%-20%, and the scope of exemptions is narrowed (only aviation, medical equipment, etc.). The deadline is approaching, and the market has also begun to start a risk-averse expectation mode.
📊Technical aspects
From the 1H cycle trend structure, gold is currently rebounding upward and breaking through the 4H level downward trend line. From the indicator point of view, the 1-hour level Ichimoku Kinko Hyo indicator breaking through the baseline on the turning line, the delay line stands firmly above the K line, the future cloud is an upward cloud, and the bullish signal is significant.
Gold is currently in the center of the rising channel cloud. Today, we can focus on the support brought by the lower boundary of the channel and try to go long.
Gold rose as expected, and the bulls began to remain strong. Once gold breaks through the upper pressure, it will continue to gain momentum, and gold bulls are expected to reach a higher level.
💰Strategy Package
Long Position:3370-3380,SL:3350,Target: 3420,3400
3400 is no longer the target for gold. The answer is: higher
After gold touched 3,400, most people expected gold to fall back. This kind of rigid thinking is often out of touch with reality. During the rise, do you think it is better to short at highs or to go long on pullbacks?
💡Message Strategy
This round of gold's upward movement is not accidental. Behind it are significant changes in macro fundamentals. First, the overall weakening of the US dollar. The recent decline of the US dollar index to below the 98 mark reflects the market's concerns about the outlook for the Fed's policy. At the same time, the 10-year US Treasury yield also fell below 2%, and the actual yield fell, strengthening the relative attractiveness of gold.
More worthy of vigilance are the political rumors surrounding the re-election of Fed Chairman Powell. According to the Wall Street Journal, US Treasury Secretary Bessent once advised the president to avoid removing Powell from office to maintain the reputation of the Fed. However, speculation about Powell's possible dismissal remains, although Trump himself publicly denied the relevant plan.
In addition, Europe's actions have also disturbed the market. According to Bloomberg, citing EU diplomatic sources, if no agreement is reached before August 1, the EU will impose retaliatory tariffs on US products worth US$72 billion, covering areas such as automobiles, aircraft, alcohol and digital services. These messages have formed a risk resonance environment of "political uncertainty + economic friction", providing a natural long hotbed for gold.
Although the US economic data is slightly mixed - consumer confidence has rebounded, but inflationary pressure continues, with CPI approaching 3% in June - this has made the market full of doubts about the Fed's monetary policy path. Especially in the case of sparse economic data this week (only new housing data, initial claims and durable goods orders), the market focus is on the impact of political and policy conflicts on market confidence.
📊Technical aspects
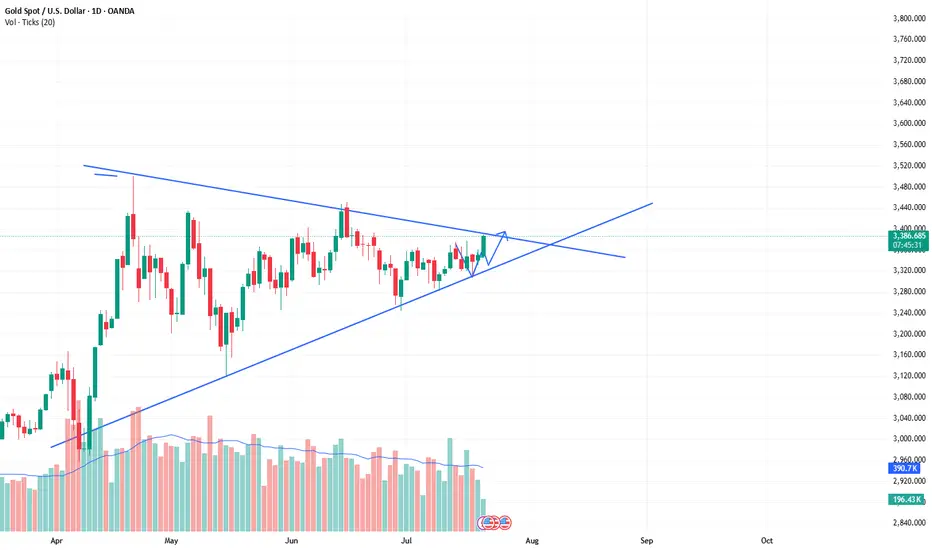
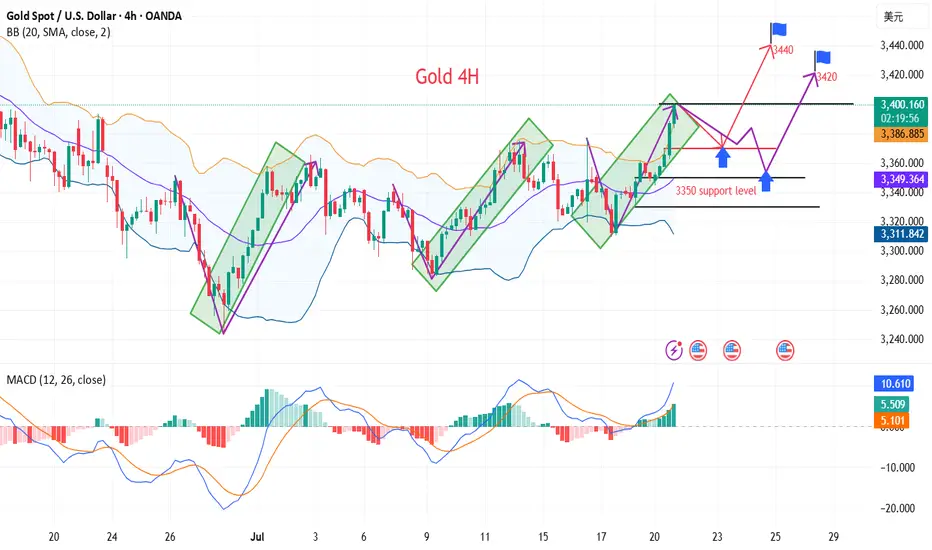
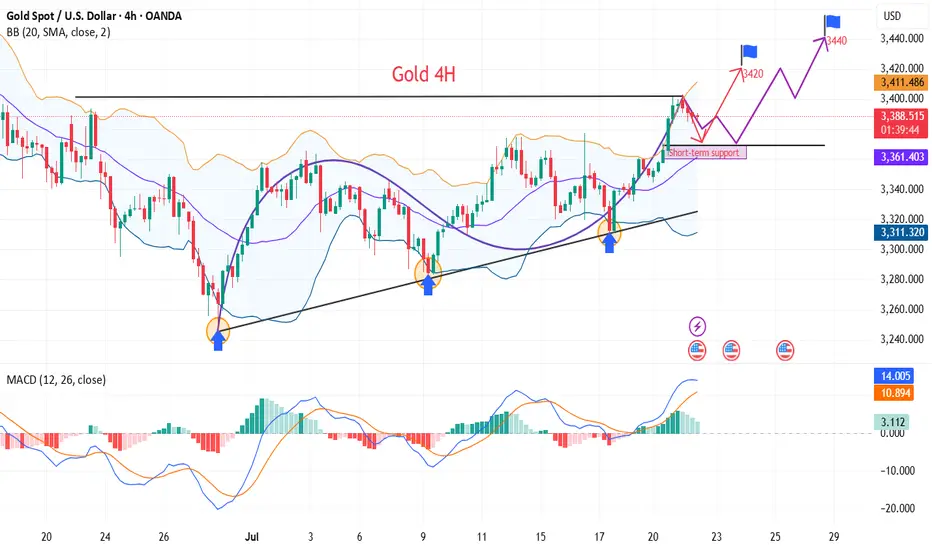
From the daily candlestick chart, gold has recently shown signs of breaking upward after five weeks of sideways fluctuations. In terms of MACD indicators, the MACD histogram has turned from green to red, and the fast and slow lines have formed a "golden cross", strengthening the expectation of a short-term technical rebound.
For gold's lower support, pay attention to last week's high of $3,380, which is also the current 4-hour MA10 moving average position. Secondly, pay attention to the multiple declines in gold prices in the European session on Monday to test the stabilization position of $3,370. For gold's upper pressure, pay attention to the intraday high of $3,402, which is also the high point of gold's rise on Monday. After the decline in June, gold prices rebounded several times to test resistance here and further strengthened. The upper space can pay attention to the high point of the past three months at $3,440.
The previous five weeks of consolidation showed that the market was waiting for directional signals, and this breakthrough of the 3,400 mark was achieved against the dual backdrop of a falling US dollar and rising political uncertainty in the United States, with the typical characteristics of "news trigger + technical confirmation".
If gold successfully stabilizes above 3400, the market will turn its attention to the two key resistance areas of 3451 and 3499, the year's high. Breaking through the former will open up space to test new historical highs upwards; combined with the current MACD golden cross pattern, if the capital side and fundamentals continue to cooperate, short-term accelerated rise cannot be ruled out.
💰Strategy Package
Long Position:3370-3380,SL:3350,Target: 3420,3440
Gold----Buy near 3374, target 3399-3420Gold market analysis:
Yesterday, Monday, gold rose strongly, reaching a high of around 3402. This range is still relatively rare at the beginning of the week. Let's not worry about whether it is caused by fundamentals. Judging from the market's morphological indicators, we can be very sure that it is a buying trend. Yesterday's buying has broken the 3377 position. The breaking position of this position has determined the new buying position. In addition, the daily moving average has also begun to diverge. The morphological support is around 3370 and 3374. Today, relying on this position, the moving average is bullish. Yesterday, it rose too much. I estimate that there will be a need for repair today. The retracement during the repair is our opportunity to get on the train again. On the weekly line, 3400 is a hurdle. The previous multiple stops were only short-lived, so we need to be cautious when buying above 3400.
There is a signal of closing negative in 4H. The Asian session needs to be adjusted and repaired. It is better to buy at a low price. 3402 is a small pressure. We cannot estimate where it will be repaired. We can determine the support below and buy near the support. There can also be short-term selling opportunities above 3400 in the Asian session. It is only in the Asian session, and the buy order is the main target.
Fundamental analysis:
There is no major news in the recent fundamentals. The situation in the Middle East is still relatively stable. There is no new rest in tariffs, and the impact on the market is limited.
Operation suggestion:
Gold----Buy near 3374, target 3399-3420

Gold Could Extend Rally if Breaks 3,400📊 Market Overview
Gold is currently trading around 3,400 USD/oz, up approximately +1.41% over the past 24 hours.
The upward momentum is supported by a weakening US Dollar following dovish-leaning remarks from the Fed, along with growing demand for safe-haven assets amid trade uncertainties.
📉 Technical Analysis
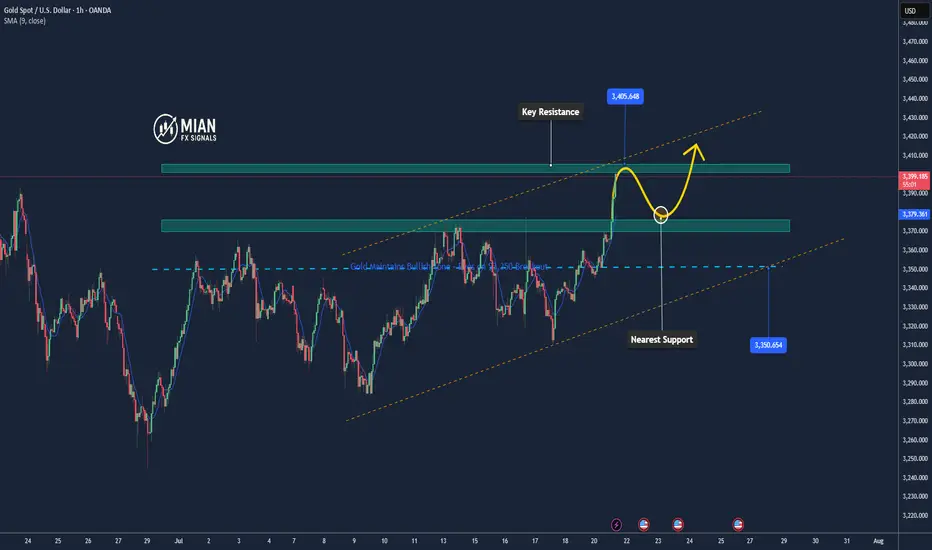
• Key Resistance: ~3,400–3,405 USD (psychological zone; a break above could open the path for further gains).
• Nearest Support: ~3,370–3,375 USD, followed by 3,345–3,350 USD, which marks today’s low.
• EMA 09/20: Price is currently trading above both EMA 9 and EMA 20, confirming a short-term uptrend.
• Momentum / Oscillators: RSI is in the overbought zone; MACD and ADX still show a “buy” signal → bullish trend continues, but watch for possible technical pullbacks.
📌 Opinion
The price may continue to rise if it breaks above the 3,400 USD/oz level, especially if the USD remains weak and safe-haven flows continue to support gold. However, if there’s short-term selling pressure or a USD rebound, gold may pull back toward the 3,370–3,375 USD support zone.
💡 Trade Setup
SELL XAU/USD at: 3,400–3,405 USD
🎯 TP: 3,380 USD
❌ SL: 3,410 USD
BUY XAU/USD at: 3,370–3,375 USD
🎯 TP: 3,390–3,395 USD
❌ SL: 3,360 USD
In-depth analysis of gold price trends this week!Market news:
During the Asian morning session on Monday (July 21), the London gold price rose slightly to above $3,350 and is currently trading around $3,356/ounce. The weakening dollar and continued geopolitical and economic uncertainties have boosted demand for safe-haven spot gold, supporting international gold prices, but the rebound in the University of Michigan survey index may limit gold's gains.Although gold prices may face correction pressure in the short term, international gold has limited room to fall. Factors such as economic slowdown, lower interest rates and rising inflation will attract more buyers to enter the market. The continued purchases by central banks over the past two and a half years have also provided solid support for gold prices. The tension between Trump and Powell is the main reason why gold prices remain high.Looking ahead, the market focus will shift to this week's ECB monetary policy meeting. Economists generally expect the ECB to keep interest rates unchanged, and preliminary manufacturing data released this week may also trigger some market fluctuations. This week's economic data and Fed dynamics will be key variables in the trend of gold prices. No matter how the market fluctuates, the long-term value of gold cannot be ignored, and investors need to pay close attention to macroeconomic changes and political events.
Technical Review:
Technically, the daily chart of gold still maintains the adjustment of the middle track of the Bollinger Band, forming a yin-yang alternating shock consolidation. However, on Friday, the gold price closed with a small positive K, and the price MA10/7-day moving average closed above 33/42. From the indicator point of view, the MACD indicator momentum column shortened, and the RSI indicator ran around 50, indicating that the market buying and selling forces were balanced.The 4-hour chart shows that the gold price fluctuated and tended to buy and consolidate at 3330-3360. At present, the moving average system opened upward. As long as gold does not lose 3320, it is expected to continue to sprint upward to 3375/3400. On the contrary, if it loses the support of 3320/10 again, it is regarded as a short-term weak shock downward. On the whole, the current trend of gold is oscillating and tending to buy and consolidate. Today's trading idea is mainly to buy at a low price and sell at a high price.
Today's analysis:
Since there is no major economic data this week, in the absence of geopolitical risks and emergencies, it is expected that gold will still see a small range of shocks and consolidation this week, and the range can be focused on 3400-3300. The daily Bollinger Bands continue to close, with the upper track at 3375 and the lower track at 3288. The short-term moving averages are intertwined near the middle track, suggesting that gold will still be dominated by fluctuations in the short term. In terms of operation, keep the idea of selling at high prices and buying at low prices. Do not chase the rise and sell at the fall. Wait for the breakthrough signal to be confirmed before following the trend. Today’s support is at 3340. You can use this as a key point to arrange buy orders during the day. The key point above is 3361, which is the high point of last Friday. 3361 is a short-term pressure point. If there is no correction today and it directly breaks 3361, we can follow the trend directly. If there is a correction, pay attention to the bottom structure above 3340 and buy at the bottom!
Operation ideas:
Buy short-term gold at 3340-3343, stop loss at 3332, target at 3370-3390;
Sell short-term gold at 3377-3380, stop loss at 3388, target at 3340-3320;
Key points:
First support level: 3340, second support level: 3332, third support level: 3320
First resistance level: 3375, second resistance level: 3388, third resistance level: 3410

Ultra-short-term trading. Profit of $10/ounceThe order to buy XAUUSD successfully made a profit. The current gold price is 3367. Stimulated by the weekend news, the expected trend was achieved smoothly, and the short-term bulls were strong. Buying can continue to be the main focus. Relying on the half-hour and one-hour trends, trading can be carried out in the London market for the purpose of buying and profit. The increase is about $10/ounce.
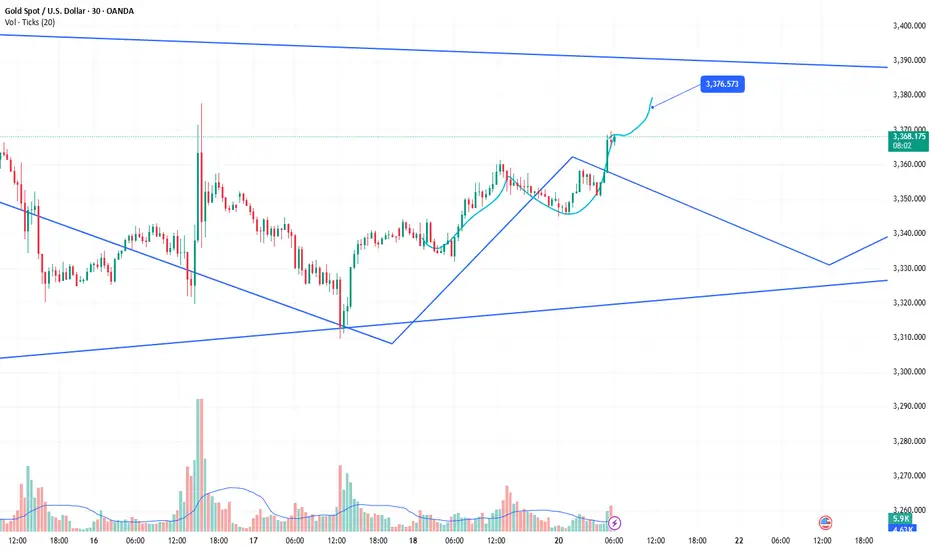
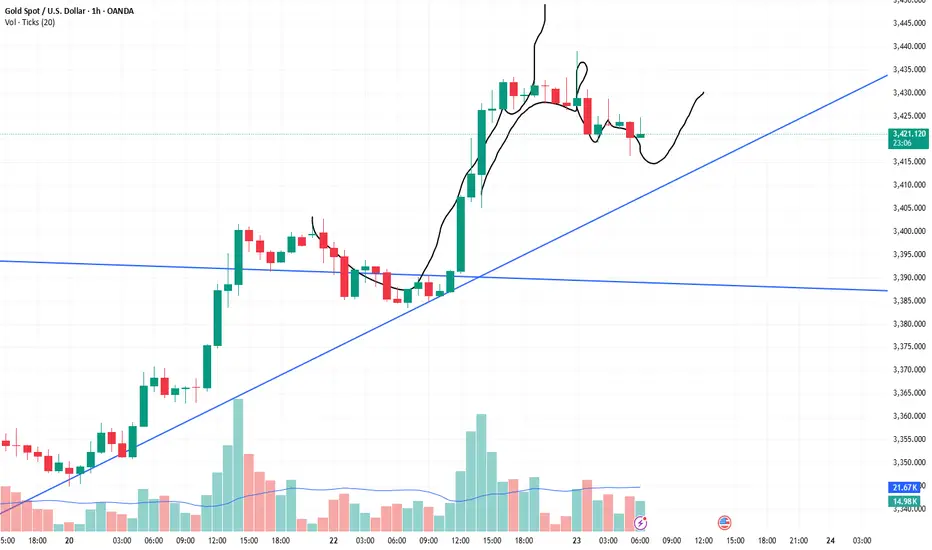
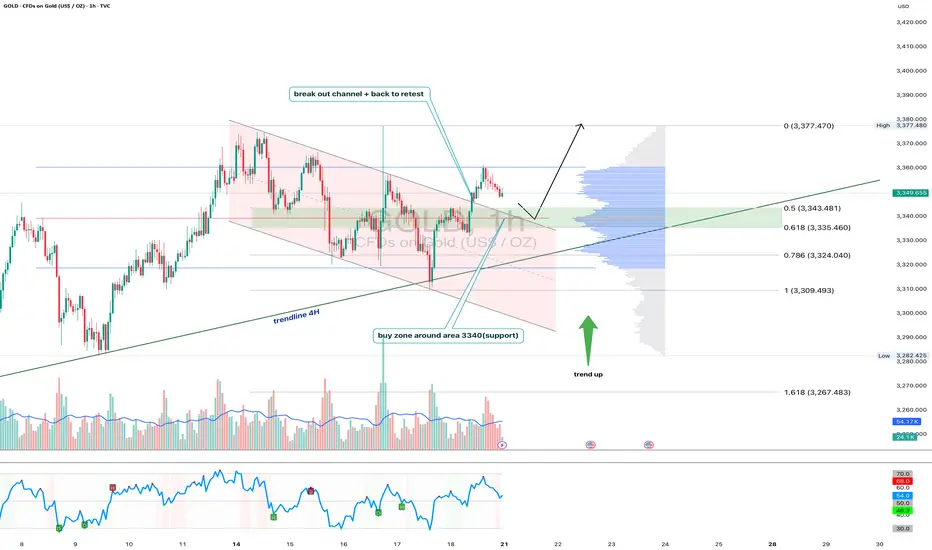
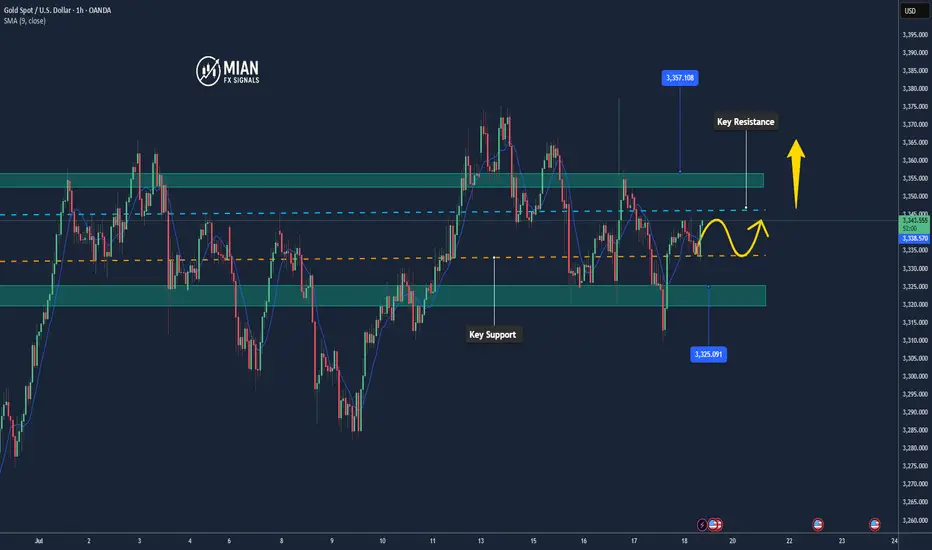
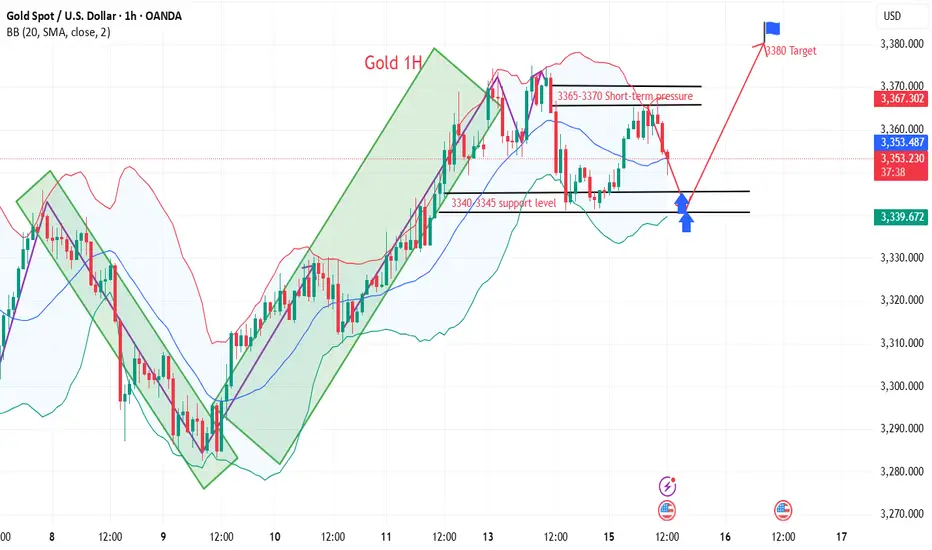
Gold 1H - Retest of channel & support zone at 3340After breaking out of the falling channel, gold is currently retesting its upper boundary — now acting as support. The 3340 zone is particularly important as it aligns with the 0.618 Fibonacci level and high volume node on the visible range volume profile. The price action suggests a potential bullish rejection from this area. With both the 50 and 200 EMA below price on the 1H, the short-term trend remains bullish. The 4H trendline further supports this setup. RSI is cooling off near the neutral zone, leaving room for another leg higher toward the 3377 resistance zone. If 3340 fails, 3324 (0.786 Fibo) becomes the next line of defense. Until then, the structure remains bullish following the successful breakout and retest of the channel.
Gold momentum is about to explode, is 3400 still far away?
💡Message Strategy
Gold prices rose as expected on Friday as a weaker dollar and continued geopolitical and economic uncertainty boosted demand for safe-haven gold. Spot gold rose 0.4% to $3,353.25 an ounce, down 1.1% in the previous session. U.S. gold futures also rose 0.4% to $3,359.70. Gold prices remained largely stable around $3,350 an ounce this week.
The trend of gold prices is currently mainly affected by the following three factors:
1. US economic data supports the US dollar
The latest US real estate data is generally positive, and building permits and new housing starts data are both above expectations. The recovery of the real estate market has reduced market concerns about economic recession, which has provided some support to the US dollar, thereby constituting a certain suppression on gold.
2. Fed policy differences trigger market games
Fed officials have obvious differences in their statements on monetary policy. Christopher Waller, a Fed governor, prefers to directly cut interest rates by 25 basis points in July, worried about economic slowdown and weak job market. San Francisco Fed President Daly believes that two interest rate cuts in 2025 are "reasonable", but is wary of the impact of excessive tightening policies on the job market.
On the contrary, Fed Governor Kugler is more hawkish, believing that recent tariffs have been transmitted to consumer prices, and high interest rates should continue to be maintained, and it is not appropriate to cut interest rates for the time being. The existence of differences has caused market expectations to waver, and gold has fallen into consolidation.
3. Inflation expectations determine the medium-term direction of gold prices
The June CPI data from the United States showed signs of rising inflation, which may cause the Federal Reserve to postpone the pace of interest rate cuts.
📊Technical aspects
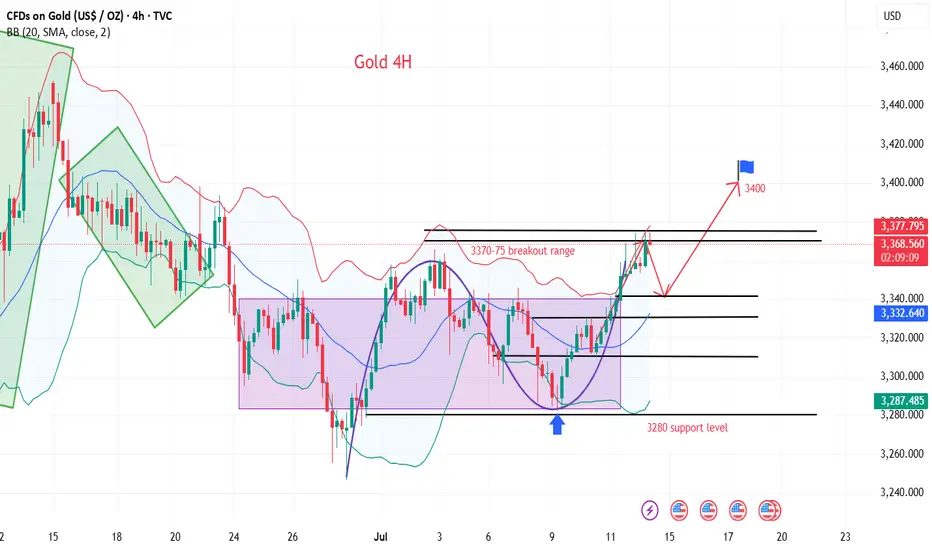
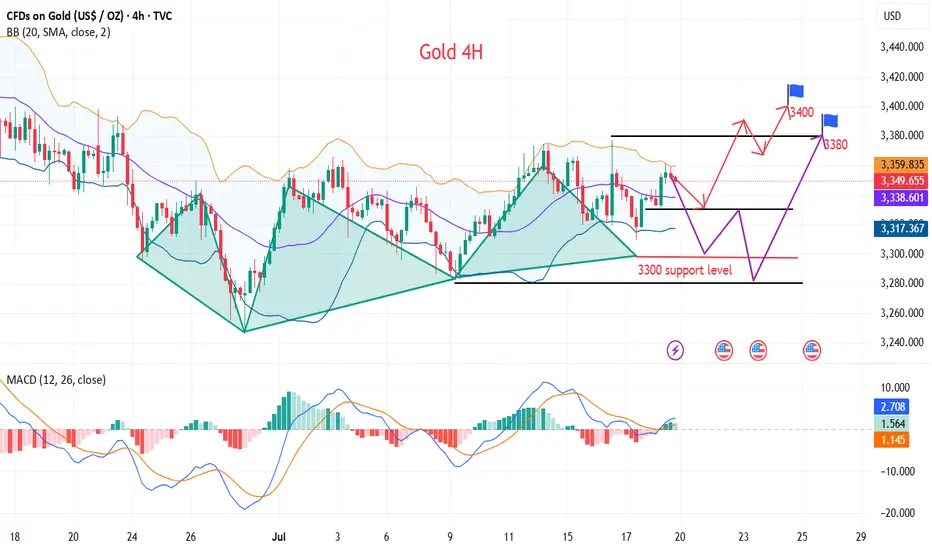
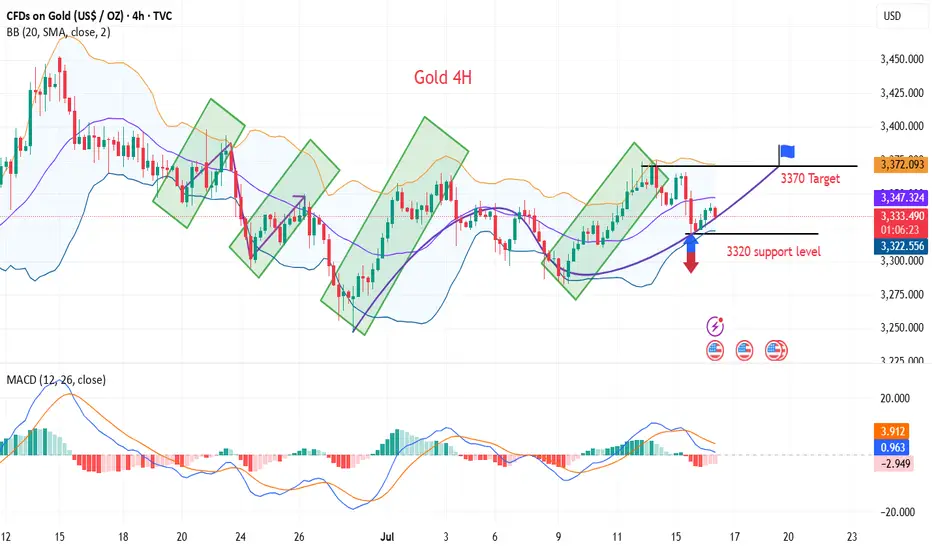
From the 4H chart, gold is currently oscillating in an obvious symmetrical triangle, forming a consolidation pattern in the short term.
Bollinger Band indicator: The middle track of the Bollinger Band is at $3345, the upper track is at $3405, and the lower track is at $3280. The current price is running near the middle track, indicating that volatility is converging and there is an expectation that a direction will be chosen soon.
Support and resistance: The current key support level is $3,280; short-term support is 3,300, and the upper resistance is $3,380. After breaking through, it is expected to test the previous highs of $3,451 and $3,499.
MACD indicator: The MACD histogram is gradually converging, and the DIFF line (3.19) and the DEA line (1.91) are in a sticky state, indicating that the momentum is exhausted and the probability of short-term shocks is high, but once the volume breaks through, the trend may form quickly.
RSI indicator: The RSI indicator is currently at 53.64, which is in the neutral area and has not entered the overbought or oversold area, indicating that the market is still waiting for new direction signals.
Overall, the analysis believes that gold is at the end of a symmetrical triangle, and the technical side shows that it is about to face a breakthrough. The direction choice may appear tonight or early next week, and the idea is still mainly low-level bulls.
💰Strategy Package
Long Position:3320-3330,SL:3300,Target: 3370-80,3400
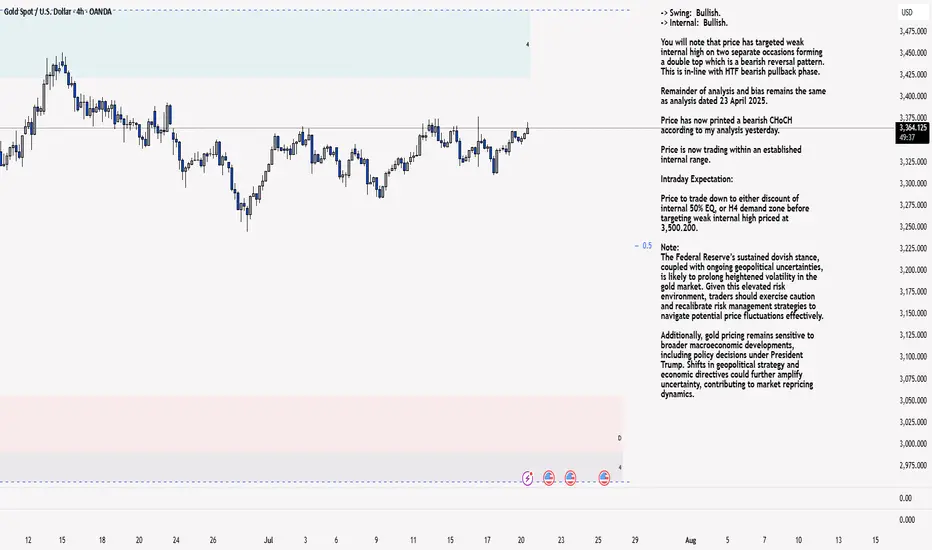
XAU/USD 21 July 2025 Intraday AnalysisH4 Analysis:
-> Swing: Bullish.
-> Internal: Bullish.
You will note that price has targeted weak internal high on two separate occasions forming a double top which is a bearish reversal pattern. This is in-line with HTF bearish pullback phase.
Remainder of analysis and bias remains the same as analysis dated 23 April 2025.
Price has now printed a bearish CHoCH according to my analysis yesterday.
Price is now trading within an established internal range.
Intraday Expectation:
Price to trade down to either discount of internal 50% EQ, or H4 demand zone before targeting weak internal high priced at 3,500.200.
Note:
The Federal Reserve’s sustained dovish stance, coupled with ongoing geopolitical uncertainties, is likely to prolong heightened volatility in the gold market. Given this elevated risk environment, traders should exercise caution and recalibrate risk management strategies to navigate potential price fluctuations effectively.
Additionally, gold pricing remains sensitive to broader macroeconomic developments, including policy decisions under President Trump. Shifts in geopolitical strategy and economic directives could further amplify uncertainty, contributing to market repricing dynamics.
H4 Chart:
M15 Analysis:
-> Swing: Bullish.
-> Internal: Bullish.
H4 Timeframe - Price has failed to target weak internal high, therefore, it would not be unrealistic if price printed a bearish iBOS.
The remainder of my analysis shall remain the same as analysis dated 13 June 2025, apart from target price.
As per my analysis dated 22 May 2025 whereby I mentioned price can be seen to be reacting at discount of 50% EQ on H4 timeframe, therefore, it is a viable alternative that price could potentially print a bullish iBOS on M15 timeframe despite internal structure being bearish.
Price has printed a bullish iBOS followed by a bearish CHoCH, which indicates, but does not confirm, bearish pullback phase initiation. I will however continue to monitor, with respect to depth of pullback.
Intraday Expectation:
Price to continue bearish, react at either M15 supply zone, or discount of 50% internal EQ before targeting weak internal high priced at 3,451.375.
Note:
Gold remains highly volatile amid the Federal Reserve's continued dovish stance, persistent and escalating geopolitical uncertainties. Traders should implement robust risk management strategies and remain vigilant, as price swings may become more pronounced in this elevated volatility environment.
Additionally, President Trump’s recent tariff announcements are expected to further amplify market turbulence, potentially triggering sharp price fluctuations and whipsaws.
M15 Chart:
GOLDGOLD needs some more upside, reaction zone is 3380-3395, will see how gold reacts at that level.
Disclosure: We are part of Trade Nation's Influencer program and receive a monthly fee for using their TradingView charts in our analysis.

Gold Maintains Bullish Tone – Eyes on $3,350 Breakout📊 Market Overview
• Gold is trading around $3,339 – $3,340, after rebounding from the session low at $3,332.
• The USD is temporarily weakening, and safe-haven flows remain steady — key factors supporting gold.
• Markets are awaiting fresh U.S. economic data for clearer directional cues.
📉 Technical Analysis
• Key Resistance Levels:
– Near-term: $3,344 – $3,345
– Extended: $3,352 – $3,356 (weekly highs)
• Key Support Levels:
– Near-term: $3,332 – $3,335
– Extended: $3,320 – $3,325 (MA confluence + technical base)
• EMA: Price remains above EMA 09, confirming a short-term uptrend.
• Candle Pattern / Volume / Momentum: RSI is around 54–56; momentum remains positive but has cooled — suggesting potential consolidation.
📌 Outlook
Gold is maintaining a bullish technical structure — if it breaks above $3,345, a move toward $3,352 – $3,356 is likely. On the downside, a drop below $3,332 could trigger a retest of $3,325 – $3,320.
💡 Suggested Trading Strategy
🔺 BUY XAU/USD: $3,324 – $3,327
• 🎯 TP: 40/80/100 pips
• ❌ SL: $3,320
🔻 SELL XAU/USD :$3,352 – $3,355
• 🎯 TP: 40/80/100 pips
• ❌ SL: $3,359
Gold Surges Late Session – Targeting $3,345+📊 Market Overview:
• Gold has just broken higher to $3,339, extending its bullish move after clearing the $3,335 resistance zone.
• Market sentiment remains supportive as the USD weakens and U.S. bond yields stabilize, while the Fed still shows no signs of cutting rates soon.
📉 Technical Analysis:
• Next resistance: $3,345 – $3,350
• Nearest support: $3,335 – $3,336
• EMA 09: Price remains above EMA 09 → confirms short-term uptrend
• Momentum: RSI stays bullish, and price continues to follow breakout momentum from the recent consolidation zone
📌 Outlook:
Gold is holding its bullish structure — if it stays above $3,335, a move toward $3,345–$3,350 is likely during the Asian session.
💡 Suggested Trading Strategy
🔺 BUY XAU/USD at: 3,336 – 3,338
🎯 TP: 3,350
❌ SL: 3,330

Gold Continues Short Term Uptrend📊 Market Overview:
💬Gold is currently trading around $3,340 – $3,352/oz, down slightly (~0.25%) on the day but still consolidating near recent highs around $3,500.
🌍 Geopolitical tensions (trade wars, Middle East conflicts) and strong central bank gold purchases continue to support long-term demand.
📅Markets are awaiting key U.S. inflation data and Fed signals, which may trigger volatility in the short term.
📉 Technical Analysis:
🔺Key resistance: $3,360 – $3,380, with the psychological zone at $3,400–$3,420.
🔻Nearest support: $3,330 – $3,332, followed by a firmer zone at $3,300–$3,326 (based on Fibonacci and moving averages).
• EMA/MA:
✅ Price is trading above the 50-day MA ($2,862), confirming a medium-term uptrend.
⚠️ While no specific EMA 09 data is noted, current price action suggests bullish momentum.
• Momentum / Candlestick / Volume:
📏RSI (14) is near 50–55, signaling positive momentum without being overbought.
🔄MACD is slightly negative but the overall structure remains bullish.
📌 Outlook:
Gold may continue to rise in the short term if it holds above the $3,330–$3,332 support zone, with potential to test resistance at $3,360–$3,380 and possibly revisit the $3,400 level.
A break below $3,330 could open the path toward deeper support around $3,300.
💡 Suggested Trading Strategy:
SELL XAU/USD: 3,367–3,370
🎯 TP: 40/80/200 pips
❌ SL: 3,374
BUY XAU/USD: 3,330–3,333
🎯 TP: 40/80/200 pips
❌ SL: 3,326

Gold pullback bulls are a winning streak strategy
💡Message Strategy
Gold prices experienced a roller coaster ride on Wednesday, mainly due to a Bloomberg report that Trump was considering firing Federal Reserve Chairman Powell (Trump wants to cut interest rates as soon as possible and the Fed is cautious). This quickly ignited the market's risk aversion sentiment, pushing gold prices up quickly by $50. However, after the rise, gold soon encountered resistance and gave up nearly $40 in gains, as Trump quickly denied the plan and the market's risk aversion sentiment cooled.
Gold prices fluctuated and fell on Thursday as Trump denied plans to fire Powell. Due to the rise in US CPI data released earlier, investors' expectations for the Fed's interest rate cuts cooled, which began to affect the market again. Looking ahead, investors still need to pay attention to the impact of Trump's tariff remarks and the Fed's monetary policy outlook on gold prices.
📊Technical aspects
After hitting a three-week high, gold prices fell back and continued to fluctuate in a wide range.
Gold is still in a bullish pattern. The support below focuses on Tuesday's low of $3,320, which is near the position where gold prices stabilized and rose in the Asian and European sessions on Wednesday, and near the position where gold prices fell and stabilized and rose in the US session on Wednesday. This is also the core position of our trading this week.
Gold's upper pressure focuses on the downward breakthrough of gold prices in the Asian and European sessions at $3,345, which is also the low point where gold prices quickly fell after rising on Wednesday. Secondly, focus on the intraday high of $3,375. The 5-day moving average slowed down after a slight golden cross, the MACD indicator slightly crossed upward, and the KDJ and RSI indicators formed a dead cross. The short-term technical aspect suggests that gold prices have a short-term upward trend.
💰Strategy Package
Long Position:3300-3315,SL:3280,Target: 3360-3370
Gold Holds Key Support Zone📊 Market Summary
– Gold is currently trading at $3,338/oz, hovering near a key technical support level.
– US Treasury yields remain elevated and the USD is strong, both pressuring gold; however, ongoing concerns over US–EU/Mexico trade tensions continue to support safe-haven demand.
– The market is awaiting the upcoming US PPI data to determine the next directional move.
📉 Technical Analysis
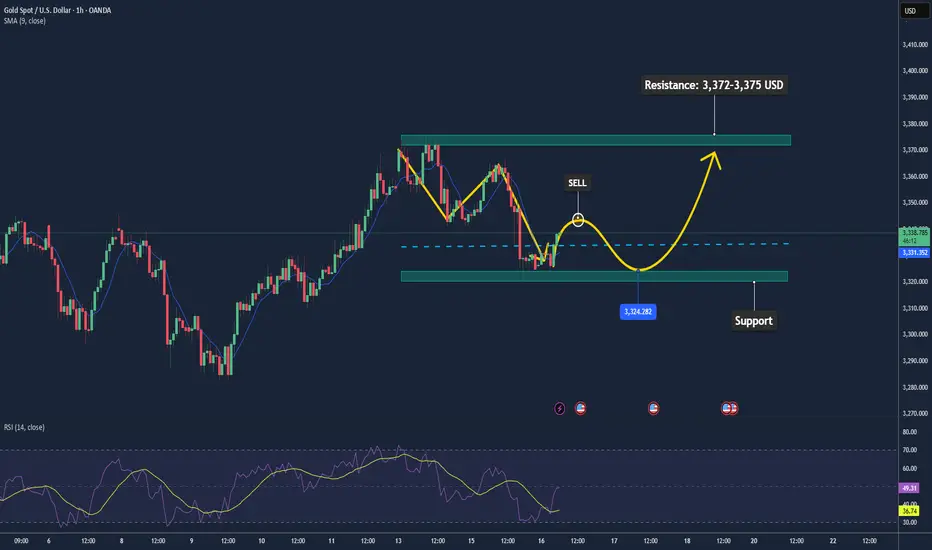
• Key Resistance: $3,372 – $3,375 (23.6% Fibonacci zone – short-term ceiling)
• Nearest Support: $3,338 – $3,330 (tested and bounced at 3,338 per Oanda); deeper support at $3,325 – $3,320 if broken
• EMA 9: Price is below the MA20/50/100 but above MA200 (H1); EMA9 is flat, suggesting a sideways/consolidation trend
• Momentum / Indicators:
• RSI around 44–52 – neutral to slightly bullish
• MACD slightly positive; Stochastic above 50, hinting at short-term overbought conditions
📌 Outlook
– Gold is holding above the 3,338–3,330 support zone. If this level holds and rate-cut expectations strengthen, the price may rebound toward 3,372–3,375.
– However, if the USD continues to strengthen and PPI/CPI data surprises to the upside, gold could break support and head lower toward 3,325–3,320.
💡 Trade Strategy Proposal
🟣 SELL XAU/USD at 3,372 – 3,375
🎯 TP: ~ 40 / 80 / 200 pips
❌ SL: ~ 3,378
🟢 BUY XAU/USD at 3,330 – 3,333
🎯 TP: ~ 40 / 80 / 200 pips
❌ SL: ~ 3,327
As risk aversion wavers, will gold rise or fall?
💡Message Strategy
After falling for two consecutive days, gold (XAU/USD) rebounded slightly in the Asian session on Wednesday, stabilizing above $3,320, attracting some bargain-hunting buyers. The market has paid close attention to the tariff policy that US President Trump continues to increase, and the rising risk aversion has become the core factor supporting gold prices.
The US CPI data for June showed that overall prices rose by 0.3% month-on-month, the largest increase in five months, and the core CPI rose to 2.9% year-on-year, both higher than expected. This has caused the market to worry that tariffs are gradually pushing up inflation, prompting the Federal Reserve to extend the high interest rate policy cycle.
📊Technical aspects
The current trend of gold is constrained by both fundamentals and technical factors.
On the one hand, Trump's tariff policy has pushed up inflation expectations, triggering risk aversion and rethinking of the Fed's policy path, providing support for gold;
On the other hand, the Fed's tone of "maintaining high interest rates for longer" has limited the room for gold prices to rebound.
From the 4-hour chart, gold prices found support near the 100-period SMA (about $3,320) on Tuesday, stopping the decline from the three-week high. In the short term, if it can stand above the 3340-3345 resistance band, it may test the 3365-3370 area again, and the further target is the 3400-dollar round mark.
💰Strategy Package
Long Position:3320-3330,SL:3305,Target: 3365-3370
Will CPI data boost gold to 3,400?
💡Message Strategy
Gold prices rebounded modestly in the Asian session, supported by a weaker dollar and safe-haven demand. The market is currently focusing on the upcoming June CPI data from the United States, and investors are reassessing whether the Federal Reserve may start a rate cut cycle this year.
The overall CPI (year-on-year) is expected to grow by 2.7%, and the core CPI may reach 3.0%. If the data is lower than expected, it will strengthen the market's bet on a rate cut in September, which is bearish for the dollar and bullish for gold.
The current market has expected that the probability of the Federal Reserve cutting interest rates in September is about 60%, and the probability of a 50 basis point rate cut before the end of the year is about 50%.
📊Technical aspects
Gold price (XAU/USD) maintains a bullish structure as a whole and is currently testing the key resistance level of $3365. If it can effectively break through this area, it will open up the upside, with the target pointing to $3400 or even $3435.
On the daily chart, MACD maintains a positive opening, and the momentum indicator shows that buying is still active, and the short-term trend is to continue to rise. On the contrary, if the gold price is blocked near 3365-3370, it may fall back to the support area of 3340 US dollars. Further support is near 3326 and 3300 US dollars, which is still regarded as a potential area for bargain hunting.
💰Strategy Package
Long Position:3345-3355,SL:3335,Target: 3380-3400
Gold bulls explode to new highs
💡Message Strategy
Gold prices hit a three-week high near $3,375 an ounce in early trading on Monday before retreating. Gold prices are under selling pressure again as buyers failed to sustain higher levels hit earlier on Monday.
Gold prices hit a three-week high in early Asian trading on Monday, supported by safe-haven demand after U.S. President Trump threatened to impose 30% tariffs on imports from the European Union and Mexico.
Gold prices encountered resistance just below the 23.6% Fibonacci retracement of April’s record rally at $3,377 an ounce in early Asian trading on Monday.
Despite the pullback, the 14-day relative strength index (RSI) continues to show additional upside as the indicator is well above its midline, currently near 54.20.
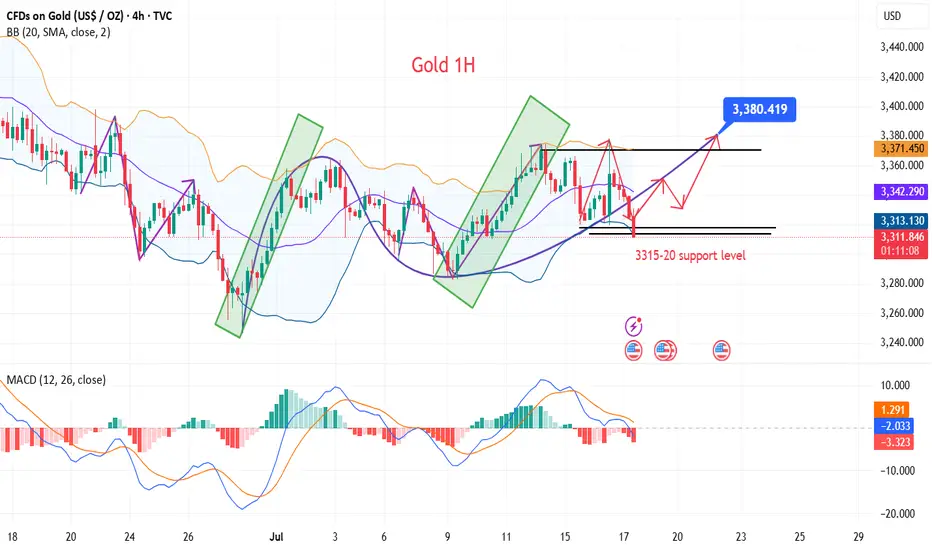
📊Technical aspects
Gold 4H chart. From the perspective of the morphological structure, gold has recently been rising in lows, and has been oscillating upward along the rising trend line, moving out of the standard rising trend wave rhythm. On Friday night, the bulls once again made a strong effort to break through the key pressure level of 3345.0, further opening up the bullish upside space, and the market outlook continues to see the bullish continuation of the market.
According to the comprehensive MACD indicator, the fast and slow lines are running above the 0 axis, indicating that the bullish power dominates the market trend. In terms of strategy, it is recommended to follow the bullish rebound wave trend to find support levels and ambush long orders.
💰Strategy Package
Long Position:3335-3340,SL:3320,Target: 3390-3400