Gold rises after brief recovery
Let’s review the gold price for next week from July 14, 2025 to July 18, 2025
⭐️Gold Information:
Gold prices surged nearly 1% on Friday as sentiment soured over U.S. President Donald Trump’s controversial trade policy targeting Canada, while hinting at broader tariffs on other countries and copper. At the time of writing, XAU/USD was trading at $3,354, rebounding from an intraday low of $3,322.
On Thursday, Trump announced a 35% tariff on Canadian imports, but goods eligible under the 2020 USMCA trade agreement remain duty-free. He also expressed his intention to extend tariffs to most trading partners, proposing a basket of rates ranging from 15% to 20%.
With a light U.S. economic calendar, attention turns to comments from the Federal Reserve. Chicago Fed President Austan Goolsbee dismissed calls for rate cuts aimed at reducing government borrowing costs, stressing that the central bank's focus remains firmly on employment and price stability.
⭐️Personal Comment:
Growth with the trend, maintaining the accumulation price zone above 3300
🔥 Technical:
Based on the resistance and support levels of gold prices on the 4-hour chart, NOVA has identified the following important key areas:
Resistance: $3392, $3447
Support: $3330, $3308, $3246
Goldinvesting
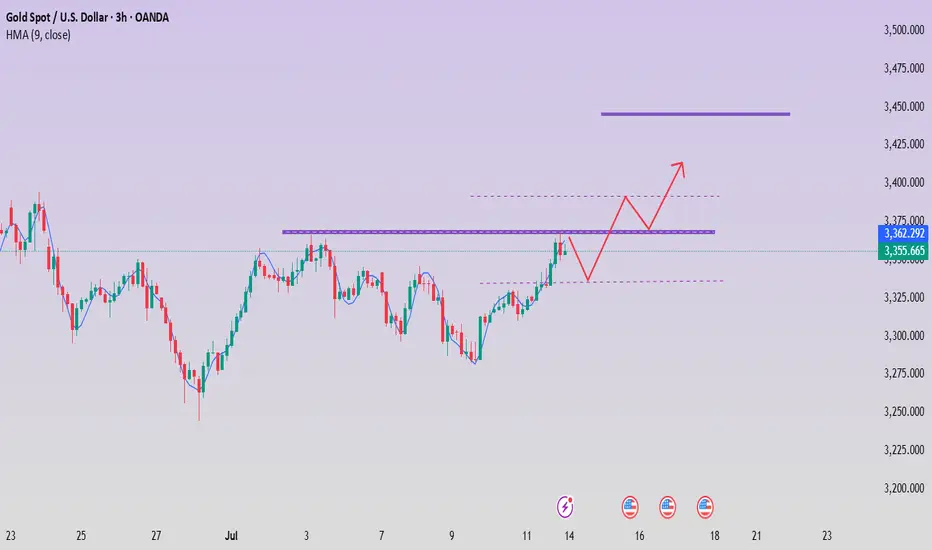
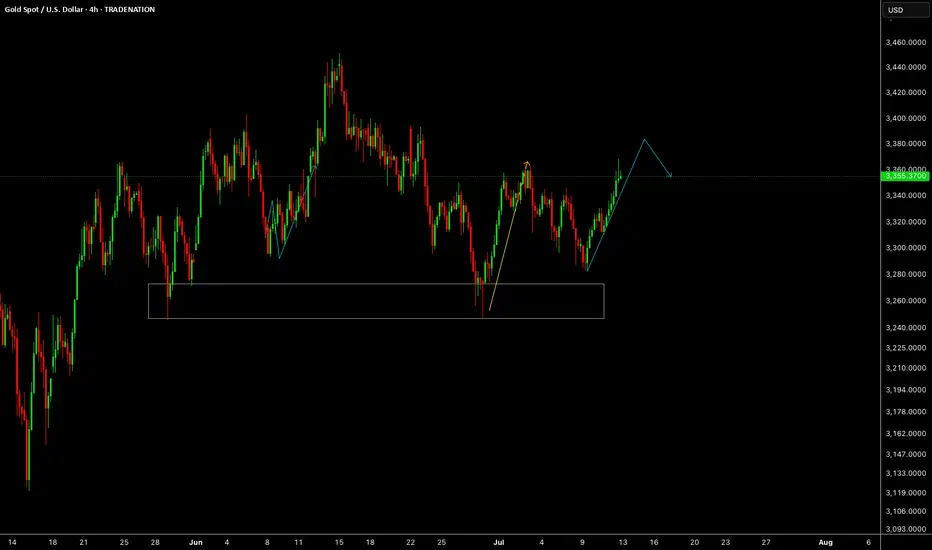
GOLDGOLD was spot on last week, expect a small correction one more push up towards 3380 level and then we will see the reaction.
Disclosure: We are part of Trade Nation's Influencer program and receive a monthly fee for using their TradingView charts in our analysis.
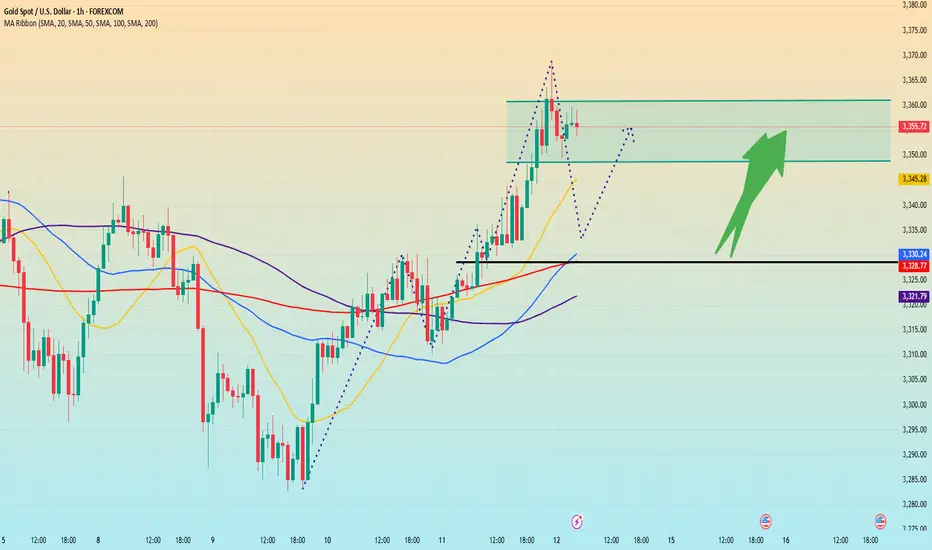
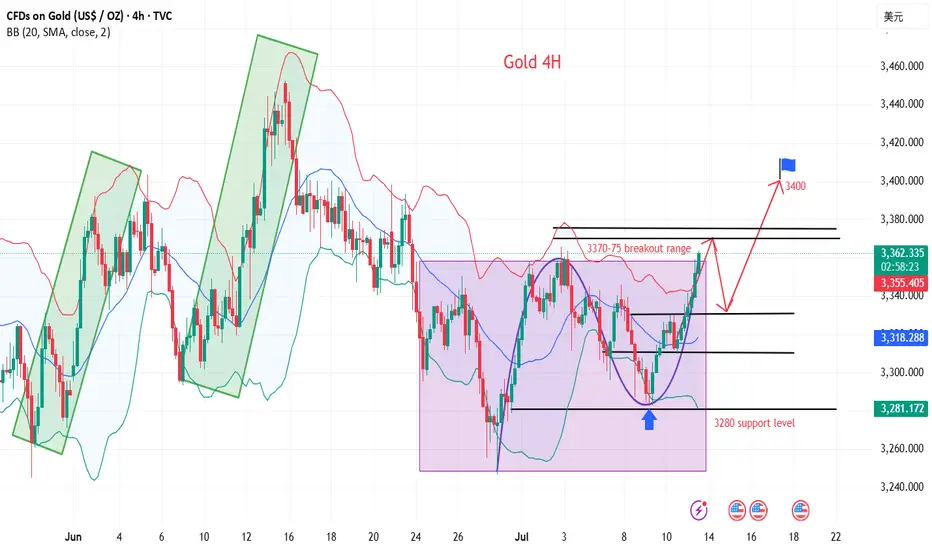
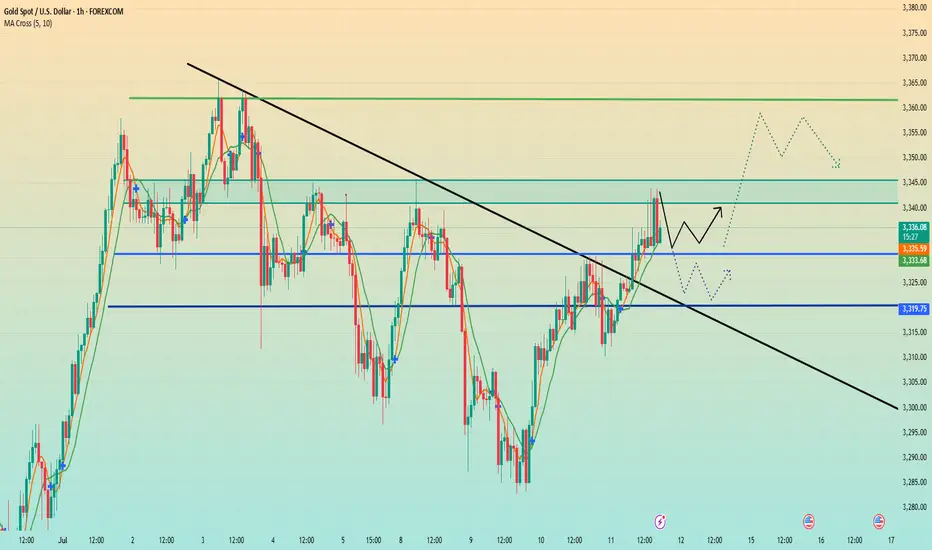
Gold breaks through. Will it continue?After breaking through the position predicted by Quaid on Friday, gold rose strongly and finally maintained the fluctuation range of 3345-3360 that I predicted. Gold bulls are now strong. If there is no major change in the news over the weekend, the price will likely continue to rise after a slight decline at the beginning of next week. I think we can still follow the strategy of Dutou.
The 1-hour moving average of gold continues to diverge with a golden cross and upward bullish arrangement, and the bullish momentum of gold is still there. The current strong support level of gold has also moved up to around 3330. After gold broke through 3330 over the weekend, the price fell back to 3330 and stabilized and rose twice. In the short term, this position has formed a strong support.
There is a high probability that the price will have a small correction at the beginning of next week. We can continue the bullish strategy after the price falls back.
Market transactions should abandon personal preferences. Preconceived subjective consciousness will eventually be taught a lesson by the market. The market is always right. We should follow the fluctuations of the market. Instead of having a head full of random thoughts. There are always traces of market changes, and you need to have the ability to discover them or follow those who have the ability. The market changes rapidly, so pay attention to more timely changes.
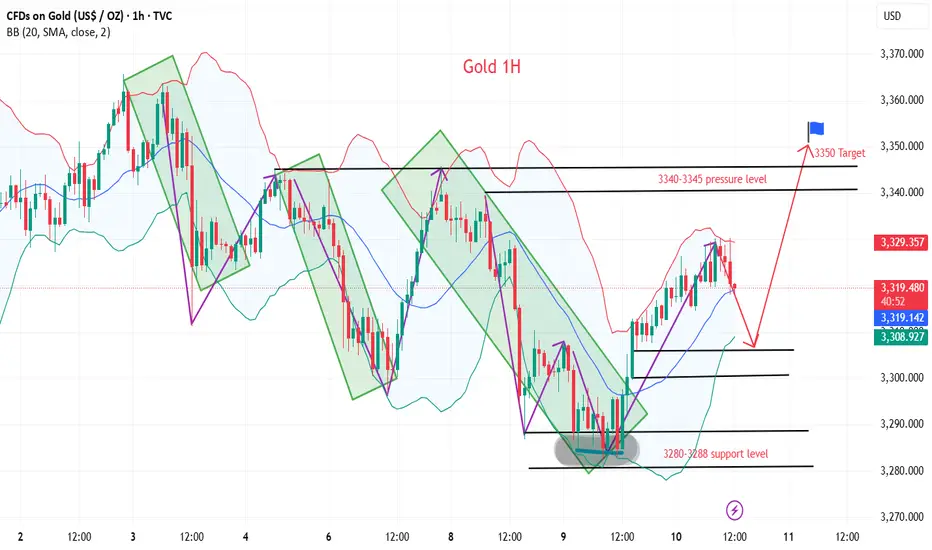
Gold price rises as expected, is 3400 far behind?
💡Message Strategy
Trump announced on Friday that he would impose a 35% comprehensive tariff on Canadian imports, which will take effect on August 1, which caused a market shock. As Canada's largest trading partner, the United States accounts for 76% of Canada's exports in 2024. This move will undoubtedly have a profound impact on the global supply chain and trade pattern.
In addition, Trump's tariff policies on copper and Brazil have further exacerbated market uncertainty, pushing gold prices to break through key technical resistance levels and move towards the $3,400 mark.
The Fed's policy moves also have an important impact on market sentiment. The minutes of the June meeting released on Wednesday showed that the Fed's internal concerns about tariffs potentially pushing up inflation are growing. The minutes pointed out that "most participants emphasized that tariffs could have a more lasting impact on inflation."
Despite this, the Fed reiterated that it would remain on the sidelines and wait for further clarity on inflation and economic activity. At present, according to the market forecast of the CME FedWatch tool, the probability of a 25 basis point rate cut in September has risen to 62.9%, reflecting investors' expectations that the Fed may ease early.
📊Technical aspects
Yesterday’s strategic recommendations mentioned that the effective support level for gold was in the 3280-3285 range. Today, gold fell back to the 3280 level, stabilized, and began to rise, perfectly reaching the target.
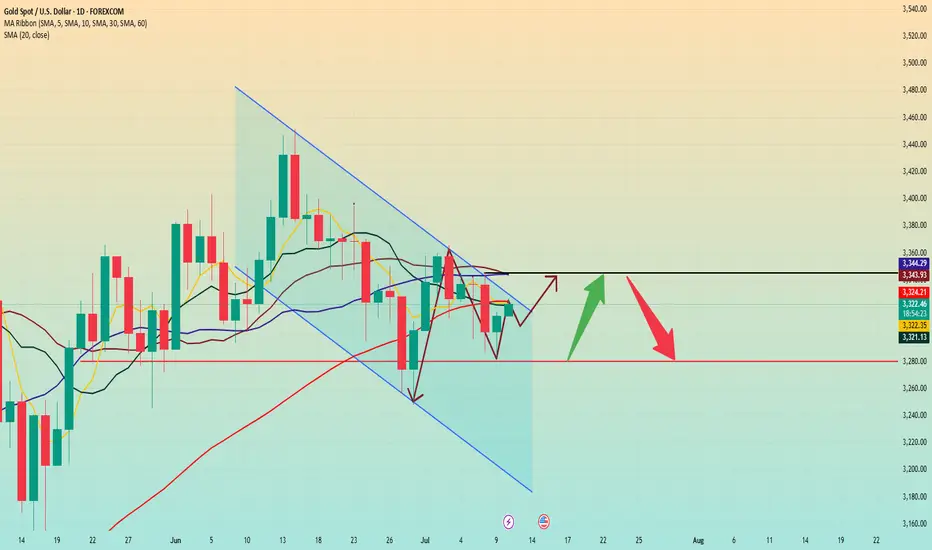
From a technical perspective, gold has shown significant upward momentum this week. The daily chart shows that the price of gold has successfully broken through the symmetrical triangle resistance and touched the 20-day simple moving average (SMA) of $3,339.97.
This breakthrough marks a strengthening of the short-term technical pattern, showing that bulls have the upper hand. The relative strength index (RSI) has rebounded to around 55 on the daily chart and is trending upward, indicating that there is slight bullish momentum in the market.
However, in the short term, the upside of gold may be limited by the 23.6% Fibonacci retracement level ($3,370). If this level can be effectively broken, the psychological level of $3,400 and the June high of $3,452 will become the next target.
💰Strategy Package
Long Position:3335-3340,SL:3320,Target: 3370-3400
Trump's tariff news stimulates gold to explode!
📌 Driving Events
Gold prices rose for the third consecutive day and are expected to close higher this week. The trend turned in favor of gold buyers as tariff tensions intensified. US President Trump announced new tariffs, exacerbating concerns about a trade war.
📊Personal Comments:
Signs of instability in Trump's trade policy have once again hit investor confidence, reviving safe-haven demand for gold. In the absence of any top US economic data, the market will continue to focus on trade headlines. Weekend fund flows may also drive gold price movements.
⭐️Set Gold Price:
🔥Sell Gold Area: 3360-3369 SL 3374
TP1: $3355
TP2: $3342
TP3: $3325
⭐️ Note: Labaron hopes that traders can properly manage their funds
- Choose a lot size that matches your funds
Gold prices are faking declines but rising, so beware
💡Message Strategy
As trade uncertainty heats up, gold welcomes safe-haven buying
After the Trump administration issued a series of tariff notices against many countries around the world, market risk aversion has intensified. The US President announced on Wednesday that a new 50% tariff on copper imports will be imposed from August 1, and reiterated that "the deadline will not be extended for countries that have received the notice, and any retaliatory measures will be responded to by tax increases."
This move has triggered market concerns about the slowdown in global economic growth, and traditional safe-haven assets such as gold have been sought after. The current gold price has rebounded significantly from the one-and-a-half-week low hit the previous day.
According to market surveys, safe-haven funds are being reconfigured, especially in the context of the unclear Fed policy and the direction of the US dollar, gold has become a non-yielding asset preferred in the short term.
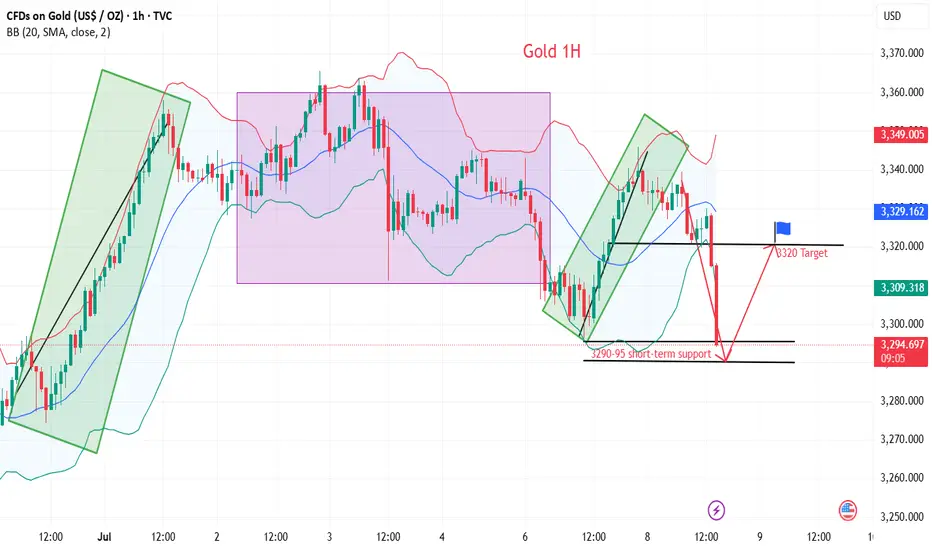
📊Technical aspects
From the 1H chart, the gold price has approached the 100-period simple moving average (SMA), which is currently located around 3,335, forming an initial resistance. If the price effectively breaks through this area, the next resistance level will be in the 3,345-3,350 range. Once it breaks through, it may trigger a short-covering market, pushing the gold price back to the 3,400 integer mark.
If gold breaks above 3,360, it will confirm the short-term bottom and open the door to re-challenging the high point of the year. On the contrary, if the gold price falls below 3,300 again, it may retest the 3,280 support, and further downside space will extend to the July low of 3,247.
For now, the performance of gold bulls is relatively prominent, and it is recommended to do more on the pullback.
💰Strategy Package
Long Position:3300-3310,SL:3285,Target: 3340-3350
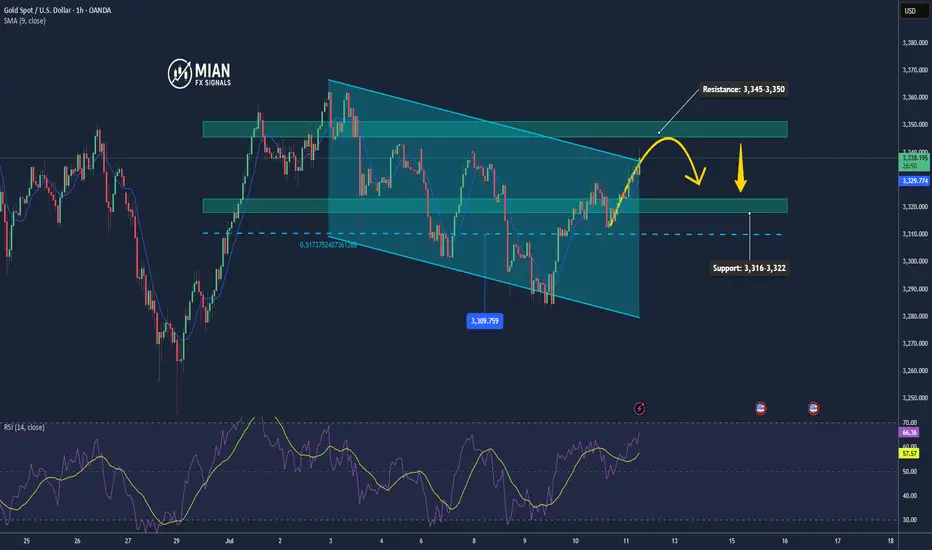
Gold in Equilibrium, Possible Minor Pullback📊 Market Overview:
• Spot gold currently trades around 3,332–3,333 USD/oz
• A slightly weaker US dollar and declining Treasury yields are supporting gold
• Yet strong US jobs data and delayed Fed rate cuts are limiting gold’s upside
• Escalating trade tensions and new tariffs keep safe-haven demand intact
📉 Technical Analysis:
• Resistance: 3,345–3,350 USD, repeatedly tested zone
• Support: 3,316–3,322 USD, strong bottom near 3,310 USD
• EMA 9: Price hovering around it—no clear trend direction
• Momentum/RSI: RSI fading from overbought, momentum weakening
• Candle Patterns/Volume: Narrow consolidation, forming pennant structure
📌 Outlook:
Gold is likely to remain range-bound or dip slightly if USD strengthens. Conversely, renewed economic headwinds or Fed dovishness could push gold higher, especially on a break above 3,345 USD.
💡 Suggested Trade Strategy:
SELL XAU/USD : 3.347–3.350
🎯 TP: 40/80/200 pips
❌ SL: 3.355
BUY XAU/USD : 3.316–3.319
🎯 TP: 40/80/200 pips
❌ SL: 3.310
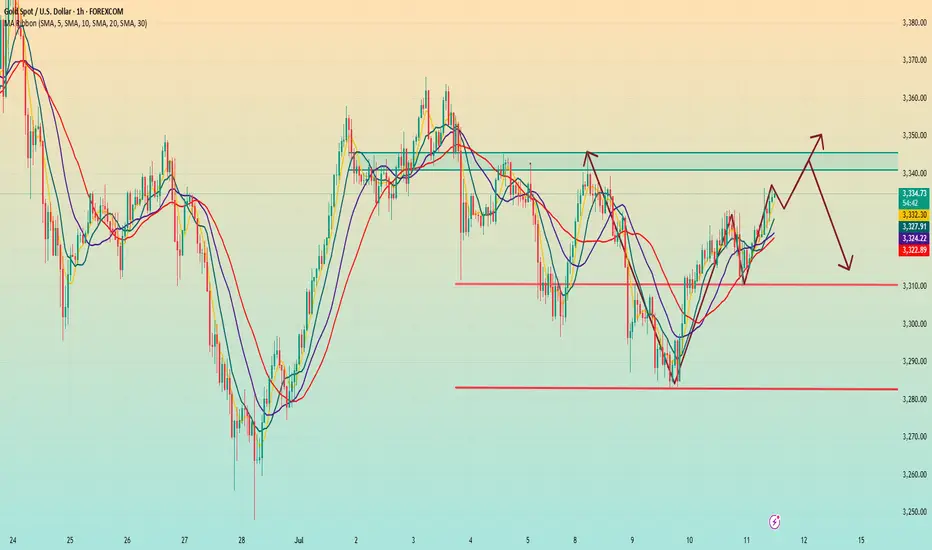
The price fell back. Watch out for a breakthrough.After reaching the resistance position near 3345 predicted by Quaid, the price fell back slightly, and the price fluctuated around 3335 so far.
From the hourly chart, before the price stabilizes at 3345, it is likely to maintain a range of 3330-3345. 3330-3345 is a temporary range. If it stands firm and breaks above 3345 again, the fluctuation range will become 3345-3360.
On the contrary, if it falls below 3330, the range may drop to 3320-3330. However, as long as the downward trend does not fall below 3320, gold will still maintain a bullish trend. If the price breaks down below 3320, today’s trend will be reversed.
As long as it is above 3320, gold will maintain a bullish trend today.
On the last trading day of this week, I wish all traders a good harvest.
Gold is fluctuating. Can it break through?Since the price of gold rose to 3500 on April 22 and encountered resistance and fell back, it has shown a triangular convergence and fluctuation trend so far. From the short-term trend, after the decline adjustment on Tuesday, it bottomed out and rebounded on Wednesday to close with a positive line, and on Thursday it completed the shock consolidation with a small positive line. The current moving average system is in an intertwined state, and the short-term market tends to fluctuate.
Today, we need to pay attention to the resistance of the 3340-3345 range. This position is a high point concentration area that has suppressed the upward movement of gold prices many times in the early stage. If the gold price breaks through this range, the bullish trend is expected to continue.
From the current trend, after the gold price bottomed out and rebounded, it formed a short-term support at 3310. Secondly, we need to pay attention to the support strength near the low point of 3282 on Tuesday. In terms of operation, it is still necessary to operate around the range.
Operation strategy:
Short when the price rebounds to around 3345, stop loss at 3355, profit range 3320-3300
Long when the price falls back to around 3310, stop loss at 3300, profit range 3320-3340
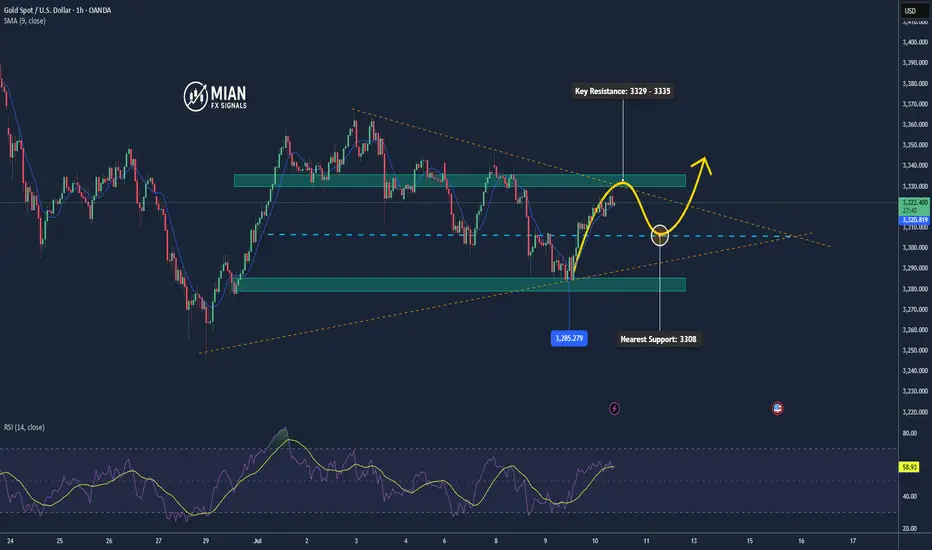
Gold Rejected at 3329.5, Profit-Taking Pressure Rises📊 Market Overview:
Gold surged to 3329.5, approaching key resistance, but quickly dropped to 3319.8 due to strong selling pressure, signaling short-term profit-taking. It’s now slightly recovering and trading around 3321.
📉 Technical Analysis:
• Key Resistance: 3329 – 3335
• Nearest Support: 3308 – 3285
• EMA 09: Price remains above EMA 09 → uptrend still intact.
• Candlestick / Volume / Momentum: H1 candle shows long upper wick at resistance. High volume at the top suggests profit-taking activity.
📌 Outlook:
Gold may continue a short-term correction if it fails to break above 3330 decisively. Bulls need to hold 3308 to maintain the upward structure.
💡 Suggested Trading Strategy:
🔻 SELL XAU/USD : 3330 – 3333
🎯 TP: 40/80/200 pips
❌ SL: 3336
🔺 BUY XAU/USD at: 3302 – 3305
🎯 TP: 40/80/200 pips
❌ SL: 3399
Trump blasted Powell again. Interest rates remain unchanged.Information summary:
Trump blasted Powell on Wednesday, saying that the current interest rate is "at least 3 percentage points higher" and once again accused Fed Chairman Powell of "making the United States pay an extra $360 billion in refinancing costs each year." He also said that "there is no inflation" and that companies "are pouring into the United States," and urged the Fed to "cut interest rates."
During the U.S. trading session, gold also showed a significant rebound momentum, rebounding from a low of 3285 to above 3310 in one fell swoop. As of now, gold has stood above 3320.
Market analysis:
From the daily chart:
It can be seen that the first suppression position above gold is currently at 3325, followed by around 3345. Gold did not close above 3320 on Wednesday, which means that even if gold is currently above 3320, as long as today's daily line closes below 3320, it is still in a bearish trend. On the contrary, if the closing price today is above 3320, then the subsequent test of the suppression position near 3345 may be further carried out.
Secondly, from the 4-hour chart, the current suppression position above 4 hours is around 3330-3335. Therefore, today we should focus on this position. If we cannot stand firm and break through the range suppression here in the 4-hour chart, we may retreat again in the future. The key support position below is around 3310, which is the opening price today. If the price is to retreat, it is likely to fall below 3310. But it may also remain above 3310 for consolidation.
However, as long as it falls below 3310, I think the low point near 3285 may be refreshed, so pay attention to this.
Operation strategy:
Steady trading waits for 3310 to fall and break through to short, and the profit range is 3385 or even lower.
Aggressive trading can short near 3340, with a stop loss of 3350.
Gold rose. Trend reversed.Gold rose slightly in early Asian trading on Wednesday, but fell under pressure near 3308. It fluctuated in the European trading range of 3296-3282. It broke through the US trading range and rose to around 3317 in the late trading. The daily line closed with a positive line with a lower shadow.
After a sharp drop on Tuesday, gold showed a downward recovery trend on Wednesday and closed positive. It rose slightly in early Asian trading today. From the daily level, in the short term, we should first pay attention to the resistance near 3325-3330. This area brings together the current positions of the 5-day moving average, the 10-day moving average and the 60-day moving average, which is an important gateway for the game between long and short forces in the short term. If the gold price continues to be under pressure in this area, it means that the short-term upward momentum is insufficient, and we need to be alert to the risk of a market decline.
If the above resistance area can be broken and the price continues to rise strongly, the next target will be the resistance near 3345, which is not only the high point on Tuesday, but also the current location of the 20-day moving average and the 30-day moving average, which has a strong technical resistance significance.
In terms of support below, first pay attention to the support near 3280, which is the current support level of the trend line formed by the low points of May 15 and June 30, which provides certain support for the gold price.
Operation strategy:
Short at price rebound near 3345, stop loss at 3355, profit range 3320-3300
Long at price drop near 3315, stop loss at 3305, profit range 3320-3340
Data is about to be released. Where will gold go?Yesterday, the market expected a trade agreement between the United States and its trading partners, which boosted risk sentiment, and the strengthening of the US dollar and the rise in US bond yields further added pressure on gold prices. Gold fell 1% during the day and once lost the $3,300 mark during the session.
After gold bottomed out and stabilized at 3,320 on Monday, it fell sharply above 3,320 again on Tuesday and has now completely fallen below 3,320. The position of 3,320 is very important. In the 3,320-50 range, it chose to break down at 3,320 again.
Today, the Federal Open Market Committee of the United States will release the minutes of the June monetary policy meeting. Although Federal Reserve Chairman Powell remained neutral on the June interest rate decision, many Federal Reserve officials released dovish signals. Federal Reserve Board member Bowerman has turned to support the possibility of a rate cut in July.
From a technical point of view, the market has penetrated into the area around the lower support of 3,275-3,295.
The rhythm of the entire market is still a process of oscillating decline. From the perspective of pressure position, the daily MA5 average line has not fallen below, and may fall again to around 3270. Once the market falls too fast and approaches this position, there is a high probability that there will be a rebound demand.
Operation strategy:
Buy near 3375, stop loss at 3365, profit range 3315-3320.
Continue to hold position after breakthrough.
Gold fell under pressure, and the watershed is 3321.
⭐️Gold Information:
During the Asian session on Wednesday, gold prices (XAU/USD) continued to be under pressure, falling below the $3,300 mark, hitting the lowest point in more than a week. The decline in gold prices comes as the market generally believes that the Federal Reserve (Fed) will maintain high interest rates for a longer period of time, especially as the market expects that tough U.S. tariffs may exacerbate inflation in the coming months.
Such expectations have pushed up U.S. Treasury yields and stabilized the U.S. dollar (USD) near a two-week high hit on Tuesday - a key resistance for the non-yielding precious metal, which continues to face downward pressure.
⭐️Personal comments:
Gold price fell below support, Dow Jones H1 pattern, gold price fell below 3300
⭐️Set gold price:
🔥Sell gold area: 3344-3446 SL 3351
TP1: $3335
TP2: $3320
TP3: $3302
🔥Buy gold area: $3256-$3254 SL $3249
TP1: $3268
TP2: $3280
TP3: $3298
⭐️Technical analysis:
Set reasonable sell orders based on technical indicators EMA 34, EMA89 and support and resistance areas.
Gold shocks and alternating long and short ideas
💡Message Strategy
As we mentioned before, the upper 3345-50 is the suppression position after the non-agricultural data last week. We can short at the 45-50 line when it rebounds. Yesterday, we also gave the idea of going long at the 3295-3301 line. At midnight, gold rebounded perfectly above the 3330 line and closed at the 3336 line.
Today we continue to pay attention to the short-term suppression of the 3345-50 line. If the rebound does not break, we will intervene in the short order. After all, the technical side needs to be adjusted and repaired during the day. We try to grasp the good entry position for operation. If your current gold operation is not ideal, welcome to communicate!
📊Technical aspects
From the 1-hour analysis, the short-term support of 3290-3295 is concerned below, the short-term resistance above is concerned about the 3345-50 line, and the suppression of 3365-70 is focused on. The overall main tone of high-altitude low-multiple cycle participation remains unchanged. In the middle position, watch more and do less, and follow orders cautiously, and maintain the main tone of participation in the trend. Wait patiently for key points to participate. Pay attention to the specific operation strategy in time.
💰Strategy Package
Long Position:3290-3300,SL:3275,Target: 3320-3340
Gold Ranges at $3,330–$3,335 – Ready for the Next Move📊 Market Overview:
Gold is currently trading around $3,330–$3,335/oz, supported by a softer US Dollar and cautious sentiment ahead of key US labor data. According to TradingView, gold is consolidating in a tight range, reflecting market indecision while awaiting a clear breakout signal.
📉 Technical Analysis:
• Key resistance: $3,345–3,350 – a strong supply zone that recently rejected price.
• Nearest support: $3,320–3,330 – multiple bounce points observed here.
• EMA09: Price is hovering around the 09 EMA on both 1h–4h timeframes → neutral/slightly ranging.
• Candlestick / Volume / Momentum:
o A “bearish flag” pattern appears to be forming, suggesting potential for a downside breakout.
o Weak buying volume during upward moves signals limited bullish strength.
📌 Outlook:
• Gold may continue to consolidate between $3,330–$3,345.
• A break above $3,345 with strong volume could open the path to $3,360–$3,380.
• A break below $3,330 could lead to further correction toward $3,300–$3,320.
💡 Suggested Trading Strategy:
SELL XAU/USD at: 3,343 – 3,345
🎯 TP: 40/80/200 pips
❌ SL: 3,355
BUY XAU/USD at: 3,330 – 3,327
🎯 TP: 40/80/200 pips
❌ SL: 3,320
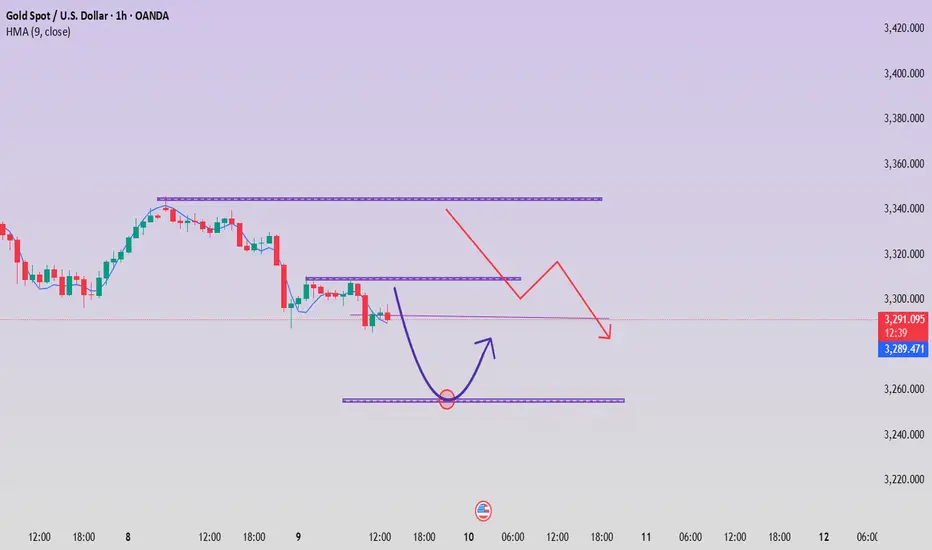
Gold is going down without any signs. Will it continue?Yesterday's seemingly strong rise in gold's safe-haven market may make people mistakenly think that gold is going to rise sharply, but the recent safe-haven market has poor sustainability and poor upward momentum, and cannot maintain the continuation of the upward trend.
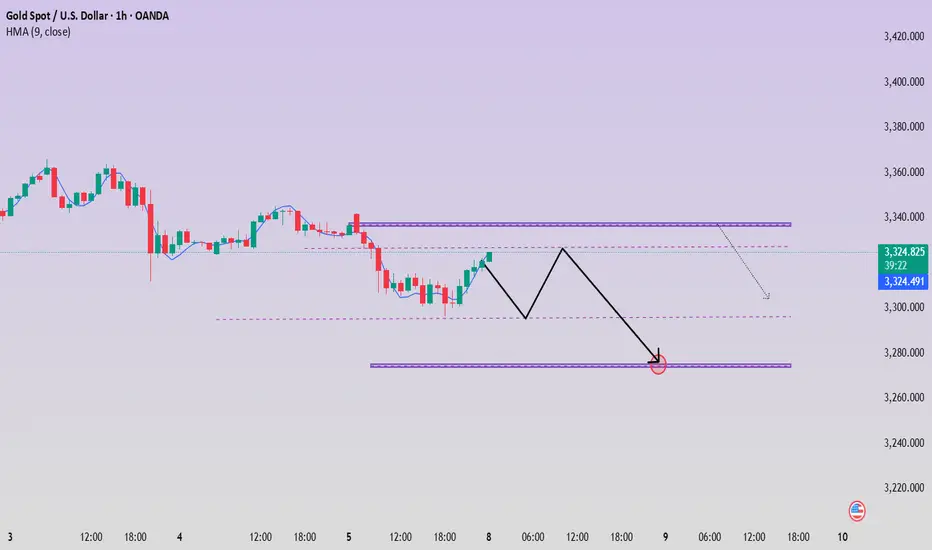
Looking at gold in 1 hour, after the price surged, it continued to fall under pressure at 3345. 3345 is also the recent key position for long and short positions. The 1-hour moving average of gold is still in a short position and continues to diverge downward. The short-term short momentum of gold still exists. I think the price will still fall after the rebound. Gold started to fall directly at 3330, and 3330 formed a strong resistance for gold in the short term. The downward low point did not continue after touching 3288. The current price rebounded and fluctuated around 3295. So we can sell high and buy low around 3385-3325.
Gold fluctuates. Beware of highs.On Monday, the U.S. dollar index rose sharply, reaching an intraday high of 97.65 as Trump announced that he would impose new tariffs on a series of countries including Japan and South Korea on August 1.
Spot gold fell first and then rose. It once fell below the $3,300 mark during the session, but then rebounded strongly in a V-shaped manner by nearly $40. As of now, it has stabilized above 3,330.
From the current daily line:
3,320 is the absolute support position for gold at present. Although it fell below 3,320 yesterday, Monday, it then reversed and stabilized above 3,320. For now, the daily line still cannot close below 3,320. If it closes below 3,320, the decline may open further. On the contrary, the current upper suppression position of gold is around 3,350. That is to say, it is basically maintained at 3,320-50 for rectification.
If the daily line stabilizes at 3350 again, the bulls may rise again.
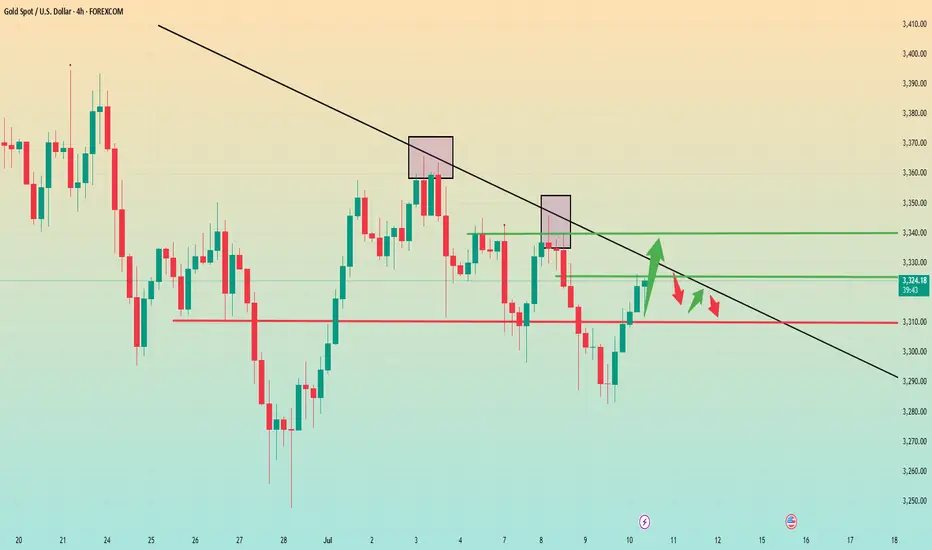
From the 4-hour chart, gold currently shows signs of a head and shoulders bottom. If the 4-hour chart stabilizes above 3340 again, the suppression level of 3350 may be directly broken. Next, it may directly touch the high level of 3380-90. Therefore, in terms of operation, I suggest that you can maintain long positions at 3320-30.
The first target is 3340-50. As long as the 4-hour chart stabilizes above 3340, you can continue to look at 3380-90.
Gold Continues Slight Pullback📊 Market Overview:
• Gold prices dropped ~0.7% to around $3,319/oz as optimism over the US trade negotiations and a tariff delay (from July 9 to August 1) reduced safe-haven demand.
• The US dollar strengthened slightly on upbeat economic data and expectations that the Fed will not cut interest rates in July, adding pressure on gold prices.
📉 Technical Analysis:
• Key resistance: $3,348 – $3,360 – $3,400
• Nearest support: $3,318 – $3,290
• EMA09: Gold is trading below the EMA50, indicating a short- to mid-term bearish bias.
• Candle/volume/momentum: On the 1H and 15-min charts, the price structure shows a clear bearish expansion – trading below pivot levels with a "bearish opening" setup, suggesting strong selling momentum.
📌 Outlook:
Gold may continue to move slightly lower in the short term if positive trade headlines and USD strength persist. However, if there’s unexpected negative news—like geopolitical tensions or a Fed policy pivot—gold could quickly rebound.
💡 Suggested Trading Strategy:
SELL XAU/USD at: 3,348 – 3,350
🎯 TP: ~40/80/200 pips
❌ SL: ~3,355
BUY XAU/USD at: 3,290 – 3,295
🎯 TP: ~40/80/200 pips
❌ SL: ~3,285
Gold rebounded from the bottom. Is the decline over?Gold prices faced selling pressure in today's Asian market. The price fell from 3343 to around 3320 in the early Asian session. The European price continued to fall, reaching a low of around 3296, and then rebounded upward. The current price is fluctuating around 3320.
Most investors will focus on the minutes of the Federal Open Market Committee (FOMC) meeting to be released on Wednesday to get guidance on the trend.
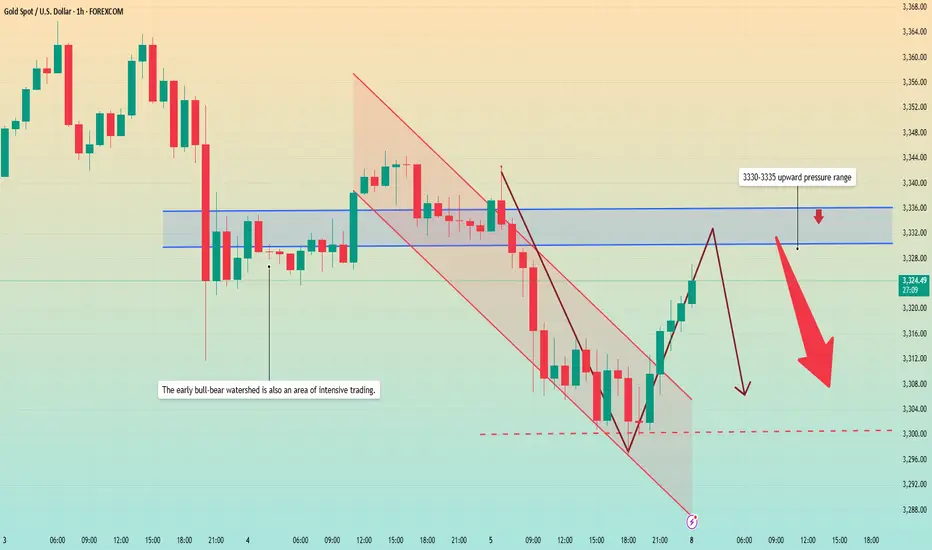
From the hourly chart, the upper pressure position is constantly being corrected. The current average pressure value is around 3330-3335. At the same time, this position is also the watershed between long and short positions in the previous dense area. The price may rebound to this position again. The lower support level is in the range of 3300-3290.
Quaid believes that the current market is still showing a downward trend, and the price may fall back below 3300 again.
Operation strategy:
Short around 3330, stop loss 3340, profit range 3310-3300, sustainable ownership after breakthrough.
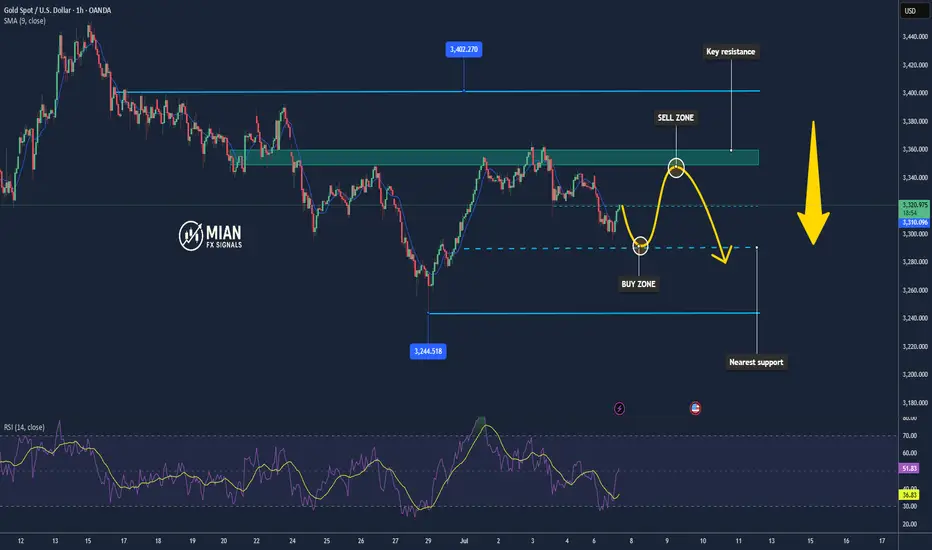
Bearish pressure below 3,300 at the start of the week
📌 Driving Events
Gold prices (XAU/USD) faced renewed selling pressure in early Asian trading on Monday, falling to the $3,320 level. Gold's pullback came as stronger-than-expected U.S. nonfarm payrolls data for June reshaped market expectations for the Federal Reserve's (Fed) policy path. Investors are now turning their attention to the Federal Open Market Committee minutes, which will be released on Wednesday, for further guidance.
The U.S. added 147,000 jobs in June, better than expected and slightly higher than the revised 144,000 in May. Meanwhile, the unemployment rate remained stable at 4.1%. These data reinforce the view that the labor market remains resilient, reducing the likelihood of an imminent rate cut by the Federal Reserve. As a result, the U.S. dollar strengthened, weighing on non-yielding assets such as gold.
📊Comment Analysis
The decline at the beginning of the week, gold prices give up accumulation below 3300
💰Strategy Package
⭐️Set gold price:
🔥Sell gold area: 3337-3339 SL 3344
TP1: $3328
TP2: $3312
TP3: $3300
🔥Buy gold area: $3297-$3295 SL $3290
TP1: $3308
TP2: $3320
TP3: $3330
⭐️ Note: Labaron hopes that traders can properly manage their funds
- Choose the number of lots that matches your funds
- Profit is 4-7% of the fund account
- Stop loss is 1-3% of the fund account
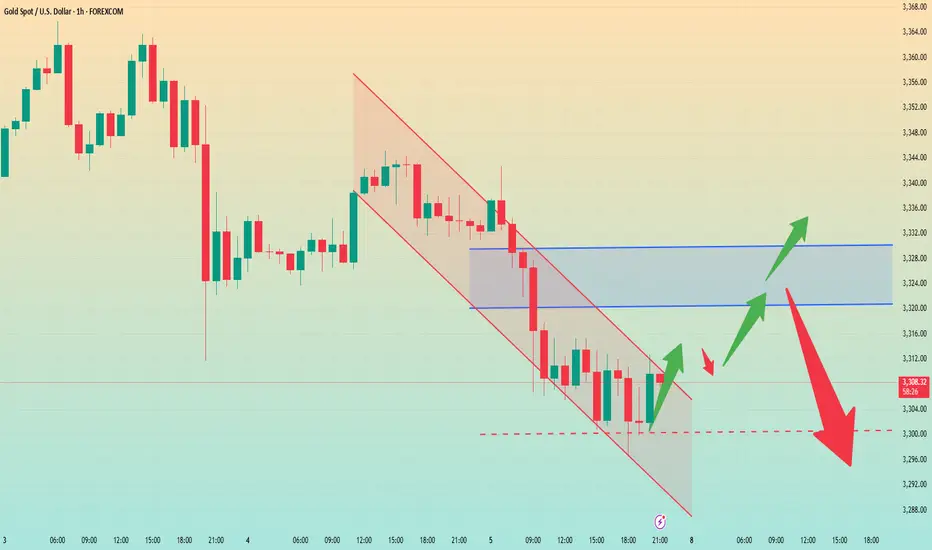
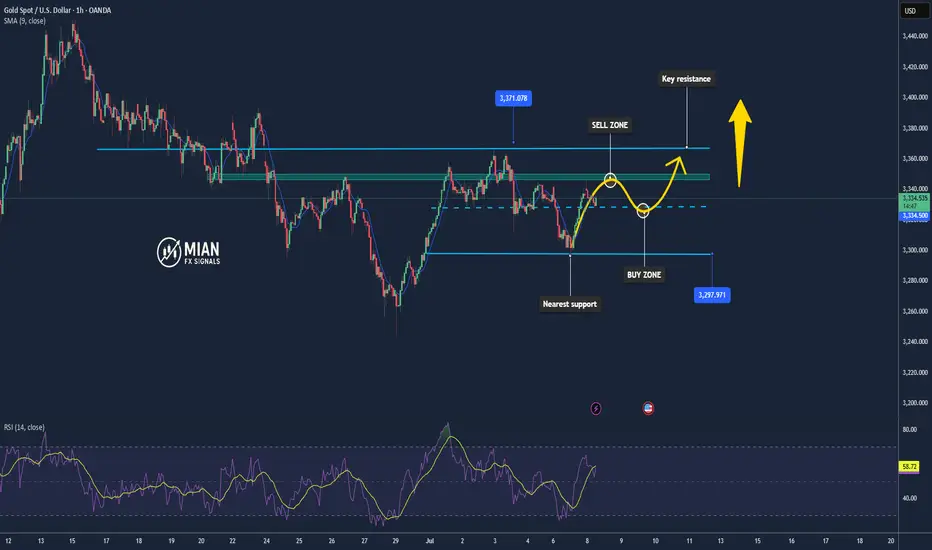
Gold/USD Bullish Reversal from Support Zone Gold/USD Bullish Reversal from Support Zone 🟢📈
Technical Analysis:
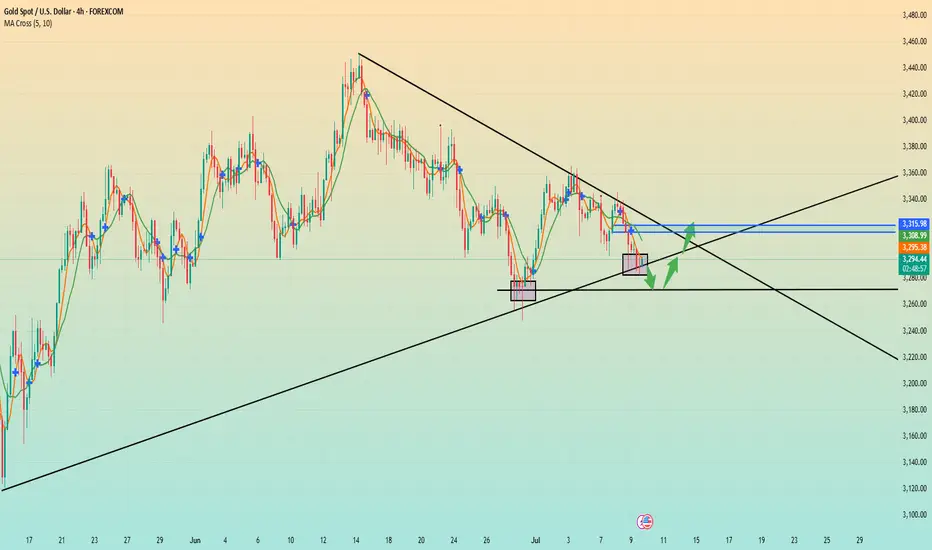
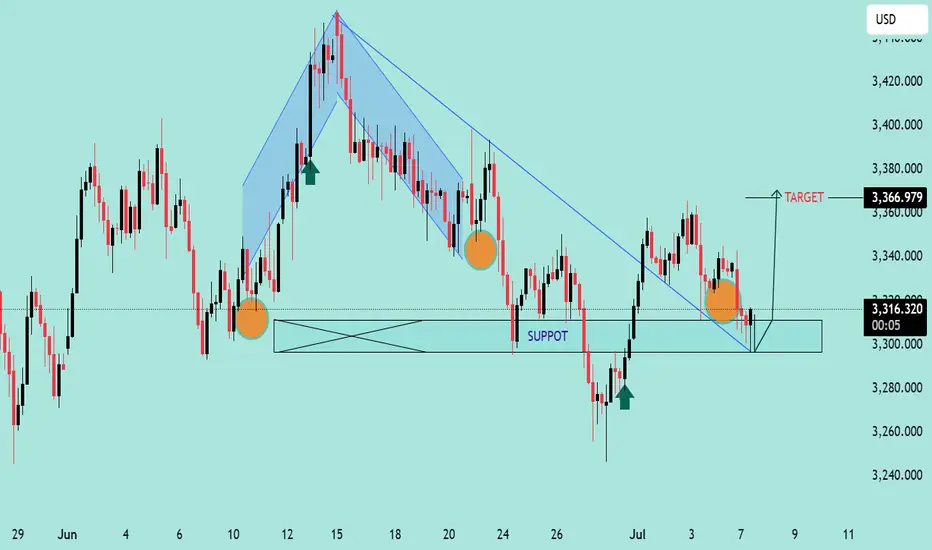
Support Zone: Price is consistently respecting the horizontal support range near 3,305 – 3,310, confirming it as a strong demand zone (marked by multiple orange circles and previous bounce reactions).
Bullish Structure: After breaking the descending trendline, the price has retested the trendline and horizontal support zone, forming a higher low — a classic bullish reversal signal.
Target Projection: The measured move projection targets a potential upside near 3,366.979, aligned with previous highs.
Bullish Candlestick Patterns: Green arrows highlight bullish price action at significant reversal points, confirming buyer strength at support.
Harmonic Pattern: The shaded harmonic pattern suggests completion near the previous lows, which aligns with the reversal zone.
Conclusion:
As long as the price holds above the support area and respects the trendline retest, bulls may push toward the projected target. A break below the zone would invalidate this bullish setup.
Gold fluctuates downward. Do not short blindly.Today, gold is in a consolidation downward trend, with the lowest point reaching around 3296; it has rebounded slightly to around 3310. From the overall market, gold is indeed in a short trend. However, do not continue to short, which is very dangerous.
Because from the hourly chart, although the low point of gold is constantly refreshing, the key hourly chart support range position has not yet broken.
So, here I may think that gold may still be tempting to short in the short term. There is still a possibility of a pullback here on the hourly chart. From the current point of view, there is still a probability of a pullback to 3320-30 before the range is broken. In terms of the next operation, I suggest that you can pay attention to 3320-30.
However, if it really pulls up again, as long as it does not stand above 3330 again. Then, we can short here at 3320-30. On the contrary, if the rebound directly breaks above 3340, then be careful. The rebound may turn into a trend reversal, and it is very likely to replicate the rhythm at the beginning of last week.