Goldlong
Gold non-agricultural layout strategy
💡Message Strategy
Small non-farm data "big surprise"
The ADP employment report released on Wednesday showed that the number of private employment in the United States decreased by 33,000 in June, the first decline since March 2023. Economists surveyed previously expected the number to increase by 100,000 on average.
The ADP employment report showed that the number of private employment in the United States fell for the first time in more than two years in June, indicating that the Federal Reserve may cut interest rates as early as September.
Spot gold closed up $18.20 on Wednesday at $3,356.90 per ounce.
Bednarik pointed out that gold has gained upward momentum recently, with a gold price target of $3,373.50 per ounce. The "big surprise" of the ADP data suggests a weak non-farm payrolls report in June.
📊Technical aspects
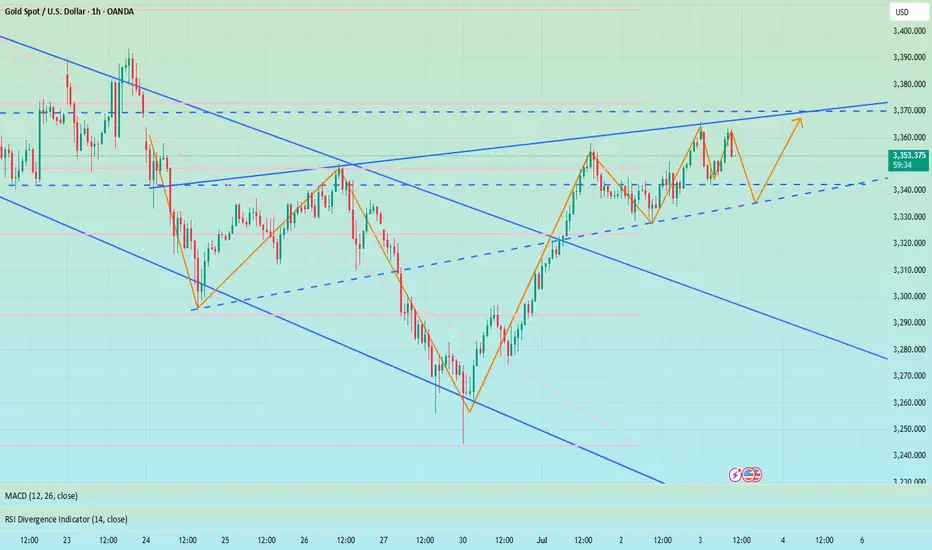
1. The daily line was the support line for the rise in the previous month. It fell back very hard last week and turned into suppression. It was tested repeatedly and finally a big Yin hit the lower track of the pattern. However, it started at a low point this week and rose steadily. Now it has returned to the top of the lifeline again. At this point, the space will consider switching again.
2. The four-hour pattern opens slightly upward, with the lifeline 3330 as the dividing line between strength and weakness. Hold here and climb upward step by step.
3. The double lines on the hourly chart formed a dead cross after breaking through and turning into pressure last week, which helped to further increase the volume and fall by more than 100 US dollars. After breaking through and standing on it this time, it turned into support. The double line range is 3332-3342. This area is used as the boundary to switch between the upper and lower spaces. The support line for the bulls to dominate is the upper rail position of 3332, and the support line for the bulls to sweep is the lower rail position of 3316
💰Strategy Package
Long Position:3332-3340,SL:3316,Target: 3400
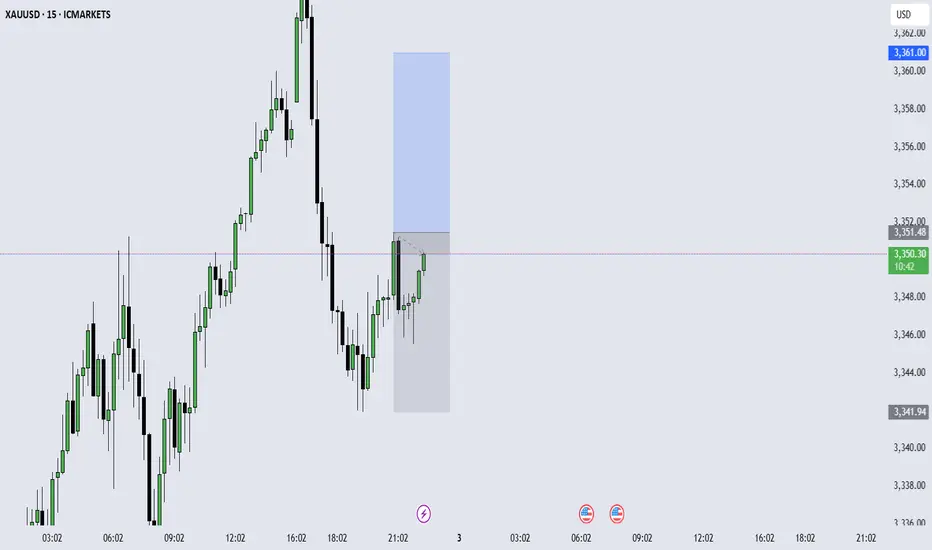
Buying the Dip or Catching a Knife? My Gold Setup Explained.Entered a long position on XAU/USD from the 1H demand zone following sharp intraday selling into a key support level. With gold hovering near $3,300 and a significant testimony from Fed Chair Powell on deck, the setup aligns with both technical rebound potential and fundamental uncertainty that could fuel upside.
The goal here is to play the liquidity vacuum left after aggressive positioning was cleared, with tight invalidation and asymmetric reward.
Technicals:
• Entry aligned with prior price inefficiency and confluence of multiple demand zones
• 1H structure shows clear deviation below the range with immediate buy-side response
• EMA channel flattening, indicating potential compression ahead of expansion
• First target: $3,352
• Risk-managed with defined stop-loss below $3,260
Execution Note: This is not a “hold forever” trade. It’s an opportunistic reaction to unwind + sentiment imbalance.
Fundamentals
• Gold saw a 25% surge in 2024 due to safe-haven demand and dovish policy, but enters 2025 under pressure from:
▫️ A strong USD
▫️ Higher cost of carry
▫️ Speculators taking profit
• Fed policy remains the core variable:
▫️ A hawkish tone from Powell could weigh on price
▫️ Rate cuts would likely revive bullish momentum
• Central bank demand remains supportive
• Geopolitical tensions (Russia-Ukraine, Israel-Iran) could trigger safe-haven bids again.
Bearish headwinds:
• Waning bullish momentum per RSI divergence
• Reduced rate cut expectations post-election
• Powell’s testimony could revive volatility either way.
This is a short-term tactical long, not a macro bet. With sentiment temporarily overextended and key support defended intraday, this is a high R/R window to exploit Powell-related volatility.
Let’s see how price reacts into $3,350+. Any sustained strength there would open room toward $3,400, while failure would confirm a retest of $3,260s.
Note: Please remember to adjust this trade idea according to your individual trading conditions, including position size, broker-specific price variations, and any relevant external factors. Every trader’s situation is unique, so it’s crucial to tailor your approach to your own risk tolerance and market environment.
XAUUSD:A long trading strategy
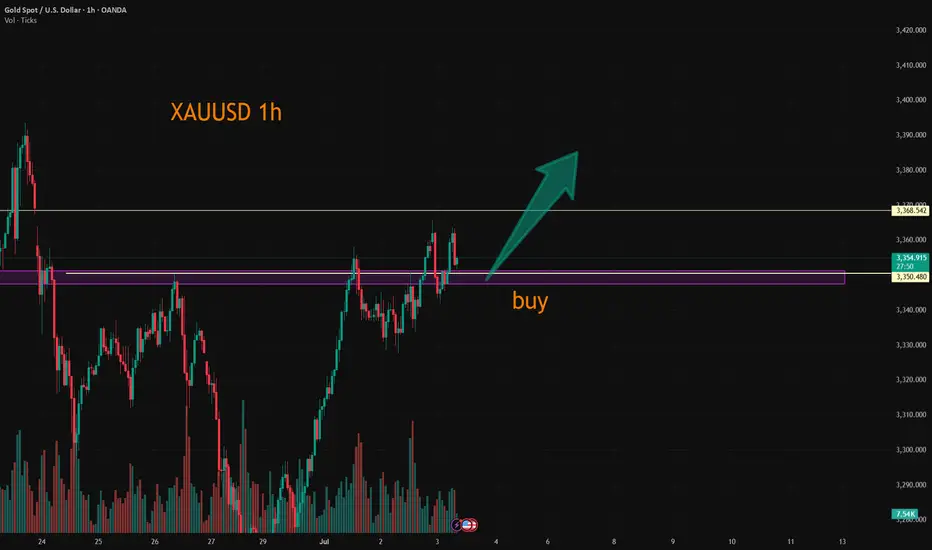
The highest gold price in the Asian session reached 3365.4, which is already our mid-line target range. If you have completed and left the market, congratulations, because I personally set the TP point of 3368, so it did not touch, the trend of the past two days is appropriate rewithdrawal after strengthening, the high is also gradually rising, the overall long trend has not changed. For today's data, the probability will make gold prices continue to rise, trading ideas or to do the main.
Trading Strategy:
BUY@3347-51
TP:3365-70
This TP range is also the target range of the median trader, for friends who do not have automatic stop profit, you can take a profit manually at that time.
More detailed strategies and trading will be notified here ↗↗↗
Keep updated, come to "get" ↗↗↗
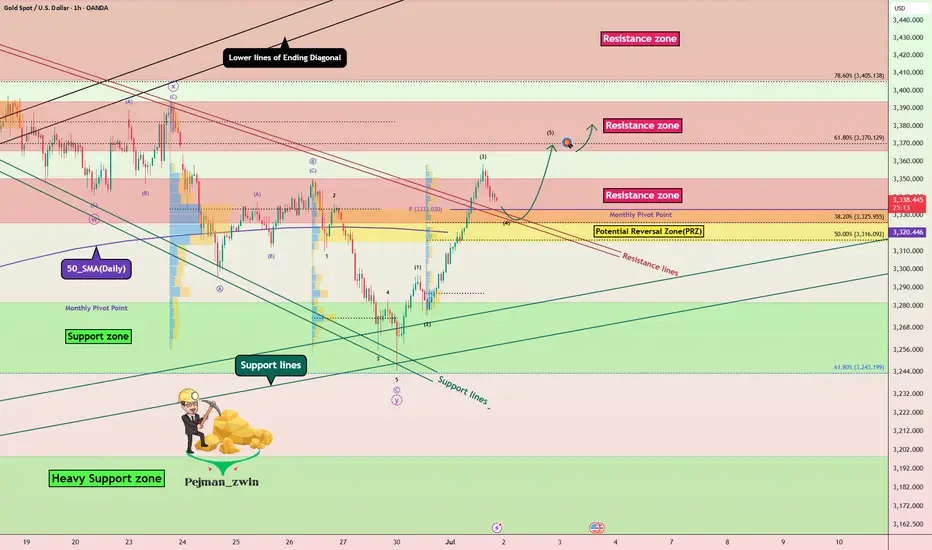
Gold Breakout Retest – Will PRZ Trigger the Next Rally?Gold ( OANDA:XAUUSD ) attacked the Resistance lines and Resistance zone($3,350-$3,326) as I expected in yesterday's idea .
Gold seems to have broken the Resistance zone($3,350-$3,326) and Resistance lines and is pulling back to this zone.
In terms of Elliott Wave theory , Gold appears to have completed wave 3 and is currently completing wave 4 .
I expect Gold to have a chance to rise back to the Resistance zone($3,394-$3,366) after entering the Potential Reversal Zone(PRZ) .
Note: Stop Loss (SL) = $3,297=Worst SL
Gold Analyze (XAUUSD), 1-hour time frame.
Be sure to follow the updated ideas.
Do not forget to put a Stop loss for your positions (For every position you want to open).
Please follow your strategy; this is just my idea, and I will gladly see your ideas in this post.
Please do not forget the ✅ ' like ' ✅ button 🙏😊 & Share it with your friends; thanks, and Trade safe.
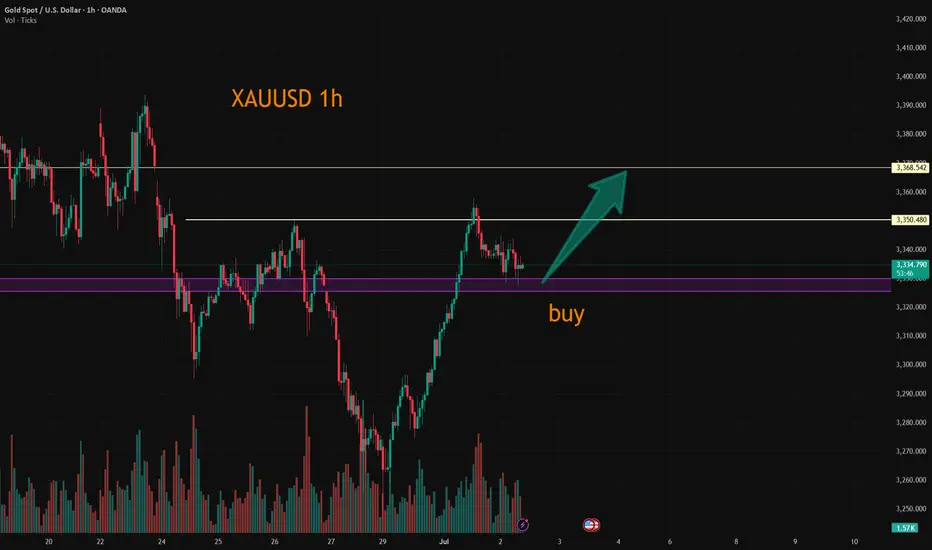
XAUUSD:Today's Trading Strategy
Gold retreated in the sub-session, I have personally increased my long position near 3331, the overall trend is bullish unchanged, the median strategy is patient to rise. If you are trading short, you can go long at 3325-3330 and leave at 3340-45. The same can be said if you want to solve the problem; Trade according to your trading preferences and risk tolerance.
More detailed strategies and trading will be notified here ↗↗↗
Keep updated, come to "get" ↗↗↗
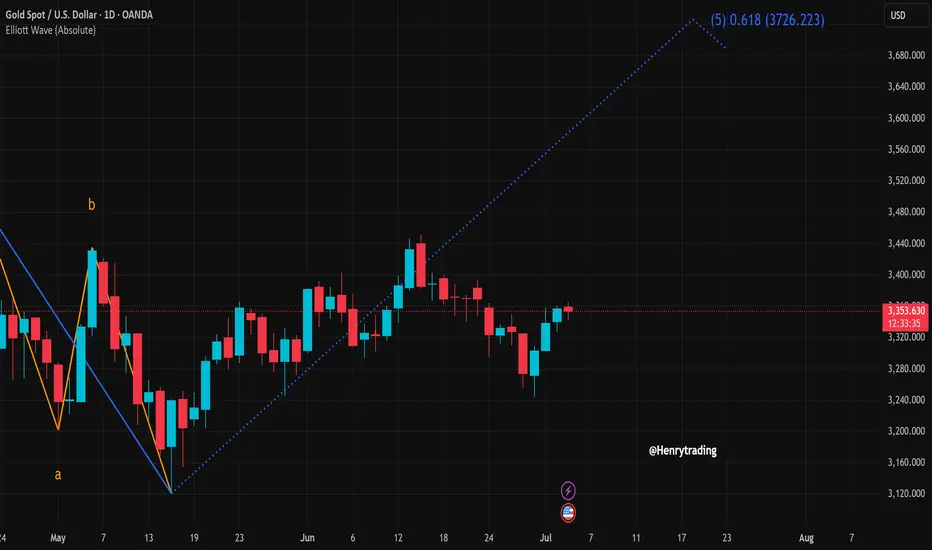
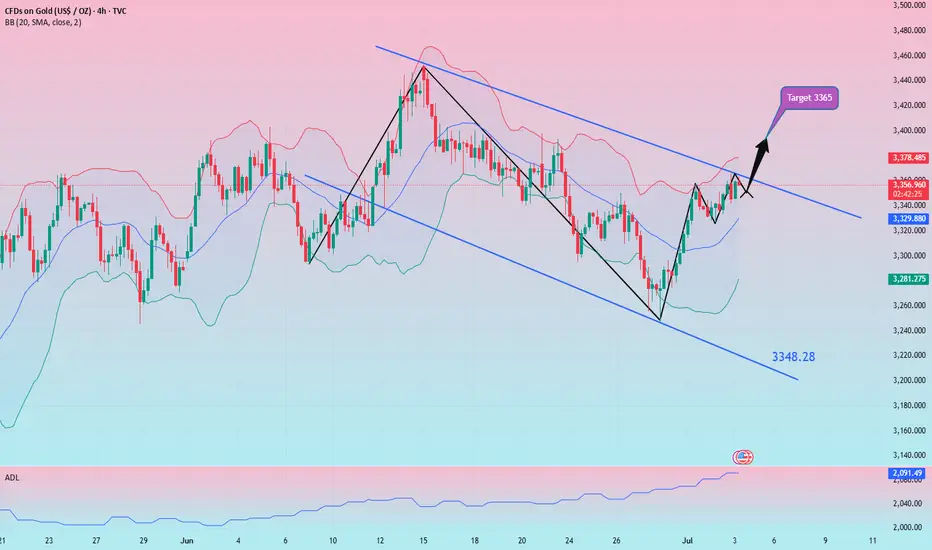
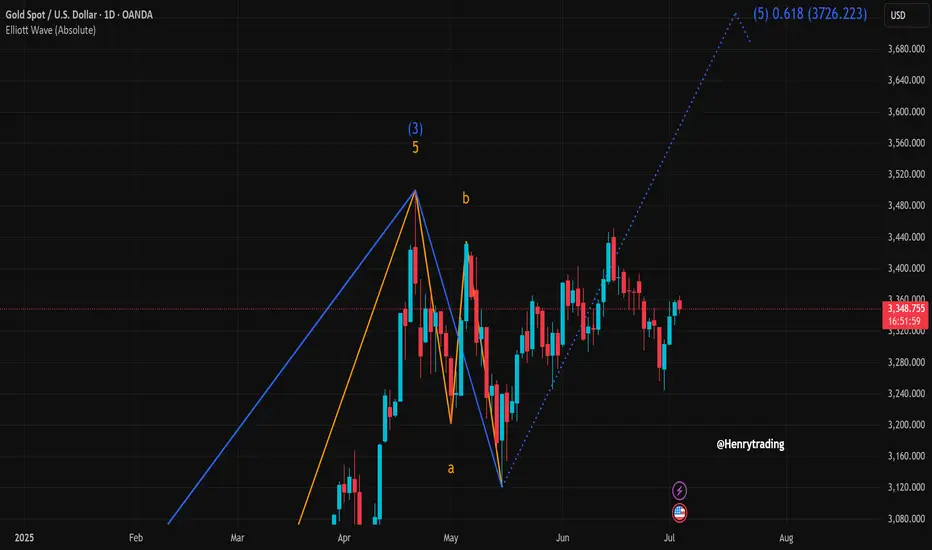
XAUUSD Set for Strong Bullish Wave – Targeting 3,726?Gold (XAUUSD) is showing signs of a bullish recovery after a recent correction between the 3,290–3,340 USD zone. On the daily chart, a clear Elliott Wave formation is unfolding, with the price potentially entering wave 5 aiming for the 0.618 Fibonacci extension at 3,726 USD.
Clear Wave Structure:
The a-b-c corrective wave appears to have completed in mid-May.
The price is now in wave 3 and preparing for a potential extension in wave 5.
Candlestick and Buying Momentum:
Recent candles show strong buying pressure with four consecutive bullish sessions.
The current upward momentum is testing the 3,352 resistance – a breakout could open the path to 3,450 and eventually 3,726 USD.
Support & Resistance Levels:
Immediate support: 3,320 – 3,330 USD
Key resistance: 3,450 USD (recent swing high)
Extended target: 3,726 USD (Fibonacci 0.618 from wave 2 low to wave 3 peak)
Suggested Trading Strategy:
Favor buy on dip strategy, waiting for a minor pullback to the 3,330–3,340 area before entering long.
Set stop-loss below 3,300, with targets at 3,450 and 3,726 USD respectively.
Conclusion:
The XAUUSD chart suggests a potential strong bullish wave according to the Elliott Wave framework, with a breakout likely leading to the 3,726 USD zone. Traders should closely monitor price action around the 3,350 level for confirmation of continued upward momentum.
What’s your view on this analysis? Drop a comment and let’s discuss your trading strategy together!
Gold trend analysis and layout before NFP data📰 News information:
1. Initial jobless claims and NFP data
2. The final decision of the Federal Reserve
📈 Technical Analysis:
Due to the Independence Day holiday this week, the NFP data was released ahead of schedule today, while the policy differences within the Federal Reserve have brought uncertainty to the market. Judging from the market trend, the 4H level shows that the gold price tested the upper track yesterday and then turned to high-level fluctuations after coming under pressure. In the short term, the structure still has bullish momentum after completing the accumulation of power. Although there was a correction in the US market yesterday, it stopped falling and rebounded near 3335, further confirming the strength. At present, the upper resistance in the European session is at 3365-3375, and the short-term support is at 3345-3335 below. Intraday trading still requires good SL to withstand market fluctuations. In terms of trading, it is recommended to mainly go long on callbacks
🎯 Trading Points:
SELL 3365-3375
TP 3350-3340-3335
BUY 3335-3330-3325
TP 3350-3360-3375
In addition to investment, life also includes poetry, distant places, and Allen. Facing the market is actually facing yourself, correcting your shortcomings, confronting your mistakes, and strictly disciplining yourself. I hope my analysis can help you🌐.
FXOPEN:XAUUSD PEPPERSTONE:XAUUSD FOREXCOM:XAUUSD FX:XAUUSD OANDA:XAUUSD TVC:GOLD
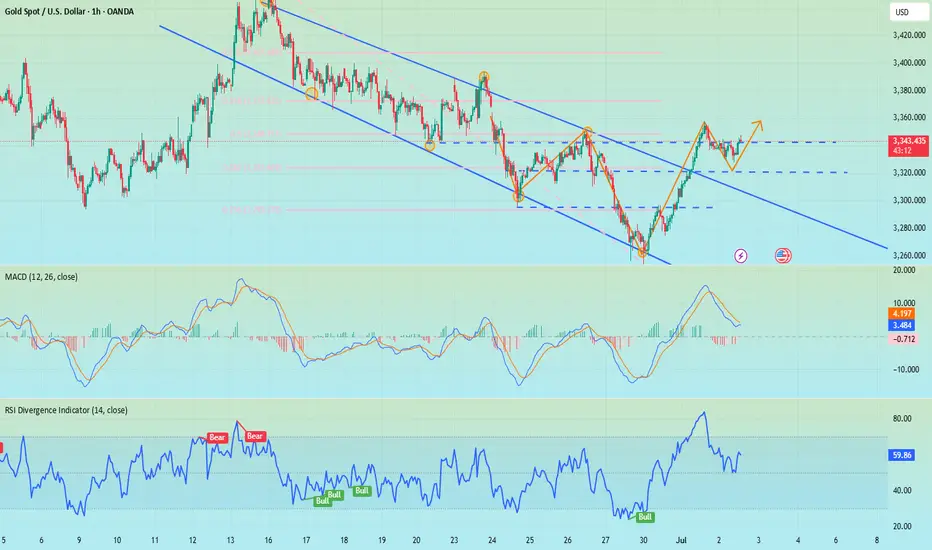
Gold strengthens, looking for low-buy opportunities
In the matter of trading, everyone's cognition and operation are different, and it is difficult to find people who can really resonate. This huge difference in trading cognition makes many traders often fall into a situation of having nothing to say in social interaction, and it is difficult to find bosom friends who can really discuss trading in depth and understand each other.
1. The US ADP National Employment Report released yesterday showed that private employment decreased by 33,000 in June, which was the first net decrease in jobs since March 2023, in sharp contrast to the 29,000 increase in May after the downward revision. The market had expected 95,000 jobs to increase in June, and this unexpected decline has raised investors' doubts about the health of the US labor market. So I think the unexpected weakness of the ADP data has led the market to bet on the Fed's interest rate cut, and this expectation has driven the rise in gold prices in the short term.
2. The trade agreement reached between the United States and Vietnam reduced the tariffs previously planned to be imposed on Vietnamese exports, easing market concerns about trade tensions. I believe that against the backdrop of increasing global economic uncertainty, gold's position as a safe-haven asset has become increasingly solid, which will become an external factor affecting the gold market in the future.
Technical aspects:
Weekly chart: Upward trend, long-term buy on dips.
Daily chart: Symmetrical triangle consolidation, cautious wait-and-see in the medium term.
4-hour chart: Downward channel breaks upward, short-term buy on dips.
30-minute chart: Upward trend, short-term buy on dips.
Intraday operations focus on bullish opportunities in the 3350 area, defend 3343. Continue to look above 3365.
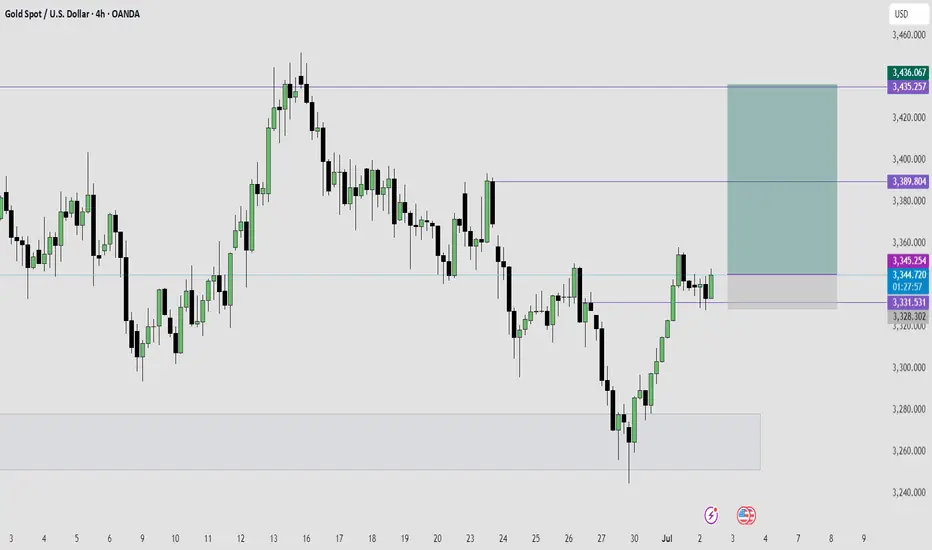
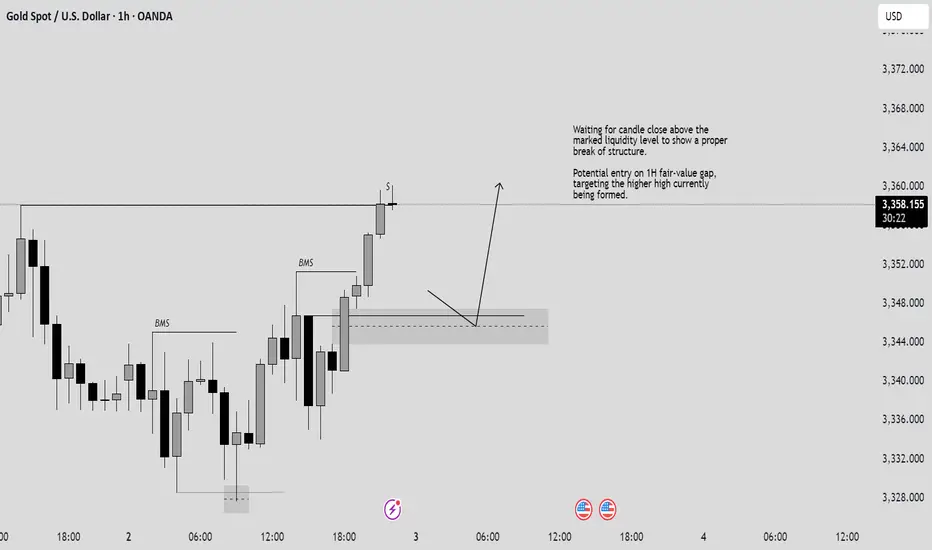
Gold is Ready For The Next Bullish Run- Taking a Long Trade HereAfter a series of bearish structures on 4Hour time frame, which is actually a bullish retracement on higher time frame, Gold has now broke the bearish structure with series of bullish candles which turned the trend from bearish to bullish trend.
After the bullish break of structure, Gold retrace into a fair value price level, formed a swing low plus a bullish price action which further confirmed the bullishness of Gold, which is were I took an entry for a buy long trade.
My target for this trade is for Gold to reach the price level of $3,436 which is a 5.36RR return.
I will be monitoring price and manage my trade accordingly as price move in my direction.
Elliott Wave Analysis of XAUUSDOn the daily chart of XAUUSD, we are witnessing a clearly defined Elliott Wave structure, with the potential formation of an extended wave (5) targeting the $3,726 region — aligned with the 0.618 Fibonacci extension. This is a key technical signal that could capture the attention of both long-term investors and strategic swing traders.
1. Elliott Wave Overview:
Wave (3) concluded at the peak around $3,365, followed by a textbook a-b-c corrective pattern.
Waves "a" and "b" are clearly identifiable, with wave "c" appearing to have completed.
The current price action suggests a rebound from the bottom of wave c — a strong indication of a possible start to wave (5).
2. Wave (5) Target Zone:
The Fibonacci 0.618 extension projects a target near $3,726 — a significant price level the market could approach if bullish momentum builds up.
This level also serves as a psychological resistance zone, so expect possible volatility as the price nears this area.
3. Price Behavior & Confirmation Signals:
Recent candlestick formations reveal renewed buying interest, with multiple bullish candles showing long bodies and lower wicks.
Holding above the key support around $3,300 is crucial for confirming the formation of an uptrend.
A breakout above the $3,365 high (wave (3) peak) would be a strong signal that wave (5) is in motion.
4. Suggested Trading Strategies:
Buy limit: Consider entries around the $3,310 – $3,320 support zone on a retest.
Buy breakout: Trigger entries if price breaks decisively above $3,365 with strong volume.
Take profit: Gradually scale out positions around the $3,680 – $3,726 area.
Stop loss: Place stops below the wave c bottom — under $3,245.
5. Conclusion:
XAUUSD is currently in a sensitive phase with a high probability of a bullish breakout. The Elliott Wave structure shows that there is still considerable upside potential. However, traders should maintain strict risk management, as wave (5) formations often involve significant price swings.
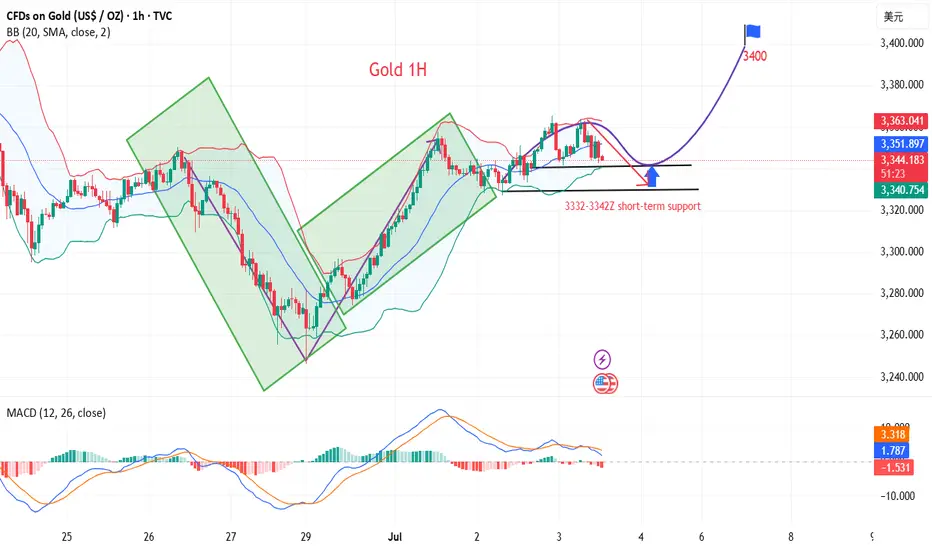
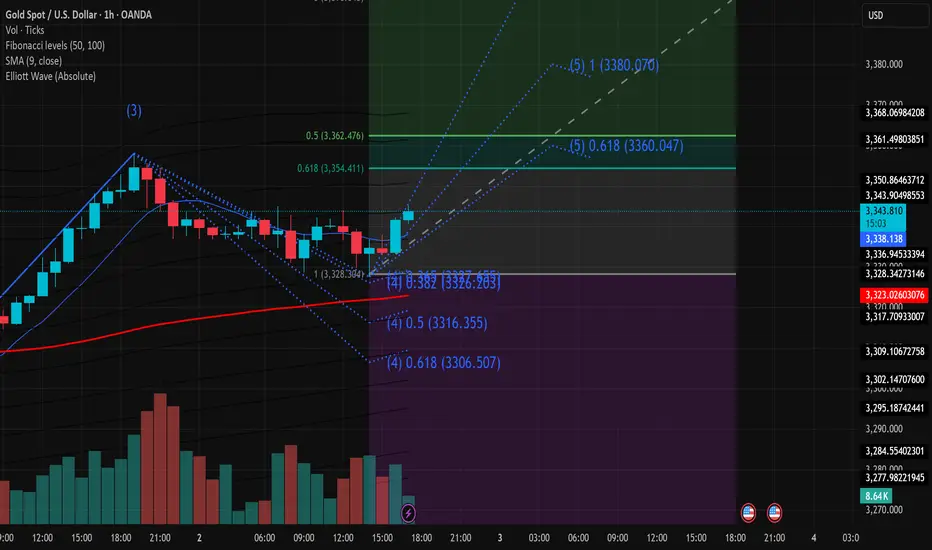
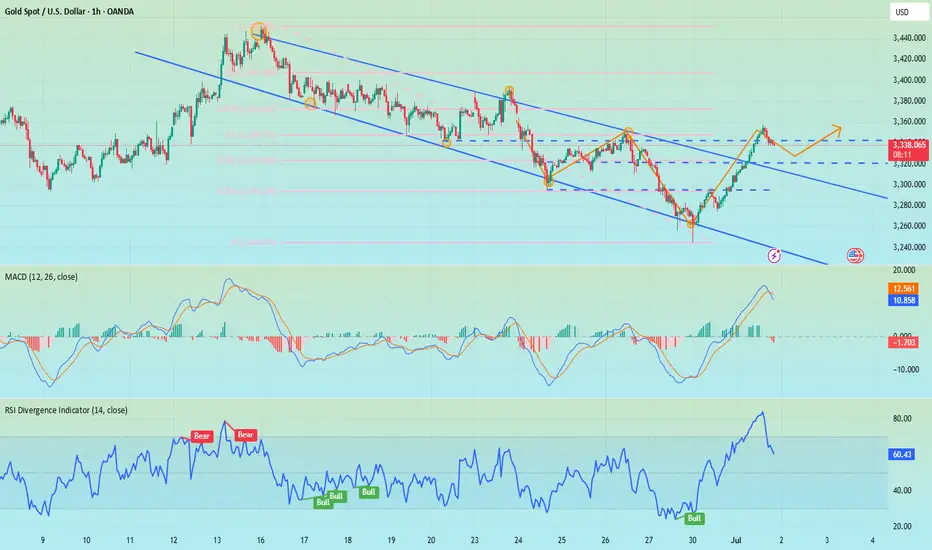
XAUUSD Technical Analysis – 02/07/2025On the 1-hour chart, Gold (XAUUSD) has just confirmed the completion of corrective wave (4) around the 3,328.3 zone, which aligns with the 1.0 Fibonacci level and EMA9 support. Currently, price is rebounding with increasing volume, signaling that buying momentum is returning.
Key Technical Highlights:
Elliott Wave Structure:
Wave (4) found support at 3,328.3.
Wave (5) targets are forming, with Fibonacci extensions pointing to:
0.618: 3,360.05
1.0: 3,380.07
=> These are critical resistance zones to watch.
Fibonacci Retracement Zones:
The current rebound is heading toward the 0.5 and 0.618 retracement levels of the previous down leg, located at 3,362.4 and 3,354.4 – short-term upside targets.
Volume Analysis:
Rising volume on bullish candles confirms a legitimate buying interest, supporting the upward movement.
EMA9 Breakout:
Price has broken above the EMA9 at 3,338.2, shifting short-term trend bias to bullish.
Suggested Trading Strategy:
Favor Buy on Dip entries near the 3,340–3,342 zone if a minor pullback occurs.
Short-term targets: 3,354 – 3,362
Extended target: 3,380
Suggested stop loss below 3,328.0 to manage risk.
Conclusion:
A bullish impulse is forming following the end of wave (4). If price holds above 3,340 and breaks through the nearby Fibonacci resistance levels, wave (5) could extend towards the 3,380 area. This is a pivotal moment to watch for a confirmed short-term uptrend.
ADP data has been released, how to position gold in the future📰 News information:
1. ADP data, for reference of tomorrow's NFP data
2. Interest rate cuts and Powell's dovish comments
3. Geopolitical impact on the gold market
📈 Technical Analysis:
The ADP data was significantly bullish after it was released, but gold did not rise sharply in the short term. Instead, it touched the resistance of 3350 that we gave and then fell back. I also saw a lot of fake traders in the market who immediately told their brothers to go long and look towards 3380 after the ADP data was released. To be honest, I think these people are typical hindsight experts. If everyone is like this, then anyone can be called a trader, right?
Back to the topic, I still hold short orders at 3340-3350. In the short term, gold will fluctuate and be bearish to seek restorative support, so the best place to go long is to look at the retracement below, which will at least touch 3333-3323. If it falls below this support, it will go to 3315-3305. On the contrary, if it gets effective support at 3333-3323, then gold will rebound as expected to form a head and shoulders bottom.
🎯 Trading Points:
SELL 3340-3350-3355
TP 3333-3323-3315-3295
BUY 3335-3325
TP 3345-3355-3375
In addition to investment, life also includes poetry, distant places, and Allen. Facing the market is actually facing yourself, correcting your shortcomings, confronting your mistakes, and strictly disciplining yourself. I hope my analysis can help you🌐.
FXOPEN:XAUUSD PEPPERSTONE:XAUUSD FOREXCOM:XAUUSD FX:XAUUSD OANDA:XAUUSD TVC:GOLD

As expected, it will fall and form a head and shoulders bottom📰 News information:
1. ADP data, for reference of tomorrow's NFP data
2. Interest rate cuts and Powell's dovish comments
3. Geopolitical impact on the gold market
📈 Technical Analysis:
Yesterday we expected gold to retreat to the 3330-3320 area. Today, gold hit a low of around 3328 during the Asian session, which is in line with our judgment of the market trend. In the short term, gold may still fall. First, it may test the 3323 support line. If it falls back to this position during the day, you can try to go long. In the short term, focus on the 3315-3305 long-short dividing line below. If gold gets effective support below, it is expected to form a head and shoulders bottom pattern. The short-term decline will accumulate momentum for the future rise. Pay attention to the ADP data during the NY period
🎯 Trading Points:
BUY 3323-3315-3305
TP 3340-3350-3360-3375
In addition to investment, life also includes poetry, distant places, and Allen. Facing the market is actually facing yourself, correcting your shortcomings, confronting your mistakes, and strictly disciplining yourself. I hope my analysis can help you🌐.
FXOPEN:XAUUSD PEPPERSTONE:XAUUSD FOREXCOM:XAUUSD FX:XAUUSD OANDA:XAUUSD TVC:GOLD
How do we plan before ADP and NFP?📰 News information:
1. ADP data, for reference of tomorrow's NFP data
2. Interest rate cuts and Powell's dovish comments
3. Geopolitical impact on the gold market
📈 Technical Analysis:
The market will continue to fluctuate before the ADP data, and the market will continue to rise after the adjustment. In the 4H cycle, the upper rail of the pressure is temporarily suspended, and the Bollinger Bands also close. This is why I emphasize the need to pay attention to the 3323 support line below. At present, gold rebounded, I think it will touch 3348 at most, that is, it rebounded to 50%. Therefore, before the ADP data, I still hold the position of 3340-3350 for shorting, and find support for long at 3325-3315 below. I have marked the pattern of head and shoulders bottom in the figure. I have been engaged in spot, futures, foreign exchange and other transactions for many years. My analysis ideas can be referred to by brothers
🎯 Trading Points:
SELL 3340-3350
TP 3330-3325-3315-3295
BUY 3323-3315-3305
TP 3340-3350-3360-3375
In addition to investment, life also includes poetry, distant places, and Allen. Facing the market is actually facing yourself, correcting your shortcomings, confronting your mistakes, and strictly disciplining yourself. I hope my analysis can help you🌐.
TVC:GOLD OANDA:XAUUSD FX:XAUUSD FOREXCOM:XAUUSD PEPPERSTONE:XAUUSD FXOPEN:XAUUSD
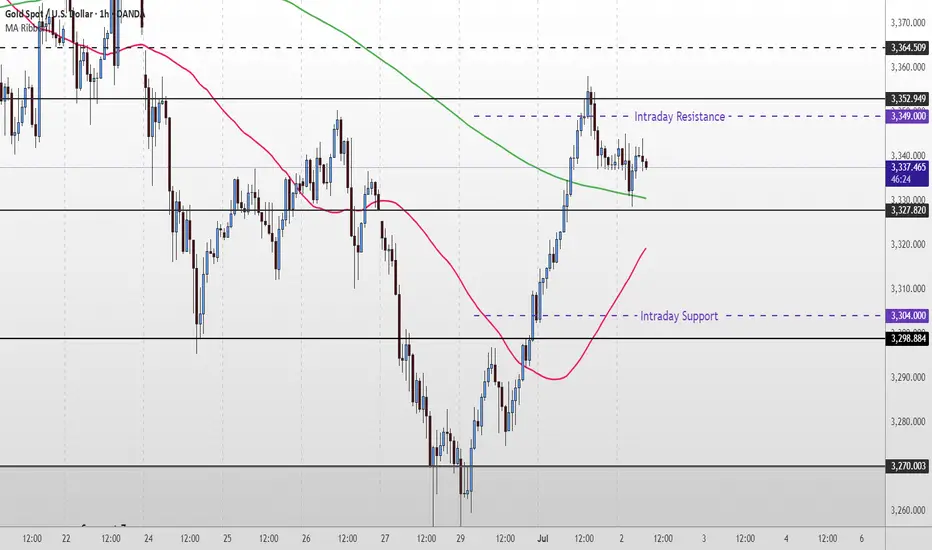
Gold Short Term OutlookYesterday, we saw gold reclaim the 200MA and push into the $3,352 resistance. Price remains supported above the $3,327 level, keeping the bullish structure intact for now.
As long as price holds above $3,327, bulls remain in control, and a breakout above $3,352 could open the path toward $3,364 and $3,383.
However, failure to hold above $3,327 may lead to another retest of $3,298, with deeper downside toward $3,270-$3,41 support zone if that level gives out.
📌 Key Levels to Watch:
Resistance:
$3,352 • $3,364 • $3,383 • $3,400
Support:
$3,327 • $3,298 • $3,270 • $3,241
Gold prices have risen sharply. How should we trade gold?
📣Gold news:
US Senate passes Trump tax reform bill. Trump wins major victory
Trump's signature tax and spending cuts bill passed the Senate on Tuesday. Republican leaders finally convinced dissenting lawmakers after a hard fight, helping Trump win another political victory.
Trump refuses to extend July 9 tariff deadline
US President Trump reiterated on Tuesday that he has no intention of extending the 90-day suspension of reciprocal tariffs on most countries after it expires on July 9.
When asked whether he would extend the suspension of tariffs, Trump replied on Air Force One: "No, I haven't thought about it. I will write to many countries to notify them of the tariff rates they will face."
Gold (XAU/USD) struggled to extend its two-day rally, fluctuating narrowly in the Asian session on Wednesday, just below Tuesday's one-week high. The dollar's slight rebound - from its lowest level since February 2022 - put pressure on gold. Moreover, improving market sentiment continues to weaken demand for safe-haven assets such as gold, further limiting its upside.
⭐️Technical Analysis:
Trend lines are steadily picking up, and continued buying could move towards 3383 based on today's ADP-NF data
💰Set Gold Price:
💰Sell Gold Zone: 3375-3385 SL 3395
TP1: $3370
TP2: $3360
TP3: $3350
💰Buy Gold Zone: $3315-$3310 SL $3305
TP1: $3320
TP2: $3330
TP3: $3340
⭐️Technical Analysis:
Set reasonable buy orders based on technical indicators EMA 34, EMA89 and support resistance areas.
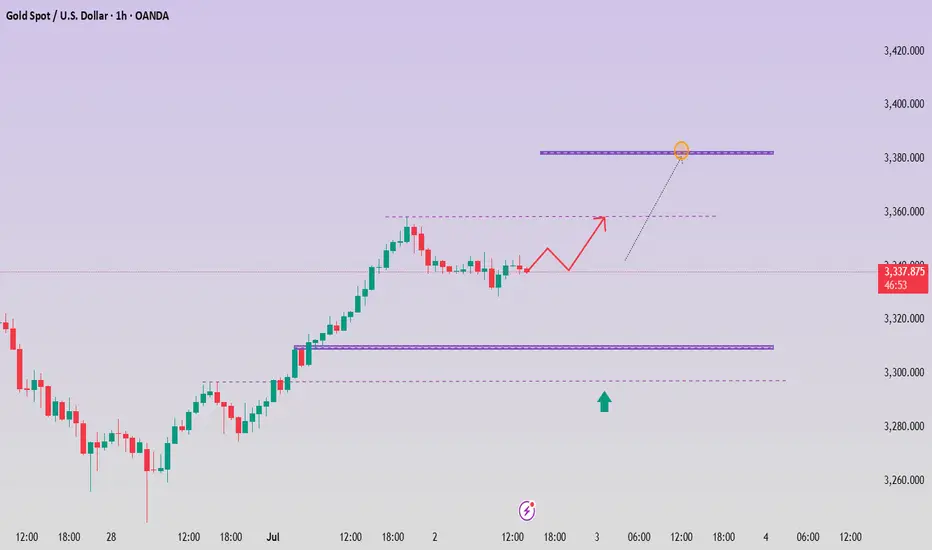
XAUUSD Free Signal: Bullish Breakout!!!Hello everyone.
I’m sharing a trade setup for GOLD.
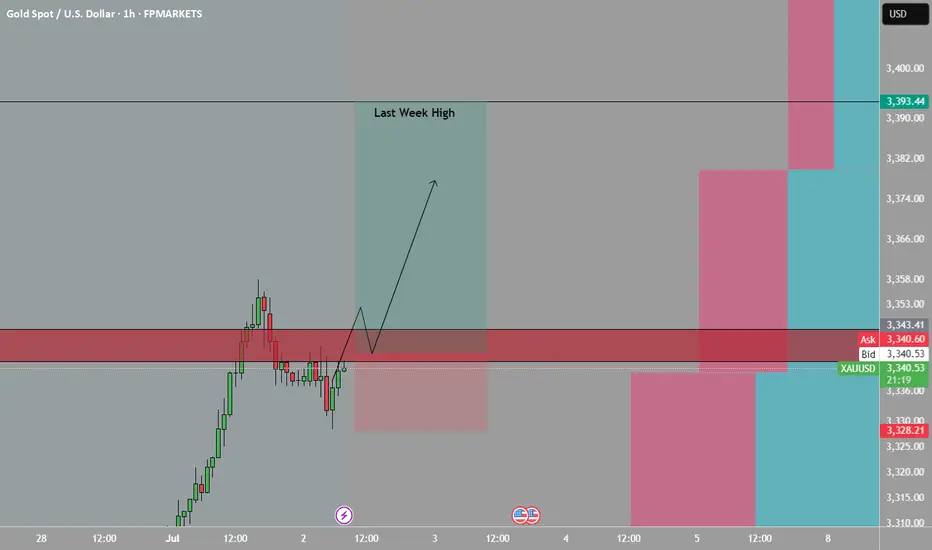
Gold has shown strong bullish momentum this week. Picture is simple, The setup is straightforward: I’m following the gold uptrend, targeting last week’s high.
Type: Buy (Long)
Entry: $3,343 (after price breaks resistance at $3,340)
Stop Loss (SL): $3,328 (below the recent swing high)
Take Profit (TP): $3,393 (targeting last week’s high)
Risk-Reward Ratio: 1:3.3 (risking $15 to gain $50)
This trade offers a high reward, low risk (1:3 risk-reward ratio). Gold shows buyers dominating and sellers weakening. Additionally, the US dollar index (DXY) is in a strong bearish trend. On higher timeframes (1W, 1D), gold’s recent move appears to be a slow correction, supporting my long position.
What do you think of this gold setup? Share your thoughts in the comments! Follow for more free signals, and like if you’re taking this trade!
Disclaimer: This is not financial advice. Trading involves risks. Always do your own research and manage your risk carefully.
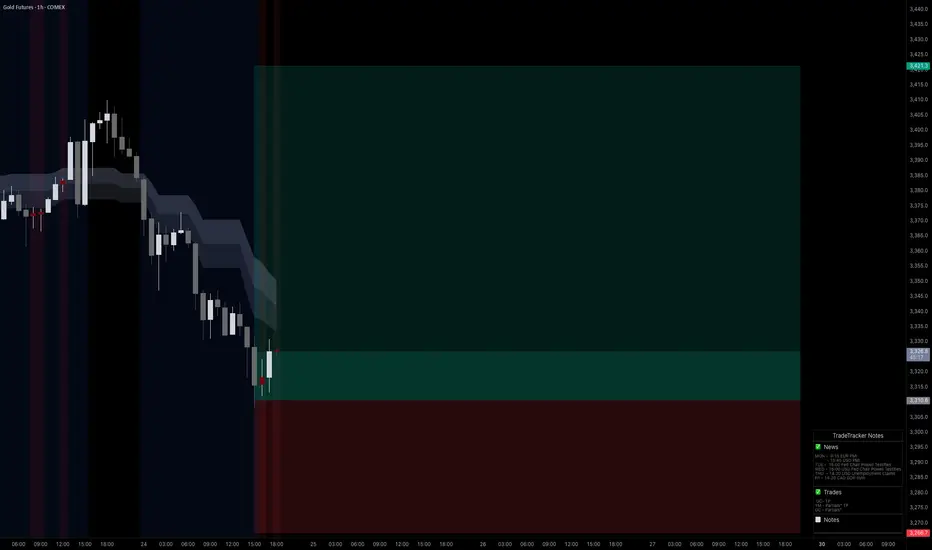
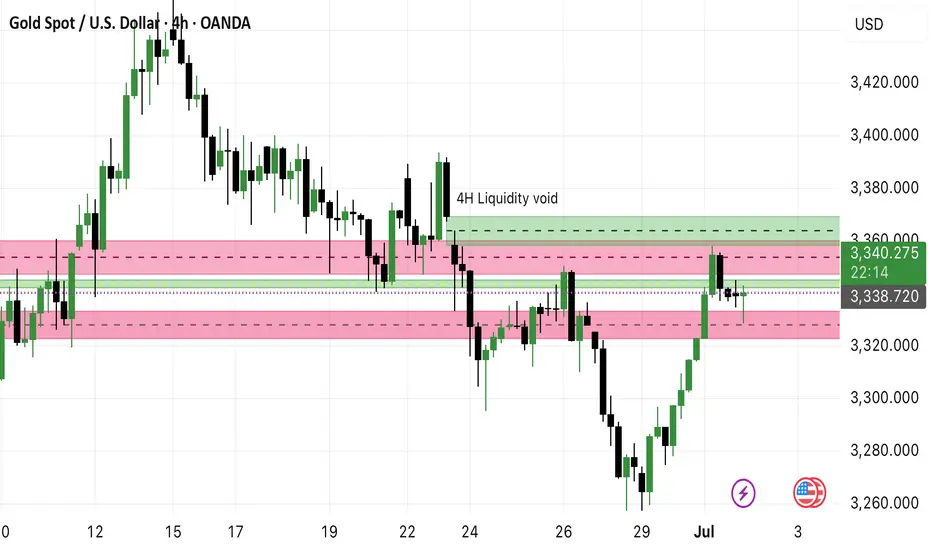
Gold(XAU/USDT) Analysis - Targeting 4H Liquidity VoidOANDA:XAUUSD
**Gold (XAUUSD) Trade Idea 🚀**
**🔍 Setup:**
- Price bounced from **Daily FVG (red)** & is now in **4H FVG (green)** ✅
- Targeting **4H liquidity void at 3400** 🎯
**⚡ Key Levels:**
- **Support:** 3338 / 3320
- **Resistance:** 3360 / 3380 / **3400 (main target)**
**🎯 Plan:**
- **Entry:** Hold above 3341 or pullback to 4H FVG
- **Stop:** Below 3320
- **Target:** 3400
*(Chart attached 👆)*
Liquidity Void: Its an imbalance which has high probability of getting filled
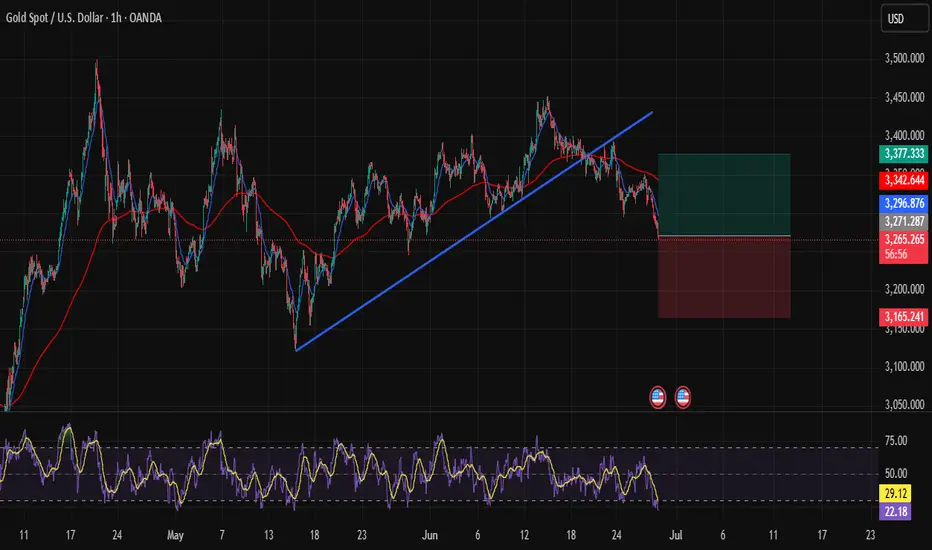
Catching the Perfect Rebound on XAUUSD!Hi traders! , Currently analyzing GOLD (XAUUSD) on the 1H timeframe.
Price has dropped aggressively but is now reacting strongly from a key support zone around 3,271.00, where buyers are stepping in. This area has previously shown significant bullish reactions.
I'm now buying from 3,271.00, expecting a bullish correction towards my target.
Take Profit: 3,377.00
Stop Loss: 3,165.00
RSI is in oversold, indicating potential exhaustion of sellers.
Price may have created a fake breakout below the trendline, trapping liquidity before bouncing back.
Currently managing the trade, watching how price develops around this key area.
Disclaimer : This is not financial advice. This is my personal analysis shared for educational purposes only.
Gold retreats as expected, how to trade in the future📰 News information:
1. Geopolitical situation
2. PMI data
3. Global Central Bank Governors Meeting
📈 Technical Analysis:
Our short orders have achieved profits. I closed the position near 3337, turning losses into profits. Interested friends can follow my previous post. In the short term, I am still optimistic that gold will retreat below 3335-3325. Today, gold rose sharply, and the rebound momentum was strong, while the short-term correction was slightly weak, so the space for a second decline in the short term will be limited. If it falls to the 3333-3323 range during the day and gets effective support, you can consider going long. The short-term upper resistance is 3360-3375.
🎯 Trading Points:
BUY 3333-3323-3315
TP 3341-3355-3360-3375
In addition to investment, life also includes poetry, distant places, and Allen. Facing the market is actually facing yourself, correcting your shortcomings, confronting your mistakes, and strictly disciplining yourself. I hope my analysis can help you🌐.
TVC:GOLD OANDA:XAUUSD FX:XAUUSD FOREXCOM:XAUUSD PEPPERSTONE:XAUUSD FXOPEN:XAUUSD
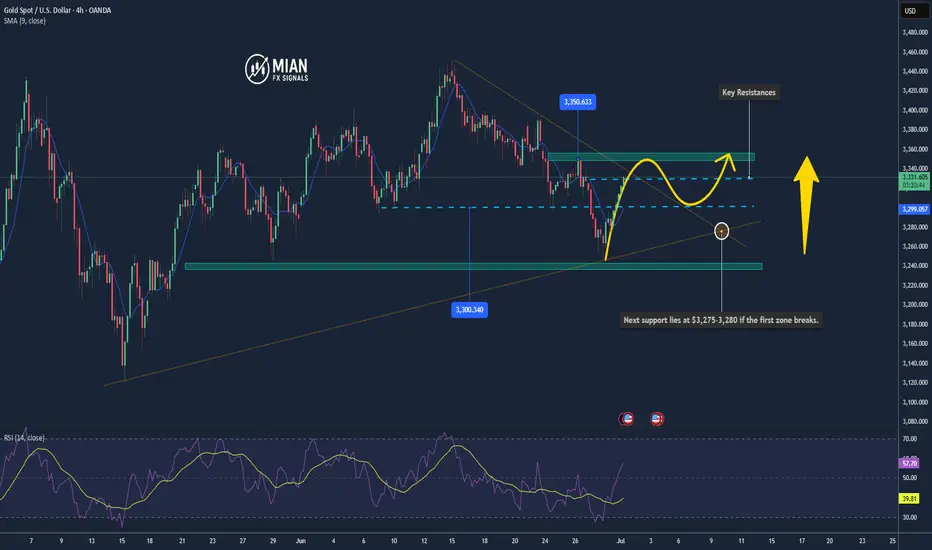
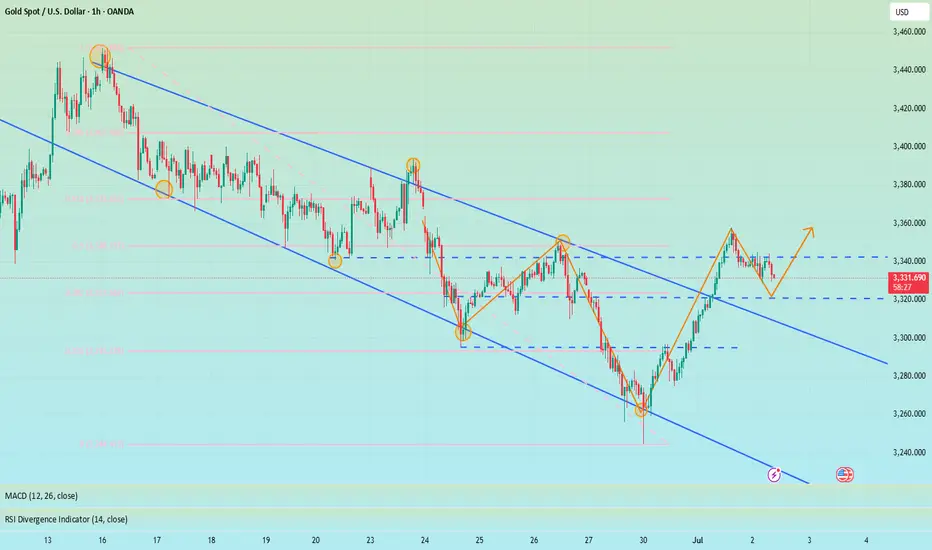
Gold Might Break Higher As It Hits $3,330 Resistance📊 Market Drivers
Gold has just climbed to $3,330/oz, supported by ongoing safe-haven demand and a slightly weaker U.S. dollar ahead of Fed Chair Powell’s speech. Investor expectations of a rate cut in September are keeping bullish momentum alive.
________________________________________
📉 Technical Analysis
• Resistance:
→ $3,330–3,335 (50-day SMA & Fibonacci level)
A breakout above $3,335 could open the door to $3,350+.
• Support:
→ $3,300–3,310 (psychological level & EMA9)
→ Next support lies at $3,275–3,280 if the first zone breaks.
• EMA09:
Price is currently above the 9-EMA, confirming a short-term bullish trend.
• Momentum Indicators:
o MACD is bullish; Stochastics is high — all signaling upside, though a short-term pullback may occur if the resistance holds.
________________________________________
📌 Outlook
Gold is likely to continue climbing in the short term if it breaks above the $3,330–$3,335 resistance zone, fueled by bullish sentiment and dovish Fed expectations.
If it fails to break higher, a minor correction toward $3,300–$3,310 could follow.
________________________________________
💡 Suggested Trade Strategy
BUY XAU/USD : $3,320–3,325
🎯 TP: 40/80/200 pips
❌ SL: $3,310
SELL XAU/USD : $3,340–3,345
🎯 TP: 40/80/200 pips
❌ SL: $3,350