The latest analysis and layout of gold in July made a good start📰 News information:
1. Geopolitical situation
2. PMI data
📈 Technical Analysis:
Yesterday, we gave the idea of looking at the upper resistance of 3310-3320. The 4H pressure is still at 3327. As long as this key resistance level is not effectively broken, gold will fall again. On the contrary, if it stabilizes above 3327, the trend may reverse. In the short term, pay attention to the upper resistance of 3327. If it is not broken, you can short with a light position. If it falls below 3300-3290, consider going long.
🎯 Trading Points:
SELL 3310-3320
TP 3305-3300
BUY 3300-3290
TP 3310-3320-3350
In addition to investment, life also includes poetry, distant places, and Allen. Facing the market is actually facing yourself, correcting your shortcomings, confronting your mistakes, and strictly disciplining yourself. I hope my analysis can help you🌐.
TVC:GOLD FXOPEN:XAUUSD PEPPERSTONE:XAUUSD FOREXCOM:XAUUSD OANDA:XAUUSD TVC:GOLD
Goldlong
The limit is 3320. Rebound and still short📰 News information:
1. Gold market liquidity at the end of the month
2. Impact of geopolitical situation
📈 Technical Analysis:
Currently, gold has rebounded to around 3295, reaching our ideal trading area. I have given the short-selling trading idea in the previous post. At present, in the short term, we still maintain the short-selling trading idea before effectively breaking through the upper resistance. Focus on the 3325 line of resistance
🎯 Trading Points:
SELL 3295-3310-3320
TP 3285-3270
In addition to investment, life also includes poetry, distant places, and Allen. Facing the market is actually facing yourself, correcting your shortcomings, confronting your mistakes, and strictly disciplining yourself. I hope my analysis can help you🌐.
OANDA:XAUUSD FOREXCOM:XAUUSD FX:XAUUSD PEPPERSTONE:XAUUSD FXOPEN:XAUUSD TVC:GOLD
XAUUSD/GOLD Geopolitical conflicts have escalated again. Next week is a week of heavy news. How will the gold price focus next week? How to trade? Look at the news preview first.
1. Geopolitics, Russia-Ukraine conflict, Palestine-Israel conflict, Iran-Israel conflict.
2. ADP data, NFP data.
3. Tariff deadline.
The above three news are enough to cause drastic fluctuations in the gold price.
On Friday, the New York market followed my expectations. After rebounding around 3282, it fell back. Finally closed around 3274.
The impact of the weekend news is huge. From the news perspective, the opening price of next Monday will be higher than the closing price on Friday. In terms of operation, you can pay attention to buying at a low price after the market opens.
Go long on dips and short on rallies📰 News information:
1. Gold market liquidity at the end of the month
2. Impact of geopolitical situation
📈 Technical Analysis:
Last week we predicted that gold would rebound. Today, after gold rebounded as expected, we gave a short trading strategy. Gold fell precisely at the point we gave, 3295, and successfully hit our TP3280-3270. The result confirmed the correctness of our trading strategy. Next, we will focus on the long trading opportunities below 3270-3260.
🎯 Trading Points:
BUY 3270-3260
TP 3290-3300
SELL 3295-3300-3310
TP 3280-3270
In addition to investment, life also includes poetry, distant places, and Allen. Facing the market is actually facing yourself, correcting your shortcomings, confronting your mistakes, and strictly disciplining yourself. I hope my analysis can help you🌐.
TVC:GOLD FXOPEN:XAUUSD PEPPERSTONE:XAUUSD FX:XAUUSD FOREXCOM:XAUUSD OANDA:XAUUSD
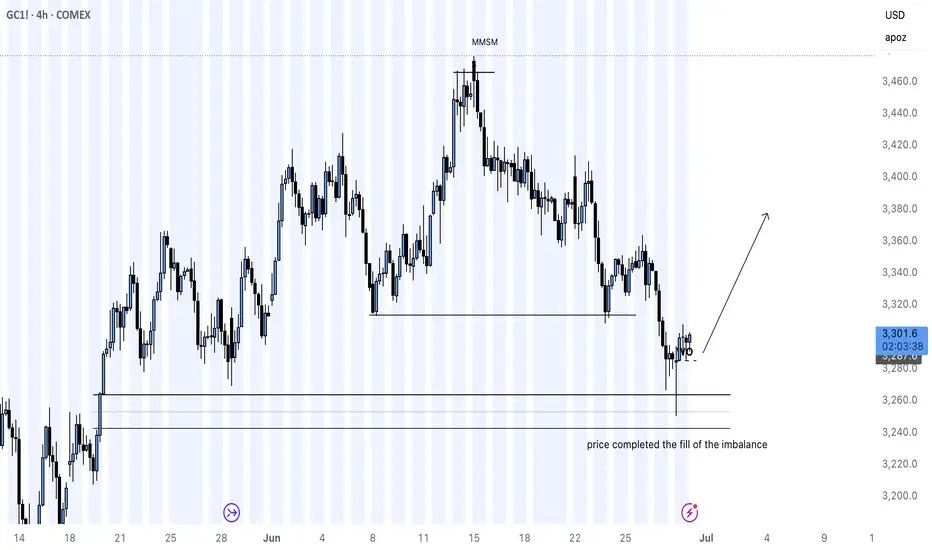
GOLD LONG IDEA MARKET STRUCTURE CHANGEgold futures were on a full sell off due to ongoing global turbulence in the month of June macro news is there to show the bigger picture but price tells the full story
imbalance was filled and the week opened with a bearish candle closing above 3,250 COMEX:GC1! price range now it is time to see It play out to the buyside for the precious metal
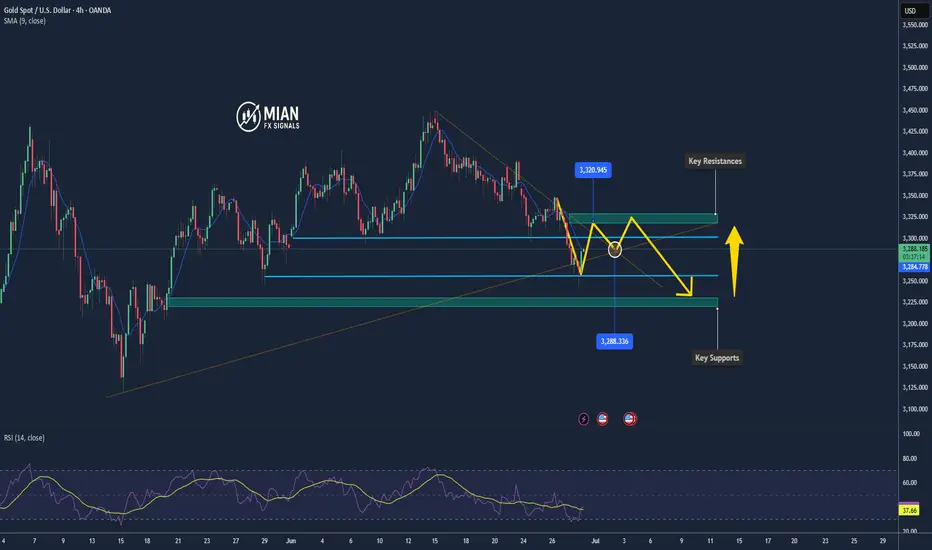
Gold Faces Resistance Near $3,300 Ahead of U.S. Jobs Data📊 Market Highlights:
Gold holds firm above $3,280 supported by expectations of future Fed rate cuts, but upside momentum has stalled as traders await this Friday’s U.S. jobs report. A slight rebound in the U.S. dollar and elevated bond yields are pressuring gold in the short term.
📉 Technical Analysis:
• Key Resistances:
– $3,300 (strong psychological and profit-taking level)
– $3,320 (last week’s high – potential heavy selling zone)
• Key Supports:
– $3,255 (short-term dynamic support – EMA 09)
– $3,230 (major support from previous breakout structure)
• EMA 09: Price remains above the 09 EMA → trend still bullish
• Momentum: The bullish momentum is weakening. A shooting star candle near $3,300 and RSI approaching overbought territory (>70) suggest a possible short-term correction.
📌 Outlook:
Gold may retreat to $3,255 or lower if it fails to break above the $3,300–$3,320 resistance zone. However, the overall bullish trend remains intact as long as price holds above $3,230.
💡 Suggested Trade Setup:
🔻 SELL XAU/USD at: $3,295 – $3,300
🎯 TP: 40/80/200 pips
❌ SL: $3,305
🔺 BUY XAU/USD at: $3,255 – $3,260
🎯 TP: 40/80/200 pips
❌ SL: $3,245
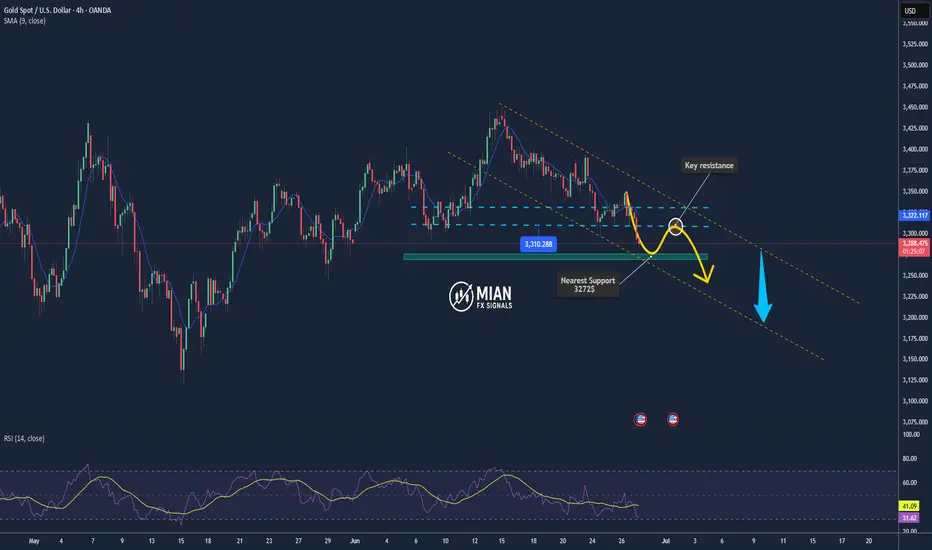
Analysis and layout of gold trend at the end of the month📰 News information:
1. Gold market liquidity at the end of the month
2. Impact of geopolitical situation
📈 Technical Analysis:
From the beginning of the decline of gold near 3338 on Friday to today's lowest point near 3244, gold has fallen by nearly $94. At present, gold has rebounded as expected. In the short term, I think we have two key areas to pay attention to. The first is the position of 3290-3295, which is a 50% rebound, and the second is the upper top range limit range of 3300-3320. Of course, if it breaks through 3280 and then retreats, it can also be long twice, but the current price rebounds, considering the position of the temporary low long position, there is not much trading opportunity. First look at the key areas given to find opportunities for shorting, and pay attention to the opportunity of retreating to 3280-3270 below.
🎯 Trading Points:
SELL 3290-3295
TP 3380-3370
SELL 3300-3310-3320
TP 3290-3280-3270
BUY 3270-3260
TP 3290-3300
In addition to investment, life also includes poetry, distant places, and Allen. Facing the market is actually facing yourself, correcting your shortcomings, confronting your mistakes, and strictly disciplining yourself. I hope my analysis can help you🌐.
OANDA:XAUUSD FOREXCOM:XAUUSD FX:XAUUSD PEPPERSTONE:XAUUSD FXOPEN:XAUUSD TVC:GOLD
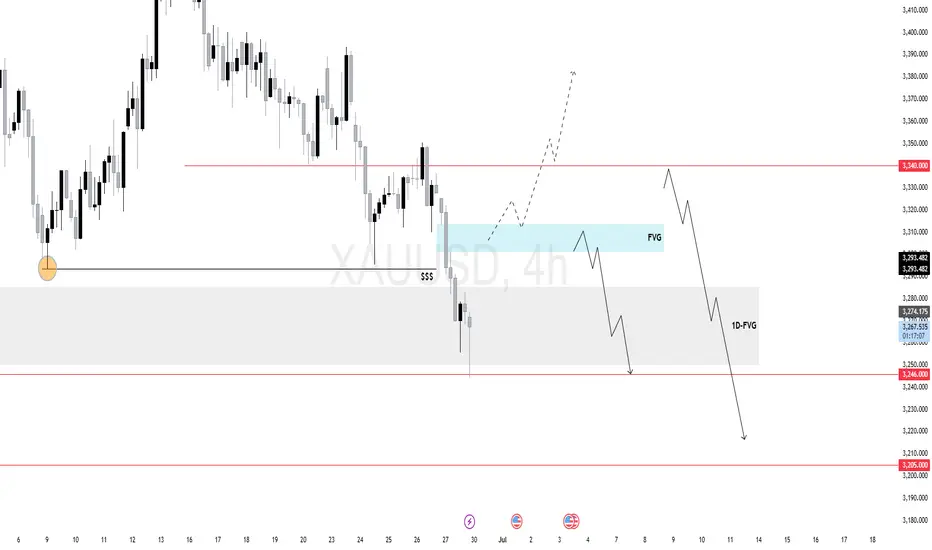
$XAU (XAUUSD) 4H forecastGold swept short-term sell-side liquidity and tapped into a daily FVG, where price is currently consolidating.
The 4H chart shows two potential paths:
Retrace Scenario: Price may rally short-term into the 4H FVG zone for a premium-based entry — ideal area for shorting continuation aligned with the bearish daily and weekly narrative.
Immediate Breakdown: If price rejects at current levels, a continuation toward the 3246 and 3205 daily draw-on-liquidity zones is likely.
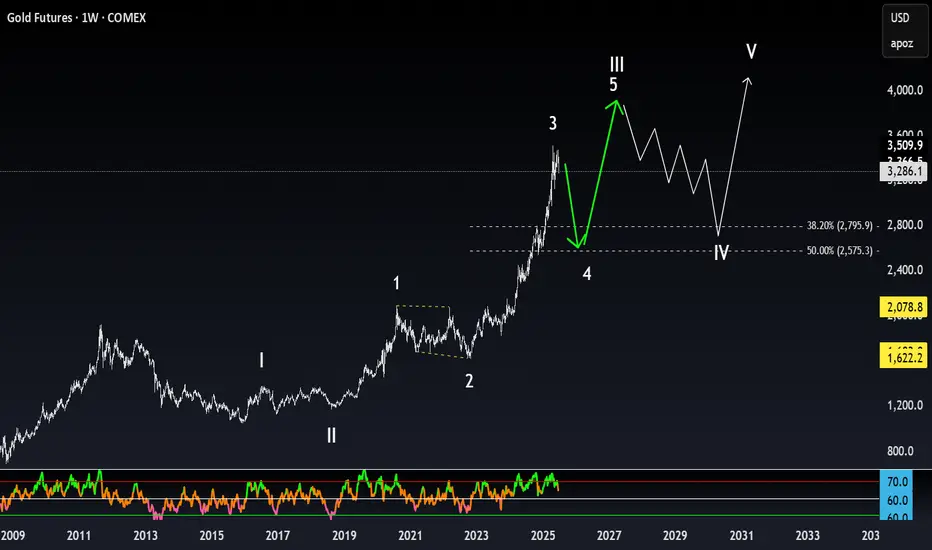
Navigating Gold Futures: Support, Resistance, and ProjectionsCOMEX:GC1!
The chart appears to depict a clear five-wave pattern: I, II, III, IV, and V.
Waves I to III show strong upward movements, indicating bullish sentiment.
Wave IV looks like it could be a corrective phase, with a potential dip before another upward movement in Wave V.
Support and Resistance Levels:
The horizontal lines around 2,800 and 2,575.3 indicate critical Fibonacci retracement levels (38.20% and 50%).
If the price approaches these levels during the correction, they could serve as support, making it a potential buying opportunity.
RSI Indicator:
From the bottom indicator (RSI), we can see fluctuations in momentum, which can aid in timing trades.
Look for interpretations of the RSI: if it trends towards the extremes (overbought/oversold), that could signal reversal points.
Future Projections:
Should the market respect the outlined support levels, Wave V could potentially push towards a new high above 4,000 as indicated by the upward projection.
Market Sentiment:
Overall, the pattern suggests a bullish outlook long-term, but caution is warranted during corrective phases as prices might retrace towards support levels.
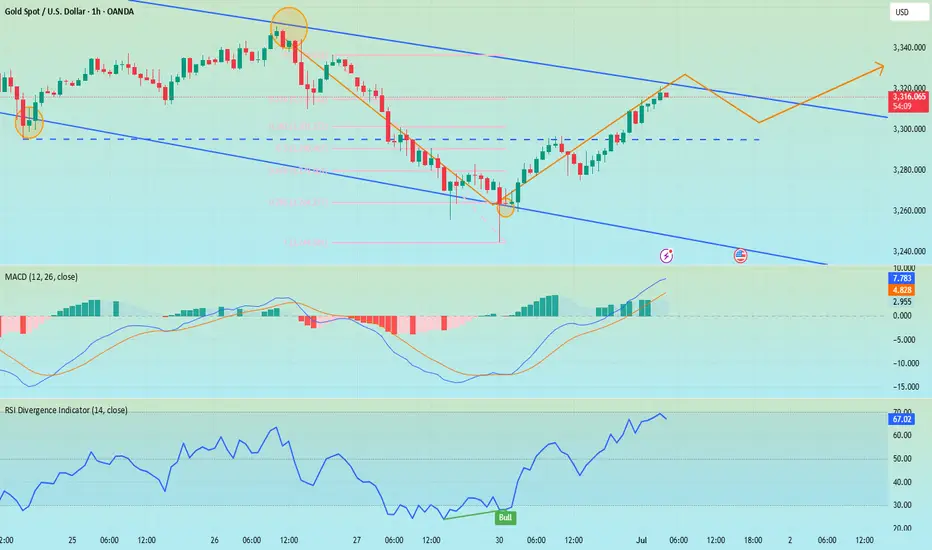
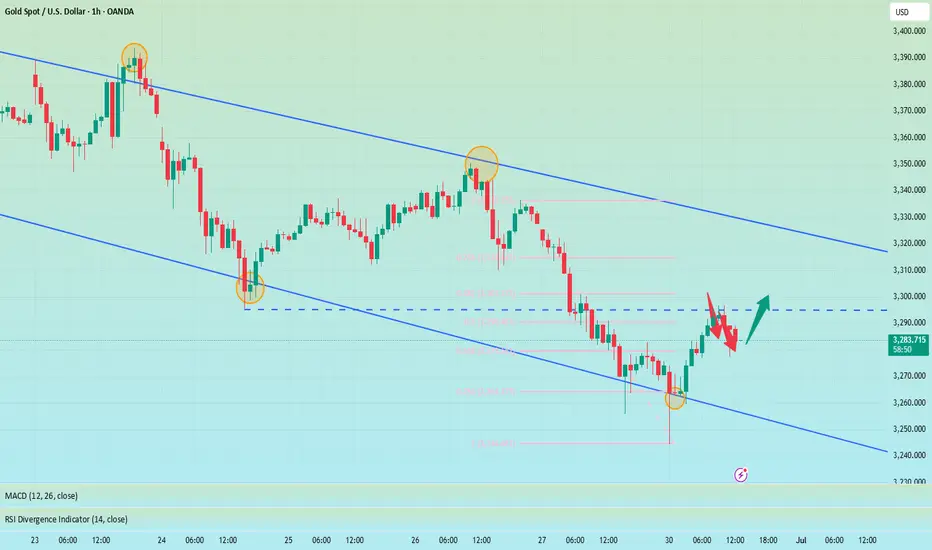
Gold Rebounds After Filling Gap >> Bullish Continuation in SightHello guys!
Gold (XAU/USD) is showing signs of strength on the 4H chart after filling a key gap around the $3,290 level and bouncing off it with bullish intent.
🔹 What I see:
– Price previously broke out of a broad descending channel, flipping the structure bullish
– After forming a rising wedge, Gold corrected lower and filled the gap
– The zone around $3,290 acted as solid support, and the current bounce suggests bulls are regaining control
📈 Outlook:
If this bounce holds and momentum builds, the next area of interest is clearly marked:
🎯 First Target: $3,466 – an area of prior structure and possible supply
📍 Current Price: $3,329
🟢 Bias: Bullish (above $3,290)
🔴 Invalidated below: $3,244
This setup offers a favorable risk-to-reward opportunity if the structure continues holding. Keep an eye on price action near the recent local highs for confirmation.

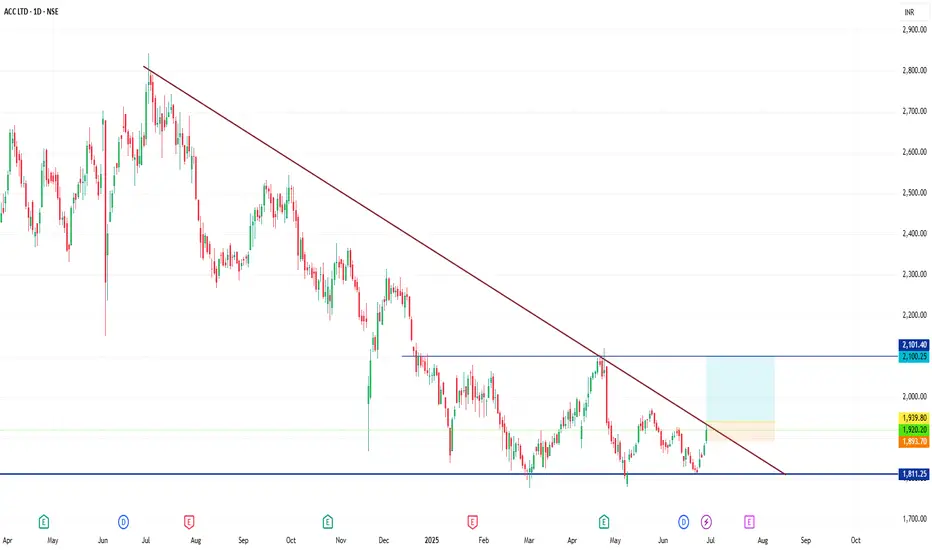
XAUUSD ( Gold) ( RFI Level entry) We need to wait for a test of this RFI level, as well as a confirmed break inside it on the lower timeframes. Otherwise, let the price go without us.

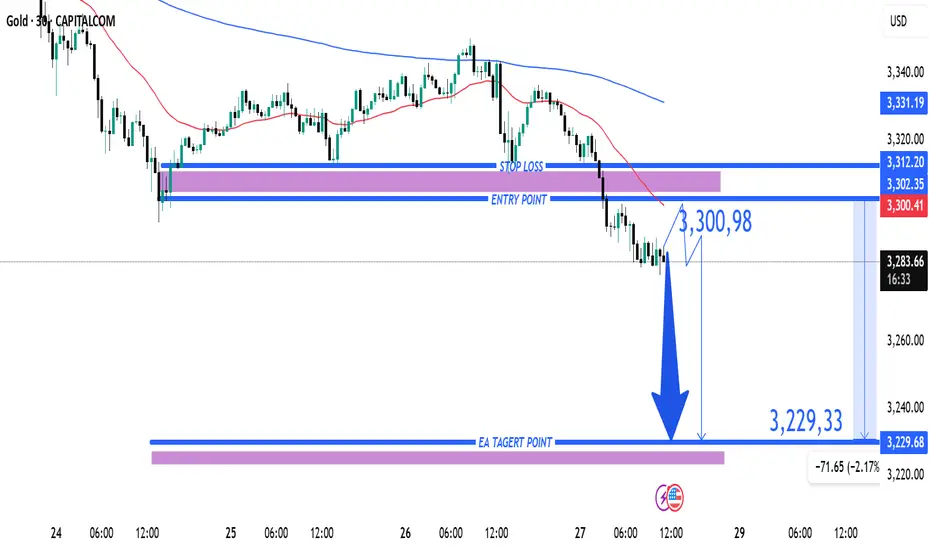
Gold (XAU/USD) Bearish Trade Setup – June 27, 2025Entry Point: Around 3,300.98 USD
Stop Loss (SL): ~3,312.20 USD
Take Profit (TP): 3,229.33 USD
Current Price: 3,286.15 USD
Risk-Reward Ratio: ~1:6.3
(Potential reward ≈ 71.65 pts; risk ≈ 11.22 pts)
Technical Breakdown:
Trend:
The price is in a short-term downtrend, supported by:
Lower highs and lower lows.
Price trading below both 50 EMA (red) and 200 EMA (blue), confirming bearish momentum.
Bearish Breakout:
Price broke below a key support-turned-resistance zone near 3,300–3,302, triggering sell pressure.
Resistance Area:
Strong rejection at 3,302–3,312 zone, which is now acting as resistance.
SL is placed just above this zone to protect against false breakouts.
Target Zone:
TP set at 3,229.33, aligning with a previous support zone — a logical area for price to react.
Strategy Notes:
Bias: Bearish
Entry confirmation: Already triggered.
Risk Management: SL placement is tight and strategic; RR ratio is highly favorable.
Next support below TP: If 3,229 breaks, further downside could follow.
Summary:
This setup shows a well-defined bearish continuation with a clean break of support, a controlled SL above resistance, and a strong RR ratio. A suitable trade for trend-following strategies, but price must not retrace above 3,312 for this idea to remain valid.
Gold Trade Setup - 27/Jun/2025Hi Traders,
I expect this pair to go Up after finishing the correction.
1) Need to wait for market to show changing of the direction.
2) The current move can be just a part of a correction or an impulse in itself. Going to follow the market behavior at my zones.
How to Enter : Look for engulfing with in the SL zone.

XAUUSD/GOLD/SellThe pressure from the bears is too great. In the end, the pressure from above was not broken. Instead, it broke out and fell after being under pressure. The stop loss was hit.
The current price is 3285. After gradually boosting the US dollar index. The trend of gold prices has continued to fall. More importantly, the tariff issue has been eased. At the same time, geopolitical factors are also orderly and stable. This is the news that caused the bears to attack.
History has not become the savior because of repeating itself. Of course, this is also an emergency. In some transactions, the extremely low probability of causing losses is a common problem in transactions. However, our analysis team has stabilized a high trading win rate.
Then the next trading plan is still to focus on the pressure from above. If the London market rebounds above 3300. It is still mainly selling. 3314 is an important level for short-term rebound, and we need to pay attention. Although there is no obvious sign of rebound yet, the release of short-selling pressure has been alleviated because the decline is slow. Today's main trading idea is still to sell at high levels.
The target is to focus on the position of 3264-3248. Remember the risk of buying at low levels. Do not trade independently.
Gold fluctuates, operate at the right time!
💡Message Strategy
Trump called Powell "terrible" and said he was considering three or four candidates to replace Powell. Meanwhile, the Wall Street Journal reported that Trump was even considering announcing a potential successor as early as September or October.
The current mainstream narrative in the market is that once Trump nominates a new Fed chairman, market expectations will tend to favor a more "dovish" Fed. This in turn could lead to a weaker dollar, higher U.S. long-term Treasury yields, and higher stock prices.
Powell testified before the U.S. Senate on Wednesday that while Trump's tariffs could trigger a one-off price increase, the risk of sustained inflation is significant enough for the Fed to be cautious about further rate cuts.
Markets are now focused on U.S. GDP data due out that day and will closely watch personal consumption expenditures (PCE) data on Friday for further clues on whether the Fed will cut rates.
On the geopolitical front, a ceasefire between Israel and Iran appeared to hold on Wednesday. Trump hailed the swift end to the 12-day conflict at a NATO summit and said he would seek a commitment from Iran to abandon its nuclear ambitions in talks next week.
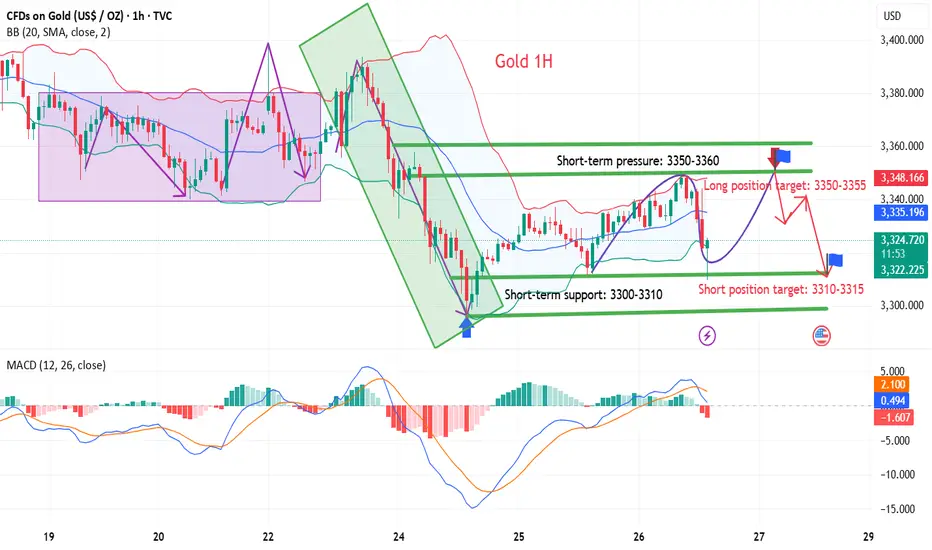
📊Technical aspects
From the 1-hour analysis, the upper resistance is around 3350. The intraday rebound relies on this position to continue the main short-term decline. The lower short-term support focuses on the 3300-3310 integer mark, and the upper pressure focuses on the 3350 mark.
The overall support relies on this range to maintain the main tone of high-altitude low-multiple cycle participation. The short-term long-short strength and weakness watershed is 3370. It is difficult to say that it is strong before the daily level breaks through and stands on this position. Pay attention to the specific operation strategy in time.
💰Strategy Package
Short Position:3340-3350,SL:3320,Target: 3310-3300
Long Position:3310-3320,SL:3290,Target: 3350-3360
Waiting for data release to rebound and short📰 Impact of news:
1. PCE and Consumer Index
📈 Market analysis:
The current price of 3280 has a higher profit and loss ratio advantage. Technical indicators show that the hourly chart is severely oversold. Combined with the top and bottom conversion of 3300 above, there is a 20-point rebound space in the short term. If the PCE data is in line with the trend, gold prices are expected to quickly regain the 3,300 mark. Note that negative data beyond expectations may cause a brief decline.
🏅 Trading strategies:
BUY 3295-3280-3275
TP 3298-3300-3310
SELL 3300-3310
TP 3290-3280-3260-3250
If you agree with this view, or have a better idea, please leave a message in the comment area. I look forward to hearing different voices.
TVC:GOLD FXOPEN:XAUUSD FOREXCOM:XAUUSD FX:XAUUSD OANDA:XAUUSD
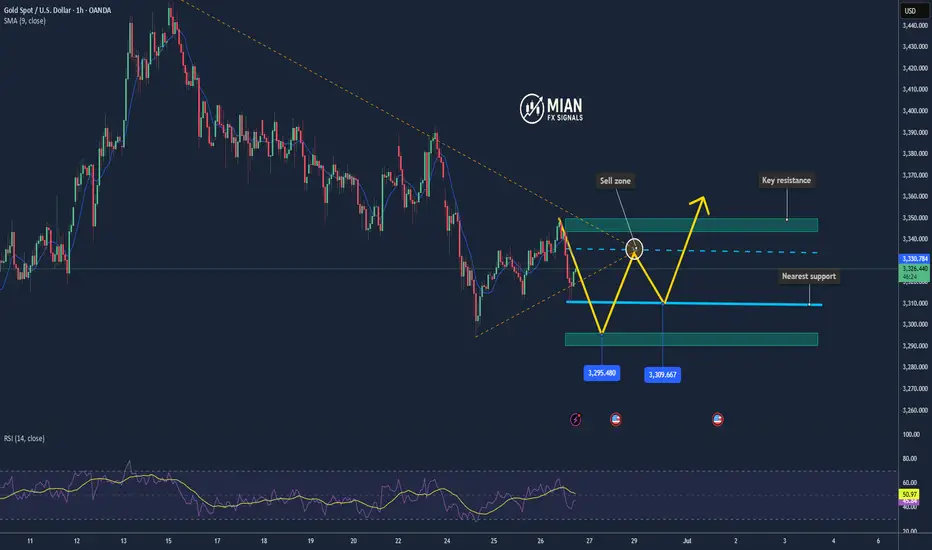
Gold Drops Sharply – Breaks Below the $3,300 Support📊 Market Overview:
Gold has plunged to $3,290/oz, breaking the key psychological level of $3,300 as the US dollar strengthened and Treasury yields ticked higher. Market sentiment has turned defensive ahead of Friday’s US PCE inflation data, with expectations that the Fed may maintain its hawkish stance for longer.
📉 Technical Analysis:
• Key Resistance: $3,310 – $3,325
• Nearest Support: $3,285 – $3,272
• EMA09: Price is currently below the 9-period EMA, confirming short-term bearish momentum.
• Candlestick / Volume / Momentum:
o H1/H4 charts show a series of long bearish candles, with rising volume → strong selling signal.
o RSI is approaching oversold levels (~28), MACD remains in a widening bearish divergence → downward pressure is still dominant.
📌 Outlook:
Gold is in a clear downtrend and may extend its decline toward $3,285 – $3,272 unless a reversal is triggered by weaker-than-expected PCE data or renewed geopolitical tensions. In the near term, any technical rebound is likely to offer sell opportunities rather than a trend reversal.
💡 Suggested Trade Setup:
🔻 SELL XAU/USD
• Entry: $3,300 – $3,305 (on technical retracement)
• 🎯 TP: $3,285 – $3,272
• 🛑 SL: $3,315
🔺 BUY XAU/USD (high risk)
• Entry: $3,272 – $3,277 (short-term bottom catching)
• 🎯 TP: $3,295 – $3,305
• 🛑 SL: $3,262
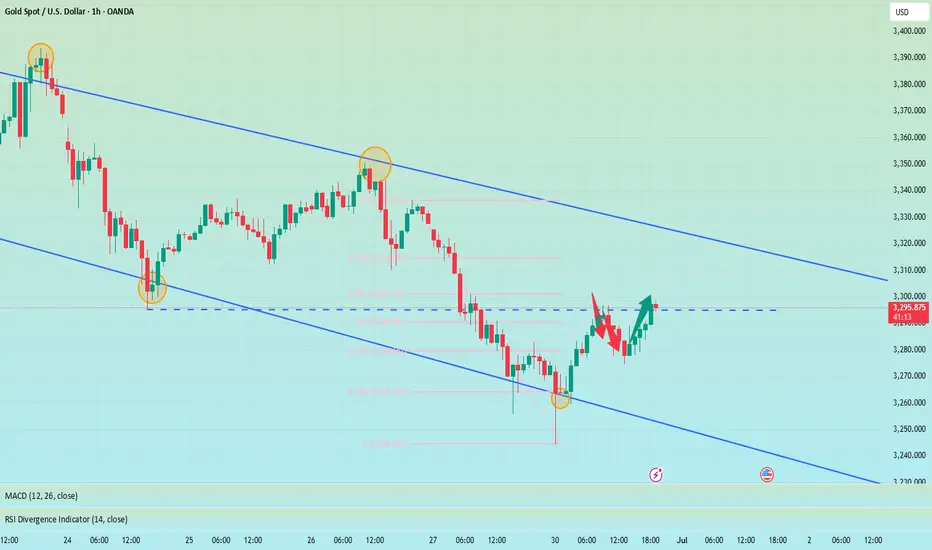
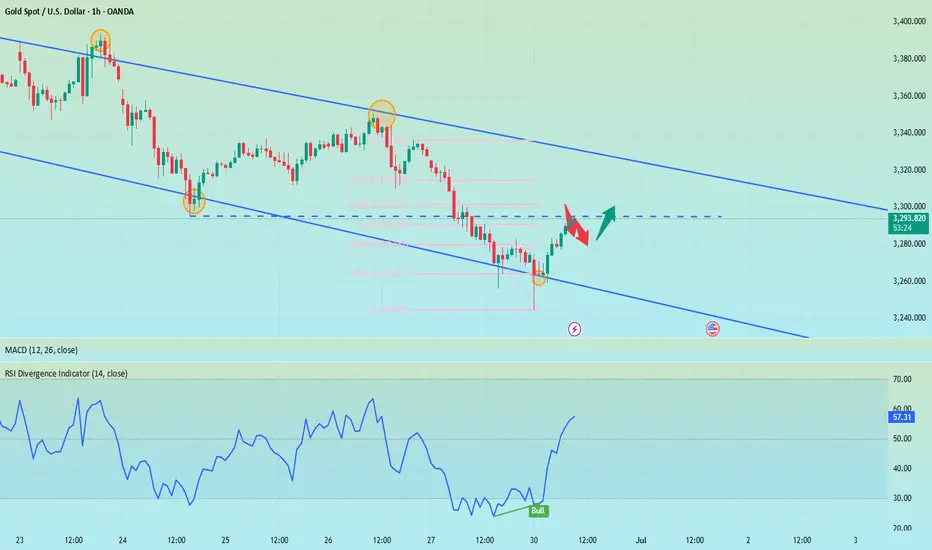
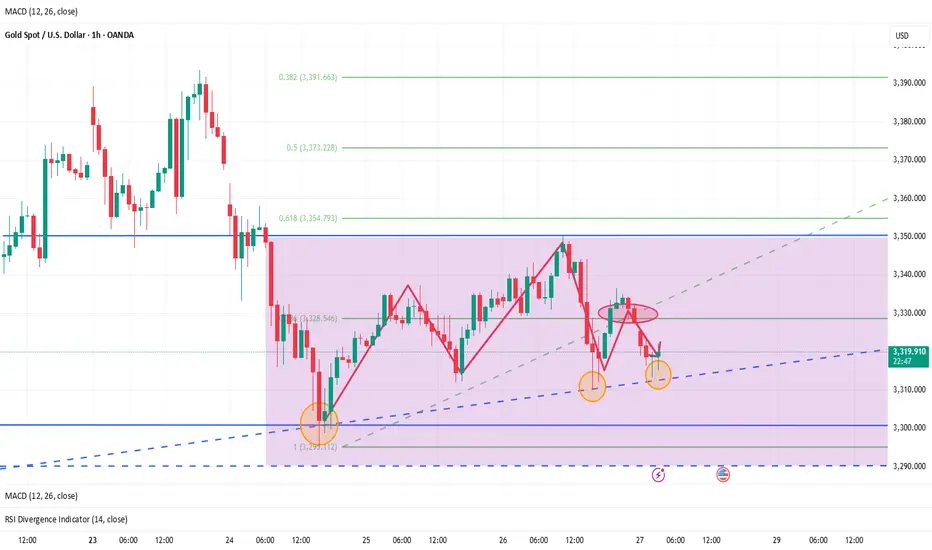
XAU/USD – Bullish Reversal in Motion? Watch the Breakout ZoneGold just gave us a critical reaction off a key confluence zone — and bulls might finally be waking up. Here's the breakdown:
🔹 Falling Wedge Breakout:
Price respected the wedge support beautifully around the 0.382-0.5 Fib retracement and has now closed above the upper descending trendline. The falling wedge is a bullish reversal pattern, and we may be witnessing the early stages of a trend shift.
🔹 EMAs Realignment Pending:
Price is now testing the 20 and 50 EMAs — a clean break and close above them would likely trigger algorithmic momentum back into bullish continuation, especially if we see a flip of the 0.382 Fib at $3,324 as support.
🔹 Upside Targets:
* TP1: $3,372 (0.236 Fib)
* TP2: $3,450 (previous structure high)
* TP3: $3,539 (full range expansion)
🔹 Invalidation Below:
A break back inside the wedge and below $3,285 would invalidate the bullish bias and likely open the path to deeper correction toward $3,251 or even $3,217.
📌 Key Insight:
The best trades aren’t about prediction — they’re about preparation. This setup is all about reacting to price as it confirms. Let the market tell you when it’s ready to move, then strike with confidence and precision.
💡 Watching for bullish retest + volume confirmation before entering long.

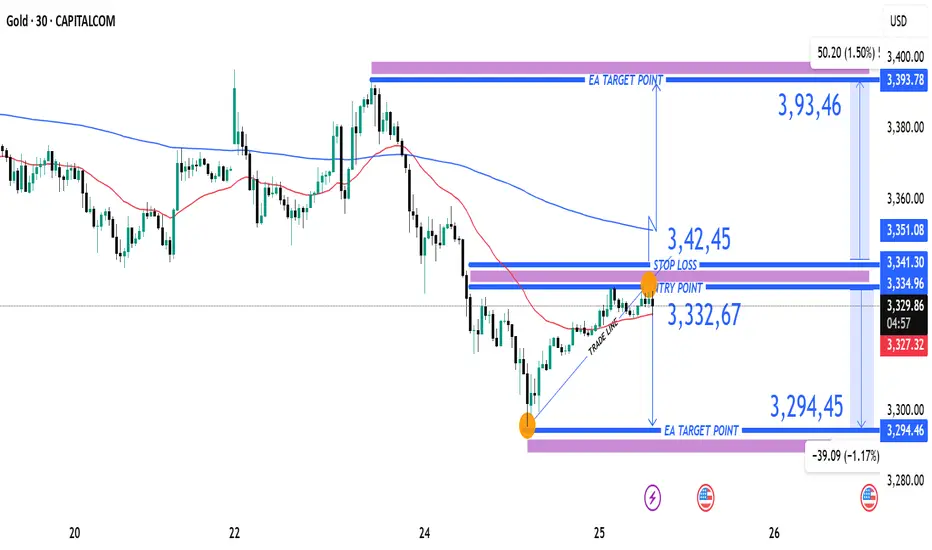
XAUUAD Reversal Setup Short Trade Opportunity Below Resistance Current Price: 3,327.56 USD
Entry Point: 3,332.67 USD
Stop Loss: 3,342.45 USD
Take Profit Levels:
Target 1 (Downside): 3,294.45 USD (-1.17%)
Target 2 (Upside): 3,393.78 USD (+1.50%)
🔧 Technical Indicators & Tools
Trade Line: Upward sloping trendline connecting higher lows, supporting recent bullish structure.
Moving Averages:
Red: Short-term (likely 50-period EMA)
Blue: Long-term (likely 200-period EMA)
Price is still trading below the long-term MA, suggesting broader bearish pressure.
Resistance Zone: 3,334.96–3,341.30 — a key supply area marked in purple.
Support Zone: 3,294.45 — identified as a previous demand level.
⚖️ Risk-Reward Analysis
Short Setup:
Entry: 3,332.67
Stop Loss: 3,342.45 (Risk ~10 USD)
Target: 3,294.45 (Reward ~38 USD)
R:R Ratio ≈ 1:3.8, which is favorable for a short trade.
📌 Summary
Bias: Bearish intraday
Setup Type: Short-sell at resistance zone
Confirmation: Price rejection or bearish candle near 3,334–3,342 zone
Invalidation: Break and close above 3,351.06 (upper resistance)
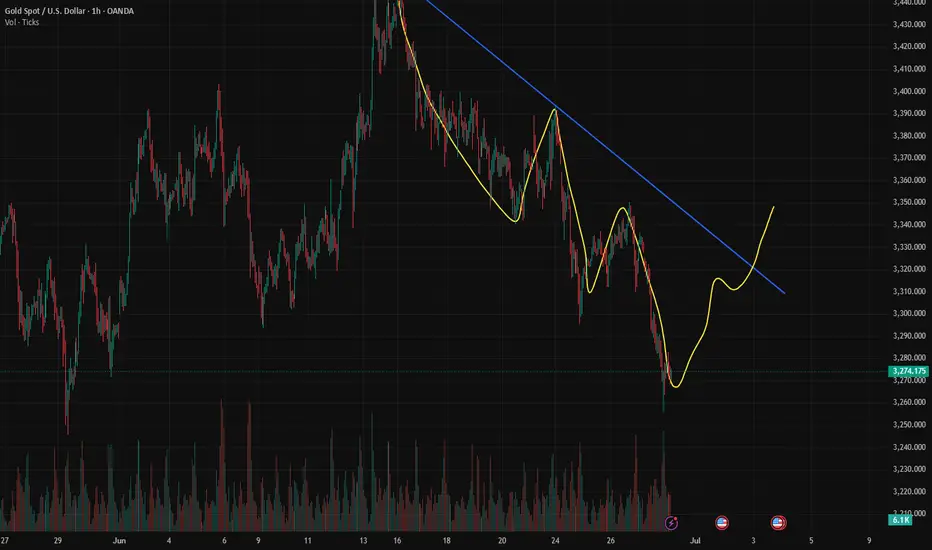
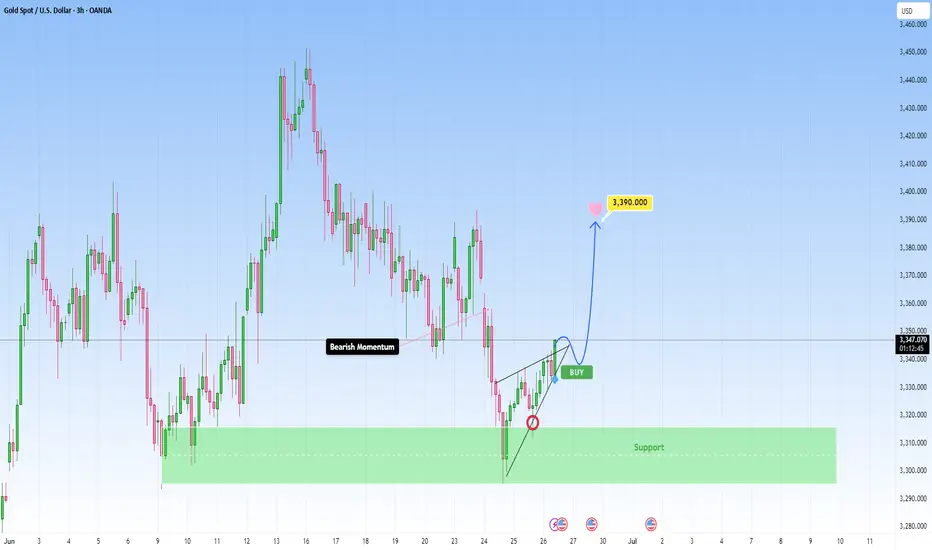
GOLD drops sharply to 3300 and found important support areaThe recent bearish momentum on GOLD has met a good support zone and at present we started to see early signs of bullish interest returning, right after we got a beautiful rejection from the zone.
Currently I’m expecting for the price to bounce to the target near 3,390 . If this bullish push continues with strong volume and momentum, I’ll be locking in that bias and planning my entry accordingly. I could get involved right here for a more aggressive entry. It’s a bit riskier, but if the structure confirms, I’m more than happy to take the shot, as sometimes the best trades come when you trust your setup.
This is not financial advice.
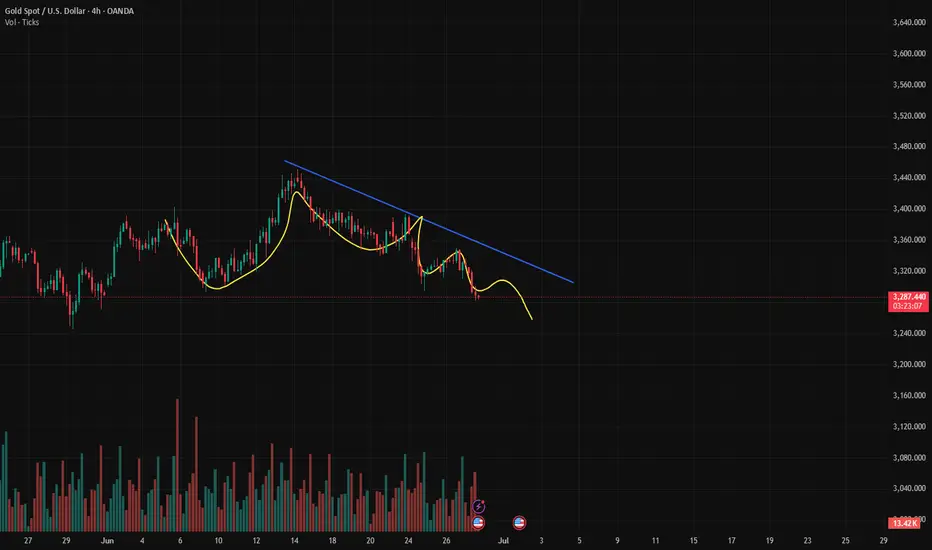
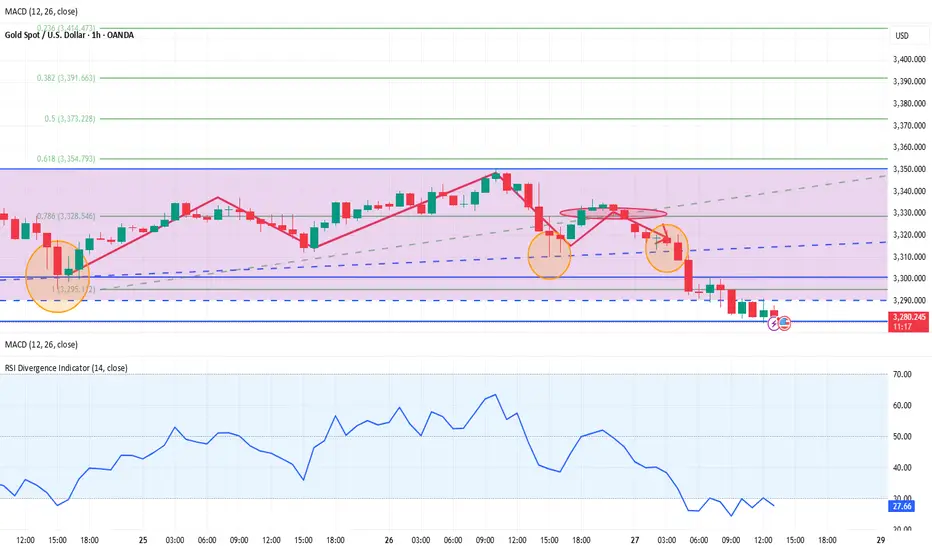
Analysis and layout of the latest gold trends during the day📰 Impact of news:
1. PCE and Consumer Index
📈 Market analysis:
Judging from the 4H chart, the Bollinger Bands are closing and the MACD is showing a trend of forming a death cross, indicating that the short-selling momentum is still relatively strong in the short term. However, as the overall upward structure has not been destroyed, there is still a possibility of a rebound and repair in the future. During the day, we need to pay special attention to the support strength of the MA5 and MA10 moving averages. It is recommended to adopt the idea of shorting at high levels and going long at low levels. The key support below is the 3305-3295 area, and the upper resistance is the 3340-3350 range. However, judging from the chart, in the short term, there may be a rebound near 3313. At present, it has indeed rebounded to around 3319 as expected. If it falls weakly to this week's low of 3295, you can buy if it does not break. On the whole, if it rebounds to 3335-3345, you can consider shorting, and if the support below 3305-3295 is not broken, go long. Today is Friday, and as it is near the end of the month, market liquidity is strong. Please be cautious in your operations today and be sure to set stop losses strictly.
🏅 Trading strategies:
SELL 3335-3345-3350
TP 3320-3315-3300
BUY 3305-3295
TP 3310-3320-3330
If you agree with this view, or have a better idea, please leave a message in the comment area. I look forward to hearing different voices.
Gold Falls After Rejection at 3350 – Eyes on Short-Term Pullback📊 Market Drivers:
• Gold spiked to $3,350/oz early in the day but later dropped to $3,310/oz as profit-taking kicked in and U.S. yields recovered slightly.
• Market is in a wait-and-see mode ahead of PCE inflation data on Friday, limiting upside momentum late in the session.
📉 Technical Analysis:
• Key resistance: $3,345–3,350 (daily high)
• Nearest support: $3,310 – session low; then $3,290
• EMA09: Price trading above EMA09, but below EMA21, signaling a neutral bias
• Candle/momentum: Formed shooting star reversal near $3,348 on H1 with declining volume → short-term weakness ahead
📌 Outlook:
Gold may pull back toward $3,300–3,290 short-term if USD rebounds and selling persists. But medium-term bullish bias remains if inflation data disappoints and USD continues weakening.
💡 Trade Ideas:
🔻 SELL XAU/USD at: 3,335–3,345
🎯 TP: 3,315
❌ SL: 3,352
🔺 BUY XAU/USD at: 3,295–3,305
🎯 TP: 3,315
❌ SL: 3,285