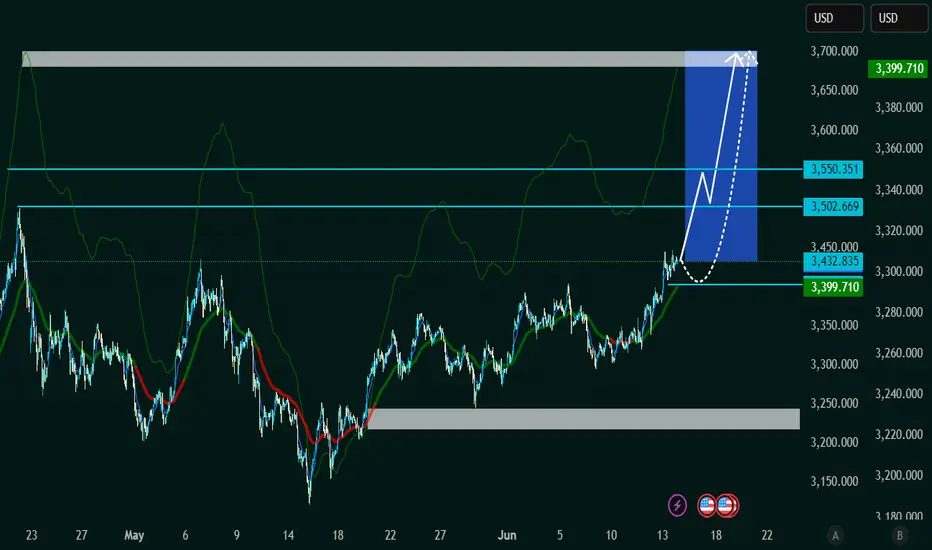
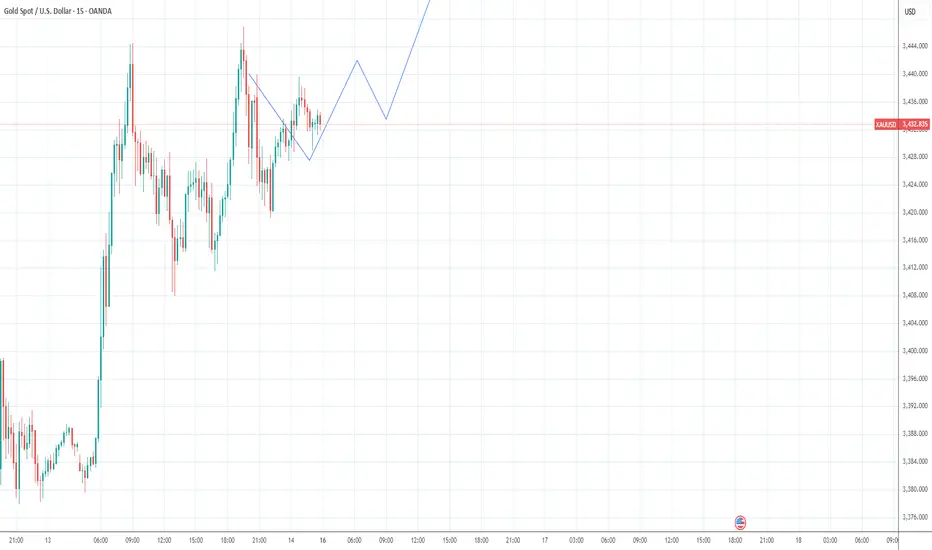
XAU/USD Bullish Continuation SetupThe chart illustrates a bullish market structure for XAU/USD, with price action currently trending upwards. Key technical observations:
Support Zone:
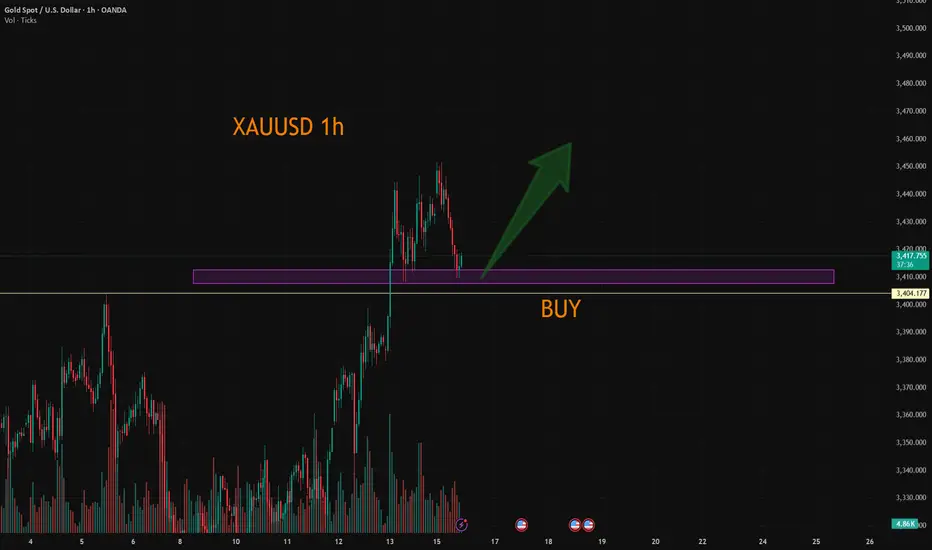
Price has recently bounced from a support zone around 3,399.710, indicating strong buying interest.
Bullish Projection:
A bullish continuation is expected. The chart outlines a potential scenario with a minor retracement towards 3,432.835 or 3,399.710, followed by a strong upward move.
Targets:
Immediate resistance is around 3,502.669.
If broken, price may aim for 3,550.351.
Final projected target lies near 3,680.000, which aligns with a historical supply zone.
Indicators:
The green enveloping bands suggest increasing volatility, with the price respecting the upper band, supporting bullish momentum.
Conclusion:
XAU/USD appears poised for a bullish breakout continuation. A potential pullback could offer a buy opportunity, targeting higher resistance zones as long as the structure remains intact
Goldlong
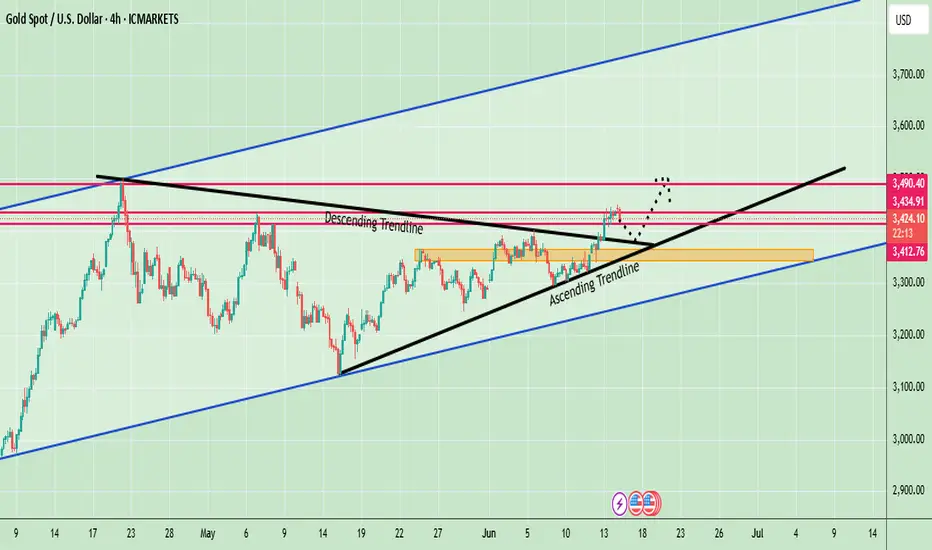
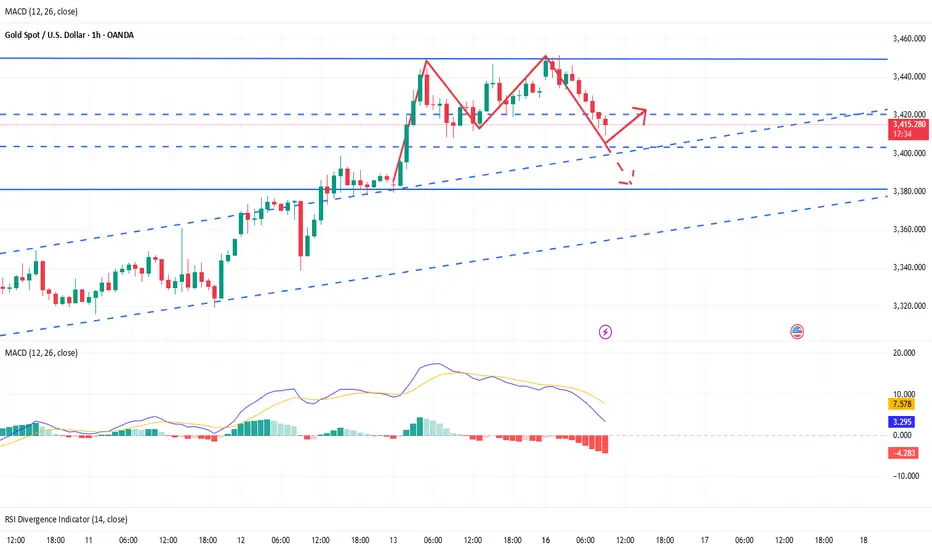
Gold Outlook: Bulls Defend Support Amid Rising Geopolitical RiskGold (XAU/USD) remains within a strong bullish structure on the 4-hour chart, trading inside an ascending channel. Recently, price attempted to break above the key resistance near $3,450 but failed, leading to a minor pullback toward the mid-channel area around $3,428–$3,430, where buyers are currently defending support. The key support remains at $3,394–$3,400, which also coincides with the ascending channel’s lower boundary.
As long as price holds above this level, the bullish trend remains intact, and there is potential for a breakout above the $3,450 resistance zone. If a breakout occurs and price closes above $3,450 on the 4-hour chart, the next bullish targets would be around $3,475 and then $3,500–$3,510. On the downside, if price fails to hold $3,394, it may trigger a short-term bearish correction toward the next support zone around $3,380–$3,370.
Overall, gold is currently in a consolidation phase inside the $3,394–$3,450 range, with a bullish bias above $3,394. A breakout above $3,450 may trigger strong upward momentum, while a break below $3,394 could open the door for a deeper correction.
🔑 Key Levels
Support: ~$3,394–$3,400 (channel floor) and intermediate support at $3,430–$3,440 .
Resistance: Immediate resistance zone is $3,445–$3,450, with broader upside potential toward $3,500+ if that break occurs.
Note
Please risk management in trading is a Key so use your money accordingly. If you like the idea then please like and boost. Thank you and Good Luck!
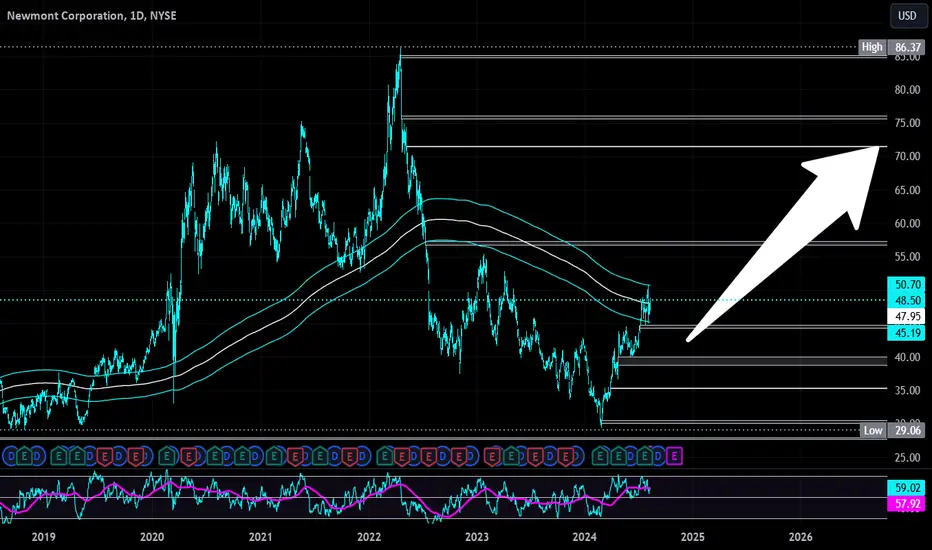
Newmont Corp | NEM | Long at $48.00While gold prices have soared recently, gold mining stocks have lagged. Newmont Corp NYSE:NEM , the world's largest gold mining corporation, may be undervalued if the miners take off to catch up to the gold demand/price. Currently sitting near $48.00 and at a historical moving average that it will need to break to show a true trend reversal, NYSE:NEM is in a personal buy zone. Now, the price may break down at the simple moving average and test the patience of shareholders, but the long game may benefit those who can tolerate the volatility.
Target #1 = $57.00
Target #2 = $71.00
Gold continues to rise! When will the price of gold fall?Market news:
In early Asian trading on Monday (June 16), London gold prices continued to rise last week, hitting a nearly seven-week high of $3,451/ounce, as Israel and Iran launched a new round of attacks on each other on Sunday (June 15), exacerbating market concerns that escalating wars may trigger wider regional conflicts, and international gold continued to receive support from safe-haven buying.The continued rise of gold during the conflict depends on whether it is in a bull market and whether the conflict is likely to escalate. The inflow of funds into gold stock ETFs shows an increase in retail interest, especially silver outperforming spot gold, suggesting that market sentiment is turning. In addition to the geopolitical situation, this week will also usher in the test of the US retail sales monthly rate (commonly known as "terror data") and the Federal Reserve's interest rate decision.This trading day also needs to pay attention to the US New York Fed Manufacturing Index in June and the G7 Leaders' Summit, and pay attention to China's May total retail sales of consumer goods and China's May industrial added value annual rate.
Technical Review:
The technical price of gold is in good condition with the buying structure of the trend. The MA10/7/5-day moving averages on the daily chart remain open upward, the RSI indicator is hooked upward, and the price is running in the upper and middle track of the Bollinger Bands. The moving average system of the short-term four-hour chart maintains a golden cross opening upward, the price gradually moves up from the high point of the MA10-day moving average, and the Bollinger Bands remain open upward in the same hourly chart. Affected by the market fundamentals, gold has triggered risk aversion.The price of gold continues to rise, and the graphics of various time periods have formed obvious and strong support. In the daily chart, gold fell back to the trend line support after the triangle convergence breakthrough, and ushered in a rising trend again. In the short term, the upward momentum of gold is still strong. Based on the last round of retracement low of $3120 as the starting point of the wave structure, the push of the third wave may cause the price of gold to rise to $3600-3640. Combined with the current fundamentals, news and geopolitical situation, the medium- and long-term upward trend of gold is far from over.
Today’s analysis:
At present, the entire market is still affected by the geopolitical risks in the Middle East. Gold has been at a high level for a long time. If there is no turning point, the gold price will continue to remain above 3400 today. We will have the opportunity to see the gold price refresh the historical high of 3500 again today or tomorrow, and the probability is also very high. Then our operation idea is to buy to the end before the trend changes!
The trend of the gold one-hour market is still strong. From the short-term trend, it continues to maintain a high-level shock pattern, and the low point continues to rise. The high point has been continuously broken. Although the high opening and high movement of the Asian market failed to be directly continued, the high and fall back just gave us the opportunity to buy in!
Operation ideas:
Buy short-term gold at 3420-3423, stop loss at 3411, target at 3450-3470;
Sell short-term gold at 3468-3471, stop loss at 3480, target at 3420-3400;
Key points:
First support level: 3423, second support level: 3410, third support level: 3392
First resistance level: 3458, second resistance level: 3467, third resistance level: 3483
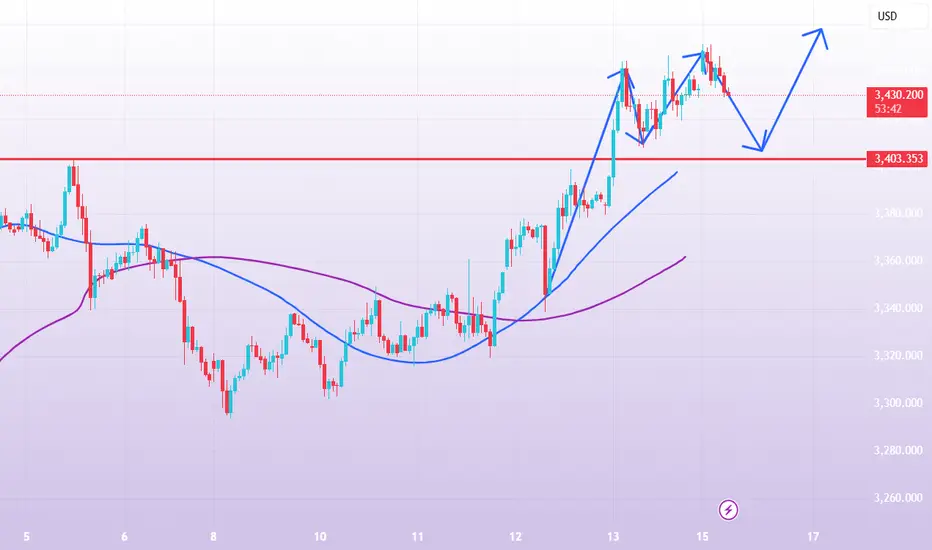
Gold----Buy near 3417, target 3440-3450Gold market analysis:
The continuous bombing of Israel and Iran for several days has allowed gold to stand on 3400 again. The big tombstone before the weekly line was wiped out, and the weekly line closed with a big positive line again, and formed a positive-enclosing-negative pattern. This is the long-term rebound caused by geopolitical factors. There is an old saying in the market that cannonballs are always worth a lot of gold. We are not sure how long the situation between Iran and Israel will last, but what is certain is that the buying situation is obvious. The next operation is to follow the buying. I estimate that gold will continue to rise this week. In addition, under such fundamentals that control the market, we must strictly carry out each order with a loss. The market will not change the trend because you resist the order. Following the trend is the kingly way.
In the Asian session, we first focus on the hourly support of 3417 and the shape support of 3419. The position of 3417 is also the watershed of strength and weakness in the short term. If it breaks, it will reach around 3407. In addition, 3451 is the top of the daily line. There was a dive at this position before. If the daily line cannot stand on it for a long time, there is also the possibility of another dive. 3407 is a hurdle in the big cycle. If it breaks, it may bring a waterfall drop.
Support 3417, strong support 3407, suppression 3451, the watershed of strength and weakness in the market is 3417.
Fundamental analysis:
There are many fundamental analyses and data in the recent period. Geopolitical factors are the main reason for its violent fluctuations. In addition, there is a holiday in the United States this week, and there is also a Federal Reserve interest rate result.
Operation suggestion:
Gold----Buy near 3417, target 3440-3450
XAUUSD Hello Traders! 👋
What are your thoughts on GOLD?
Gold has broken above a major resistance level, and price has closed firmly above this zone, signaling strong bullish momentum and a shift in market sentiment.
We expect a brief pullback in the short term, followed by a resumption of the upward move toward higher targets and new highs.
As long as price remains above the identified support level, the bullish outlook remains valid.
Is gold ready for its next leg up after the pullback? Share your thoughts below! 🤔👇
Don’t forget to like and share your thoughts in the comments! ❤️
Buy on dips and seize rising opportunities📰 Impact of news:
1. Geopolitical risks
2. Expected Fed policy
📈 Market analysis:
The market opened higher in the morning and then continued to fall. From a medium-term perspective, the market is still in a medium-term bullish position. The price will only be under further pressure if it breaks below the weekly support. Observing from the daily level, the price broke through the daily resistance again last Wednesday and continued to soar after the breakthrough. The current price is testing the monthly high, and the subsequent gains and losses of the previous high are the key. Judging from the 1H chart, the short-term death cross continues to fall. At the same time, according to the 4H level, as time goes by, we need to pay attention to the support of 3413-3403. This support is the key watershed of the short-term trend. As long as it does not fall below this support, the bulls still have a chance.
🏅 Trading strategies:
BUY 3413-3403
TP 3430-3440
If you agree with this view, or have a better idea, please leave a message in the comment area. I look forward to hearing different voices.
OANDA:XAUUSD FX:XAUUSD FOREXCOM:XAUUSD FXOPEN:XAUUSD TVC:GOLD
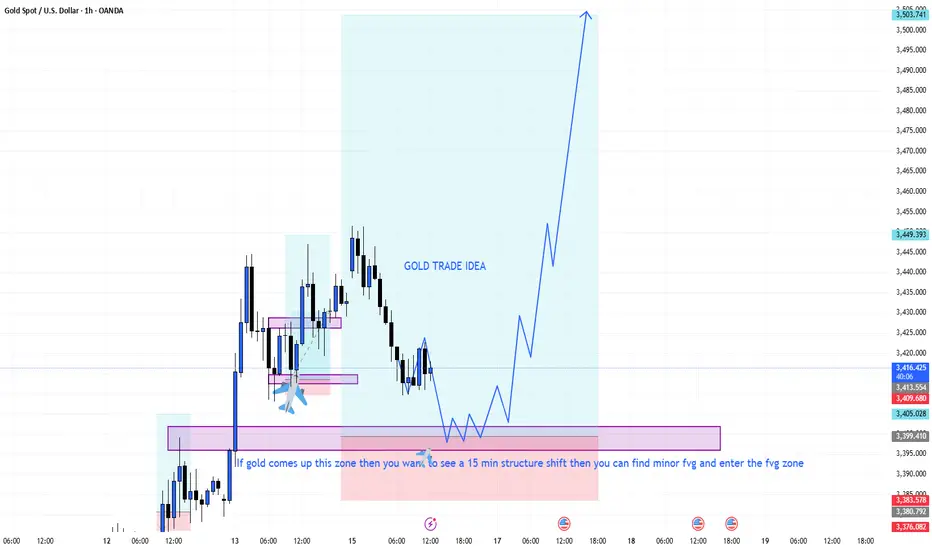
GOLD TRADE IDEA BULLISH MOMENTPrice is approaching a high-interest demand zone, marked by previous accumulation and clean inefficiency. My plan?
I’m not rushing in — I’m waiting for a 15-minute structure shift. Once that happens, I’ll look for a minor FVG to enter with precision.
📌 Key Criteria:
Price must react in the zone
Clear shift in structure (bullish intent)
Minor FVG forms = potential sniper entry
Targeting a high RR setup (6.5+)
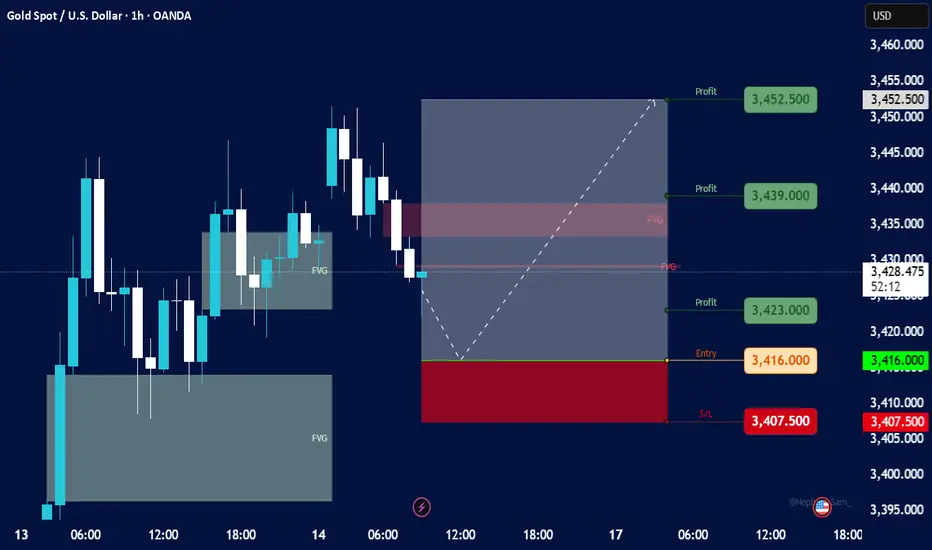
Long on Gold, Scalp, R/R: 1/3
Hello guys,
A small scalp on gold — long position with a risk/reward ratio of 1:3.
xauusd Entry Level:
3,416.000 USD
Price is currently at 3,425.640 USD, so the entry was already triggered and the position is active and in profit.
Stop-Loss (SL):
3,407.500 USD
Positioned below the minor FVG area; protects against deeper downside if structure fails.
Take-Profit Targets (TP):
TP1: 3,423.000 USD (short-term scalp zone — already reached)
TP2: 3,439.000 USD (medium-term resistance)
TP3: 3,452.500 USD (strong upside target; likely near a previous high)
Shift Stop to entry after reaching TP1
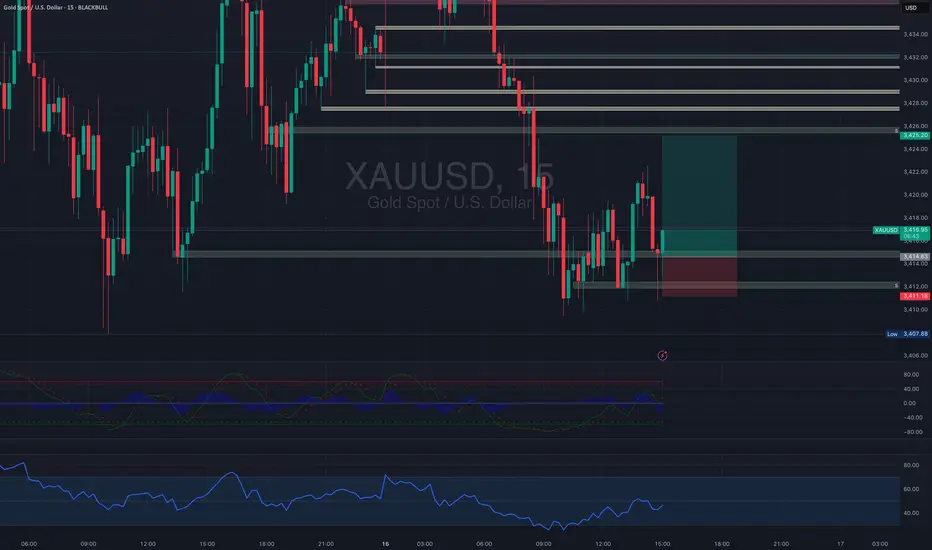
XAUUSD:Waiting to go long
For gold I am still bullish, do long, rather than blindly chase long.
Today's lowest reretreat to around 3408, from the short-term level or long willingness is stronger, the hourly level is a little pressure, trading can wait for the pullback before buying long, the important support below 3404. Short-term support looks at 3407-12
Trading Strategy:
BUY@3407-12
TP:3427-30
↓↓↓ More detailed strategies and trading will be notified here ↗↗↗
↓↓↓ Keep updated, come to "get" ↗↗↗
#GOLD More conservative long positioning at $3388.89
is not a long operation advice do your assessments are for illustrative purposes only

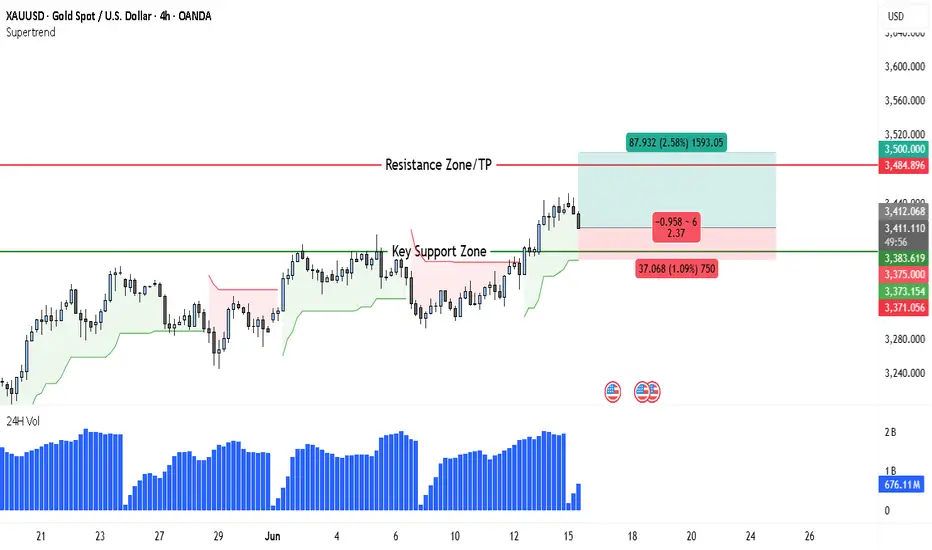
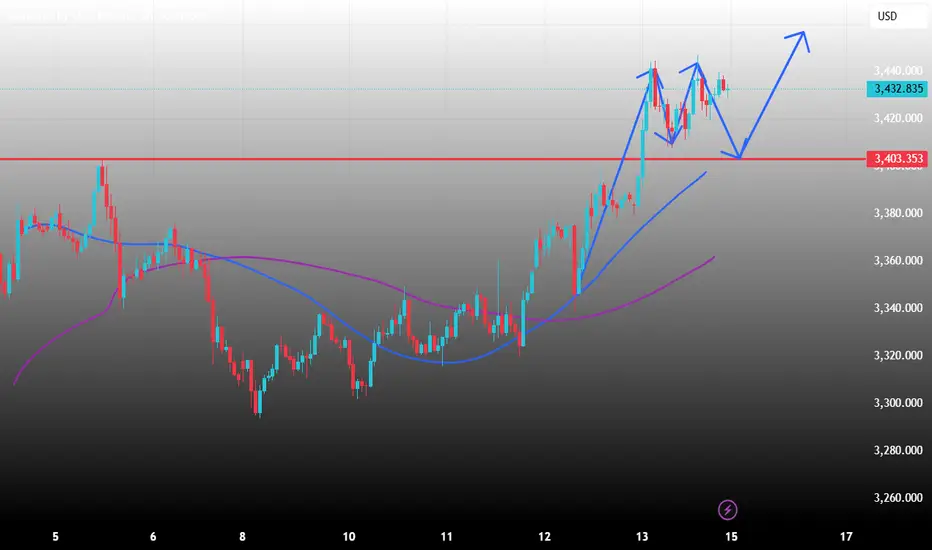
Gold Reclaims Bullish Zone—Perfect Time for a Swing EntryGold has once again reclaimed bullish momentum after breaking through the key support zone around $3,412, previously a stubborn ceiling that had acted as resistance multiple times throughout late May and early June. The break above this level—validated by a decisive green Supertrend flip—indicates a short-term trend reversal in favor of buyers.
After a brief consolidation phase, XAUUSD formed a solid breakout candle, confirming upward momentum. The current price action sits comfortably above the Supertrend line, which is now acting as dynamic support, while volume has picked up notably during the move up—an important confirmation of institutional interest and breakout strength.
Trade Setup Breakdown
• Entry: Above the $3,412 breakout area (now acting as support)
• Stop Loss: Below the key support zone, ideally near $3,373–$3,375 to allow for wick re-tests and avoid premature exits
• Target/TP: Resistance zone marked near $3,484–$3,500, which aligns with a prior consolidation ceiling from late April and early May. This target offers a risk-reward ratio of approx. 2.3:1, which is favorable for a swing position.
• Re-entry Opportunity: If gold retraces back to the $3,373–$3,383 zone (support cluster), it would provide a high-probability re-entry while keeping the same TP of $3,500.
Why the Bias Is Bullish
1. Structure Break & Supertrend Flip
The key breakout above previous resistance was clean and confirmed by the Supertrend flip to green, a historically reliable short-term bullish signal.
2. Volume Confirmation
Volume spikes on the breakout candles confirm real buying pressure—not just a false breakout or low-liquidity movement.
3. Support Retest Potential
The $3,412–$3,383 zone now forms a strong demand area where buyers are likely to defend their positions if price pulls back. This zone also aligns with historical congestion from earlier price action.
4. Macro Context (Not in chart but relevant)
Ongoing economic uncertainty, rising global tensions, and interest rate speculation continue to boost gold's safe-haven appeal. Traders are increasingly rotating into gold during periods of macro volatility.
Outlook
Gold is likely to continue climbing toward the $3,500 mark unless it closes below $3,373 on high volume. Bulls appear to be in control, and even a minor pullback could serve as a buying opportunity. As long as the price remains above the flipped Supertrend and $3,373 support, the bullish case remains intact.
Oil Extends Rally as Israel-Iran Conflict Stokes Supply FearsBrent jumps 5.5 %, bullion hits fresh records, but analysts still see $65 crude by Q4 if key shipping lanes stay open
The crude-oil market loves nothing more than a geopolitical headline, and the one that flashed across terminals this past weekend was a whopper: escalating hostilities between Israel and Iran. Within minutes of the first wire stories, Brent crude vaulted 5.5 % to an intraday high of $76.02 a barrel—its largest single-session pop since Russia invaded Ukraine in early 2022—before giving back part of the gain to settle just under $76. West Texas Intermediate (WTI) traced a similar arc, peaking at $74.11 and closing fractionally lower.
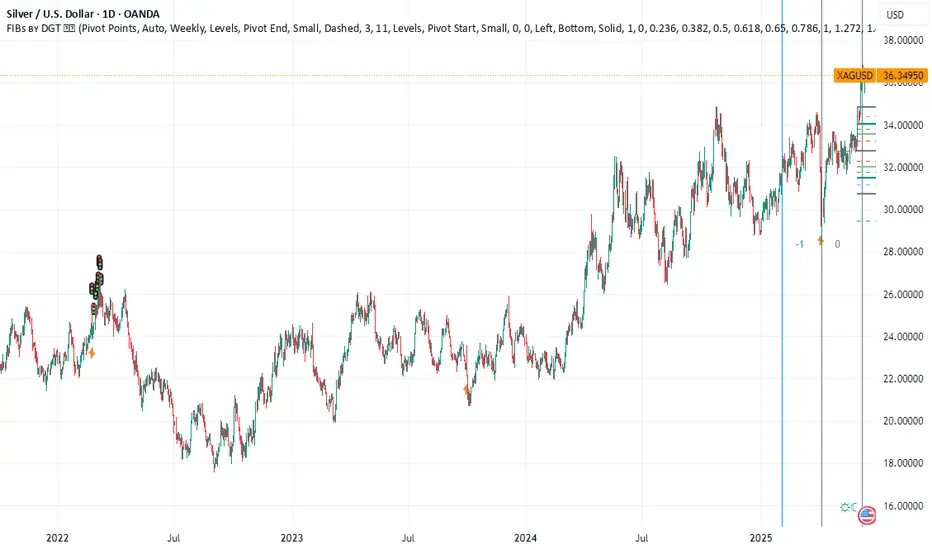
At the same time, investors stampeded into traditional havens. COMEX gold pierced $2,450 an ounce for the first time, while silver sprinted above $33—blowing past the decade-old high set during the meme-metal frenzy of 2021. The twin moves in energy and precious metals underscore how fragile risk sentiment has become even as global demand growth, OPEC discipline, and U.S. shale resilience point to a more balanced physical market later this year.
Below we dissect the drivers of crude’s latest surge, explore the scenarios that could push prices back toward—or away from—the $65 handle by the fourth quarter, and explain why bullion refuses to loosen its grip on record territory.
________________________________________
1. What Sparked the Spike?
1. Tit-for-tat escalation. Reports of Israel striking Iran-linked assets in Syria and Iran responding with drone attacks near the Golan Heights raised fears of a direct Israel-Iran confrontation—a worst-case scenario that could spill into the Strait of Hormuz and threaten 20 % of global seaborne oil.
2. Thin pre-holiday liquidity. Monday volume was 30 % below the 20-day average with several Asian markets closed, exaggerating price swings and triggering momentum-chasing algos.
3. Options market gamma squeeze. Dealers short upside calls scrambled to hedge as spot pierced $75, accelerating the melt-up. Open interest in $80 Brent calls expiring in June ballooned to 45,000 contracts—four times the 3-month norm.
________________________________________
2. How Real Is the Supply Risk?
While the headlines are chilling, physical flows remain intact for now:
• Strait of Hormuz: No tankers have been impeded, insurance premia have widened only 25 ¢ per barrel—well below the $3 spike seen after the 2019 Abqaiq attack in Saudi Arabia.
• Iraqi-Turkish Pipeline: Still shuttered for unrelated legal reasons; volumes have been offline since March 2023 and are therefore “priced in.”
• Suez Canal / SUMED: Egyptian authorities report normal operations.
In short, the rally is risk premia, not actual barrels lost. That distinction matters because premia tend to deflate quickly once tension plateaus, as the market witnessed in October 2023 after Hamas’s initial assault on Israel.
________________________________________
3. Fundamentals Point to Softer Prices by Autumn
Four forces could push Brent back into the $65–68 corridor by Q4 2025 if the geopolitical situation stabilizes:
Force Current Status Q3–Q4 Outlook
OPEC+ Spare Capacity ~5.5 mbpd, most in Saudi/UAE
Ability to add 1–2 mbpd if prices spike
U.S. Shale Growth 13.3 mbpd, record high +0.6 mbpd y/y, breakeven $47–55
Refinery Maintenance Peak spring turnarounds remove 1.5 mbpd demand Units restart by July, easing crude tightness
Global Demand +1.2 mbpd y/y (IEA) Slows to +0.8 mbpd on OECD weakness
Add seasonal gasoline demand ebbing after August, and the supply-demand balance tilts looser just as futures curves roll into Q1 2026 deliveries—a period typically beset by refinery slowdowns and holiday travel lulls.
________________________________________
4. Scenario Analysis: Three Paths for Brent
1. Escalation (20 % probability)
• Direct Israeli strike on Iranian territory → Tehran targets Hormuz traffic
• 3 mbpd disrupted for one month
• Brent overshoots to $100+, backwardation widens above $10
• Biden releases 90 mb from the SPR; OPEC signals emergency meeting
2. Containment (60 % probability)
• Hostilities remain proxy-based in Syria/Lebanon; shipping unscathed
• Risk premium bleeds off; Brent drifts to $70–72 by July
• By Q4 oversupply emerges; prices test $65
3. Detente (20 % probability)
• U.S.-mediated cease-fire; hostages exchanged
• Iran de-escalates to focus on reviving JCPOA talks
• Risk premium collapses; Brent revisits mid-$60s by August and low-$60s into winter
________________________________________
5. Why Gold and Silver Are On Fire
The precious-metals rally is less about oil and more about real yields and central-bank buying:
• Real 10-year U.S. yield sits at 1.05 %, down from 1.55 % in February, boosting gold’s carry cost competitiveness.
• PBoC & EM central banks added a net 23 tonnes in April—the 17th straight month of net purchases.
• ETF inflows turned positive for the first time in nine months, adding 14 tonnes last week.
Silver benefits from the same macro tailwinds plus industrial demand (solar panel capacity is growing 45 % y/y). A tight COMEX inventory cover ratio—registered stocks equal to just 1.4 months of offtake—amplifies price sensitivity.
________________________________________
6. Cross-Asset Implications
1. Equities: Energy stocks (XLE) outperformed the S&P 500 by 3 % intraday but could retrace if crude fizzles. Miners (GDX, SILJ) may enjoy more durable momentum given new-high psychology.
2. FX: Petro-currencies CAD and NOK rallied 0.4 % vs. USD; safe-haven CHF gained 0.3 %. JPY failed to catch a bid, reflecting carry-trade dominance.
3. Rates: U.S. 2-year yields slipped 6 bp as Fed cut odds edged up on stagflation fears, but the move lacked conviction.
________________________________________
7. What Could Invalidate the Bearish Q4 Call?
• OPEC+ Discipline Frays: If Saudi Arabia tires of single-handedly absorbing cuts and opens the taps, prices could undershoot $60—but Riyadh’s fiscal breakeven (~$82) makes this unlikely.
• U.S. Election Politics: A new White House may re-impose harsher sanctions on Iran or ease drilling restrictions, tilting balances either way.
• Extreme Weather: An intense Atlantic hurricane season could knock Gulf of Mexico output offline, squeezing physical supply just as refineries demand more feedstock.
________________________________________
8. Trading and Hedging Playbook
Asset Bias Vehicles Key Levels
Brent Crude Fade rallies toward $80; target $68 by Oct ICE futures, Jul $70 puts Resistance $78.80 / Support $71.30
WTI Similar to Brent NYMEX CL, calendar-spread (long Dec 24, short Dec 25) Resistance $75.20
Gold Buy dips if real yields fall below 0.9 % Futures, GLD ETF, 25-delta call spreads Support $2,390
Silver Momentum long until $35; tighten stops Futures, SLV ETF, 2-month $34 calls Resistance $36.20
Energy Equities Pair trade: long refiners vs. short E&Ps ETFs: CRAK vs. XOP Watch crack spreads
Risk managers should recall that correlation spikes under stress: a portfolio long gold and short crude looks diversified—until a Middle-East cease-fire nukes both legs.
________________________________________
9. Macro Backdrop: Demand Still Fragile
Even before the flare-up, oil demand forecasts were slipping:
• OECD: Eurozone PMIs languish below 50; German diesel demand –7 % y/y.
• China: Q2 refinery runs flatlining; teapot margins < $2/bbl.
• India: Bright spot with gasoline demand +9 %, but monsoon season will clip growth.
On the supply side, non-OPEC production is rising 1.8 mbpd this year, led by Brazil’s pre-salt, Guyana’s Stabroek block, and U.S. Permian efficiency gains. Unless Middle-East barrels exit the market, the call on OPEC crude will shrink from 28 mbpd in Q2 to 26.7 mbpd in Q4, forcing the cartel to decide between market share and price.
________________________________________
10. Historical Perspective: Geopolitical Risk Premiums Fade Fast
Event Initial Brent Jump Days to Round-Trip Barrels Lost?
2019 Abqaiq Attack +15 % 38 < 0.2 mbpd for 30 days
2020 U.S.–Iran (Soleimani) +5 % 10 None
2022 Russia-Ukraine +35 % Still elevated > 1 mbpd rerouted
Based on precedent, a 5–7 % surge without real supply disruption typically unwinds within six weeks.
________________________________________
11. Outlook Summary
• Base Case: Containment; Brent averages $70–72 through summer, melts to $65–68 Q4. Gold consolidates above $2,350; silver churns $30–34.
• Bull Case (Oil): Hormuz threatened; Brent $100+, gas prices soar, Fed forced to juggle inflation vs. growth.
• Bear Case (Oil): Cease-fire + soft demand; Brent breaks $60, OPEC+ grapples with fresh round of cuts.
•
________________________________________
12. Conclusion
The Israel-Iran flashpoint has injected a fresh geopolitical premium into oil and turbo-charged safe-haven metals, but history suggests emotion-driven rallies fade quickly when physical barrels keep flowing. Unless missiles land near Hormuz or an errant drone strikes a Saudi export terminal, the structural forces of rising non-OPEC supply and cooling demand should reassert themselves, dragging Brent back toward the mid-$60s by year-end.
For traders, that means respecting the tape today but planning for mean reversion tomorrow—selling gamma-rich call structures in crude, rolling stop-losses higher on bullion longs, and watching like hawks for any hint that shipping lanes are no longer merely a headline risk but a tangible bottleneck. Until that line is crossed, the smart money will treat each price spike not as the dawn of $100 crude, but as an opportunity to hedge, fade, and position for a calmer, cheaper barrel in the months ahead.
XAU/USD(20250617) Today's AnalysisMarket news:
Trump: The United States may still intervene in the Iran-Israel conflict. If Iran launches an attack on the United States, the United States will "fight back with all its strength on an unprecedented scale." Iran and Israel should reach an agreement.
Technical analysis:
Today's buying and selling boundaries:
3419
Support and resistance levels:
3486
3461
3445
3394
3378
3353
Trading strategy:
If the price breaks through 3445, consider buying in, the first target price is 3461
If the price breaks through 3419, consider selling in, the first target price is 3394
Gold's Wild Ride: Must-Know Price Predictions for Next Week!I can write a lot of smart words but lets make it short, like and sub from you for that)
3 options that i can see:
1- dump to Gap at 3292 then bounce target PWH or higher
2 - move a bit lower till PWL and then all the way up till PWH or ATH
3 - cancel all longs, move down below , break 3250 lvl with fvg and second shift on 4h time frame and then gold will keep going lower all the way down to 3k (Low-probability)

"Due to the economic crisis, the gold market may open with a gap"Due to the economic crisis, the gold market may open with a gap tomorrow."
This upward trend is attributed to increased demand for gold as a safe-haven asset amid geopolitical uncertainties. The conflict has also led to a spike in oil prices and a decline in global stock markets, further enhancing gold's appeal .
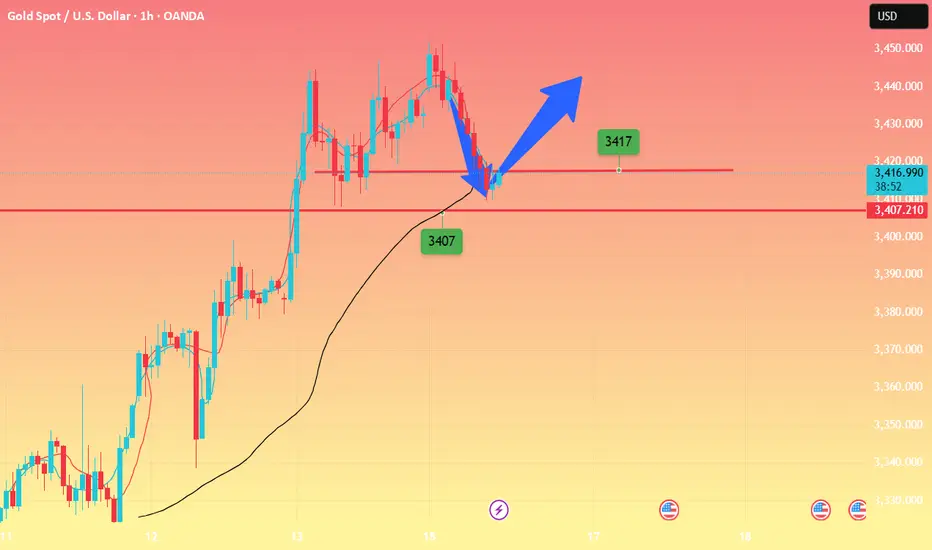
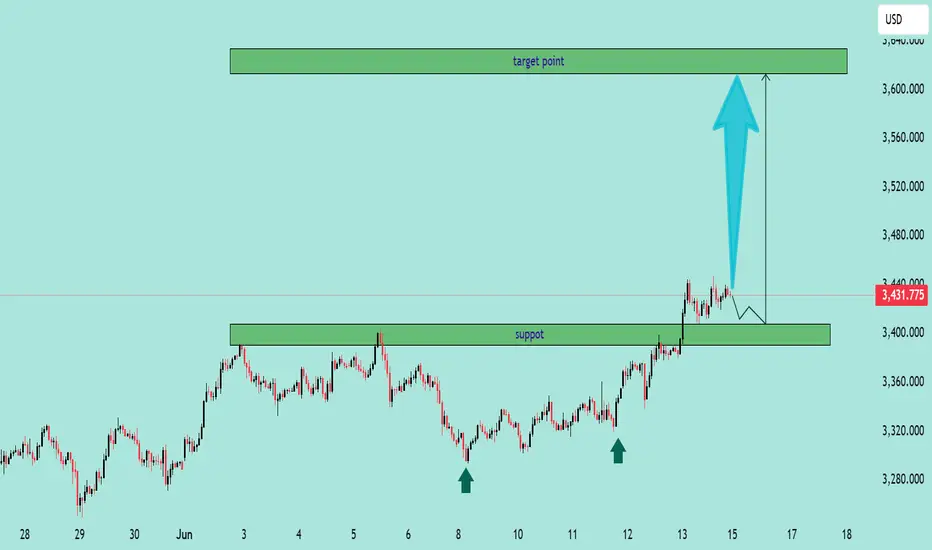
GOLD/USD Bullish Breakout PotentialGOLD/USD Bullish Breakout Potential 🚀📈
🔍 Chart Analysis (June 15, 2025):
The GOLD/USD price action shows strong bullish momentum after a successful breakout above the previous resistance zone (now turned support) around $3,400. This level had previously acted as a key resistance multiple times (evidenced by the price rejection in early June), but has now been flipped into a support zone. The chart highlights two major elements:
📌 Key Highlights:
✅ Support Zone:
The $3,390–$3,410 range is now a confirmed support area after price broke above and retested it. This zone was previously tested multiple times (marked by arrows) and is expected to act as a launchpad for further upside.
🎯 Target Point:
The projected bullish target lies in the $3,610–$3,640 range. This level has been highlighted as a potential area where price might face resistance again.
📈 Bullish Projection:
A bullish continuation is expected if the price remains above the $3,400 level. The chart suggests a possible pullback to support before continuation towards the target zone.
⚠️ Technical Outlook:
As long as price holds above support, the bias remains bullish.
A drop below $3,390 would invalidate this bullish scenario and call for reassessment.
Conservative entry may wait for a confirmed bounce from support.
🔮 Summary:
Bullish bias is active for GOLD/USD with a short-term target around $3,620. Watch the $3,400 support closely for confirmation of the upward momentum.
XAUUSD - High possibility of volatile market opening (20250616)Well, it is quite obvious we have a volatile geo-political crisis this weekend, so market may overreact once again to bring Gold to at least 3500 opening.
Looking at volume, though Gold is in uncharted territory and it can be move as high as 3550 - 3600, I rather play for a quick profit.
Hope later this Sunday, we can find some positive news that can at least hold the surge of Gold to minimum.
Trade safe, Trade wisely. Monday will be a very volatile opening.
Analysis of gold price trend next week!Market news:
Weak U.S. inflation data released earlier this week reinforced expectations that the Federal Reserve will cut interest rates, increasing the appeal of spot gold. It hit a two-month high. The geopolitical tension in the Middle East has caused investors to flock to safe-haven assets. Earlier, Israel's air strikes on Iran have once again raised concerns about a wider conflict in the Middle East. In terms of physical gold, demand in major Asian centers weakened this week due to a sharp rise in prices, and the Indian gold price broke through the important psychological level of 100,000 rupees. As geopolitical tensions in the Middle East intensified over the weekend, gold prices may continue to benefit from risk aversion next week, and London gold prices are expected to target $3,500/ounce at the beginning of next week! Next week will also be affected by the Fed's decision and Powell's speech. In addition, U.S. President Trump will visit Canada from June 15 to 17 to attend the G7 Leaders' Summit. His speech at that time may also affect the fluctuation of international gold prices, which is worth paying attention to.
Technical Review:
From the market point of view, the overall bottoming and rebounding trend of gold this week has undoubtedly laid a strong foundation for buying. It is understandable to follow the trend and rise. However, since the gold price fell back at the end of the week and closed near 3433, I think it is necessary to make a short-term decline judgment on the market trend at the beginning of the week. As the gold price continues to rise, various graphics have formed very obvious and strong support, among which the 3419 line and the 3400 mark shown by the upper track of the daily Bollinger Band are the most important. Once the gold price can stabilize above this area today, the daily support will definitely continue to rise, which will also lay a more favorable foundation for buying to steadily hit new highs. Combined with the risk aversion demand caused by risk events, it is not an exaggeration to expect the gold price to approach the 3500 mark next week! But if the short-term reversal is sold, the 3400 mark is taken, and the daily MACD indicator forms a dead cross green column and continues to increase in volume, then the possibility of selling down to the daily 5-day moving average will be increased. However, whether this possibility can be realized needs to be judged in combination with more factors. After all, the overall trend of gold is still rising. If the adjustment is too strong, it will not only break the trend, but also cause the gold price to fall into a weak trend below 3400 in the short or medium term.
Next week's analysis:
Gold rose again on Friday under the stimulation of risk aversion. Gold was directly bought at 3413 on Friday, and the circle of friends also directly prompted to buy. Gold rose and harvested as expected. Gold has been shrouded in risk aversion in the Middle East these two days. In the short term, the trend of gold is still supported by risk aversion, and it may go up a level. If risk aversion is not relieved at the weekend, it will continue to buy next week. At present, the risk aversion sentiment of gold is constantly escalating, and buying is also strong and irresistible. So before there is a significant change, it is to continue to buy to the end, and the rise is not a top, and go with the trend. Gold's 1-hour moving average is still a golden cross with upward buying divergence, and the buying power of gold is still there! After the rise of gold's safe-haven, gold adjusted sideways in the short term, but it is still oscillating strongly at a high level. Now it is still in the process of rising. If there is no bad news to make gold fall and break, then the short-term volatility of gold is an adjustment in the process of rising, and it will continue to rise at any time. After gold buying breaks through 3400, gold buying sticks to the 3400 line, so if it falls back to 3400 next week, it will continue to buy on dips. If the risk aversion of gold eases and falls below 3400, then we may readjust our thinking.
Operation ideas:
Buy short-term gold at 3405-3408, stop loss at 3396, target at 3450-3470;
Sell short-term gold at 3457-3460, stop loss at 3469, target at 3420-3400;
Key points:
First support level: 3422, second support level: 3405, third support level: 3390
First resistance level: 3446, second resistance level: 3458, third resistance level: 3472
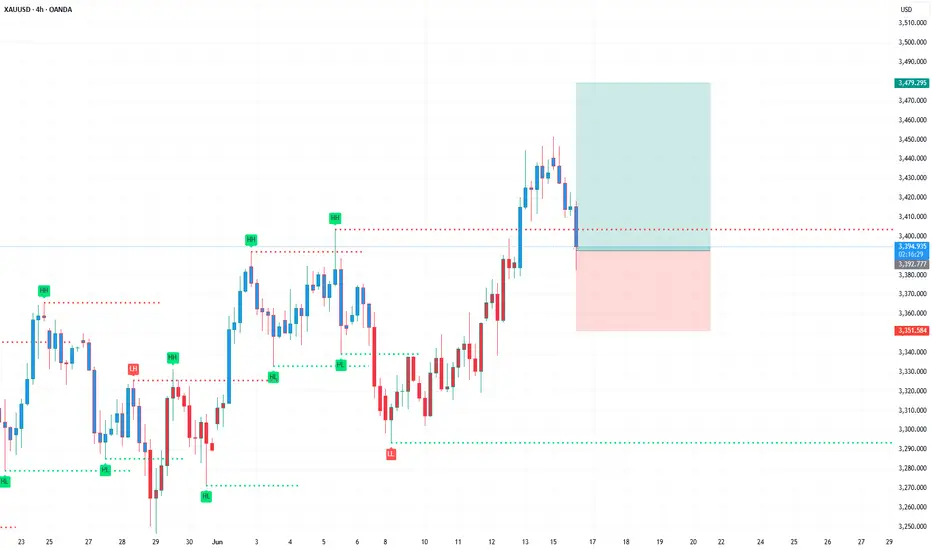
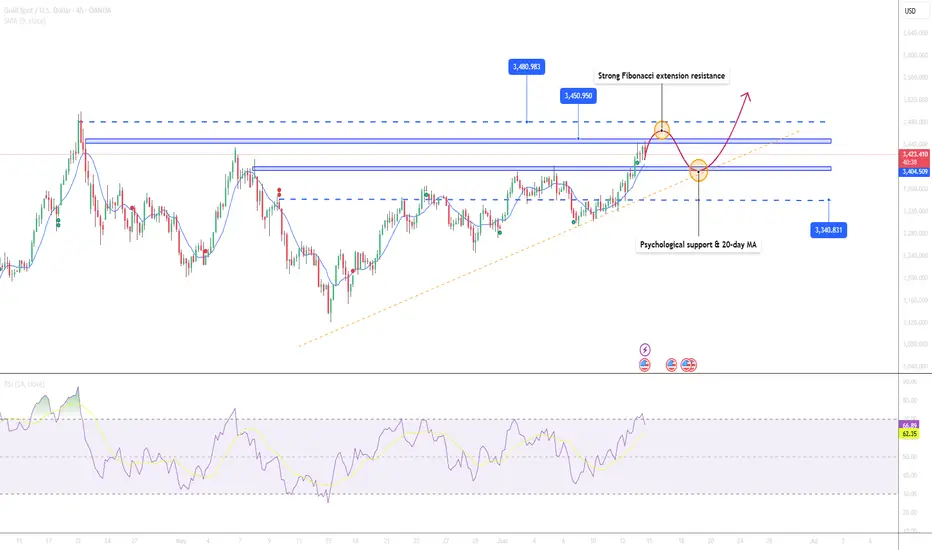
Gold Extends Rally as New High Emerges📊 Market Overview:
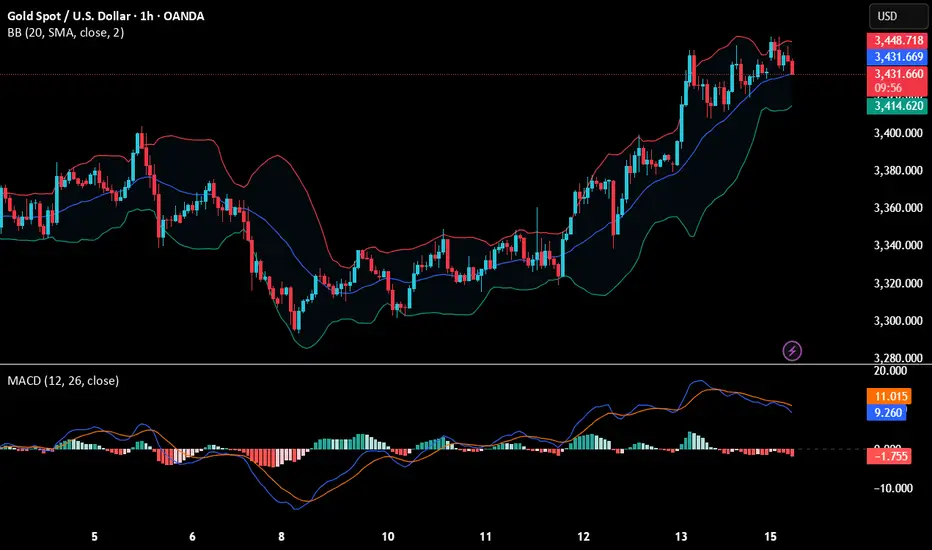
Gold reached a new intraday high at $3,447 today, supported by a weaker USD and stable U.S. Treasury yields. Prices then pulled back slightly to $3,423 amid short-term profit-taking. Ongoing geopolitical uncertainty and expectations that the Fed may hold or cut rates continue to drive demand for safe-haven assets like gold.
📉 Technical Analysis:
Key Resistance Levels:
• $3,447 – Intraday high on June 13
• $3,465 – Strong Fibonacci extension resistance
• $3,480 – Next upside target if price breaks above $3,447
Key Support Levels:
• $3,423 – Current price and intraday congestion zone
• $3,410 – Minor support on the H4 chart
• $3,400 – Psychological support & 20-day MA
• EMA: Price is trading above the 09-day EMA → short-term trend remains bullish
• Candlestick / Volume / Momentum:
Strong bullish candle with high volume; RSI at 67 indicates further upside potential. Short lower wicks suggest limited selling pressure. MACD on both H4 and daily charts favors continued upside momentum.
📌 Outlook:
Gold is likely to continue rising if it holds the $3,410–$3,423 support zone. A break above $3,447 may open the path toward $3,480 or higher.
💡 Suggested Trading Strategy:
🔺 BUY XAU/USD:
• Entry: $3,420 – $3,425
• 🎯 TP: $3,480
• ❌ SL: $3,408
🔻 SELL XAU/USD
• Entry: $3,445 – $3,450
• 🎯 TP: $3,423 – $3,410
• ❌ SL: $3,457
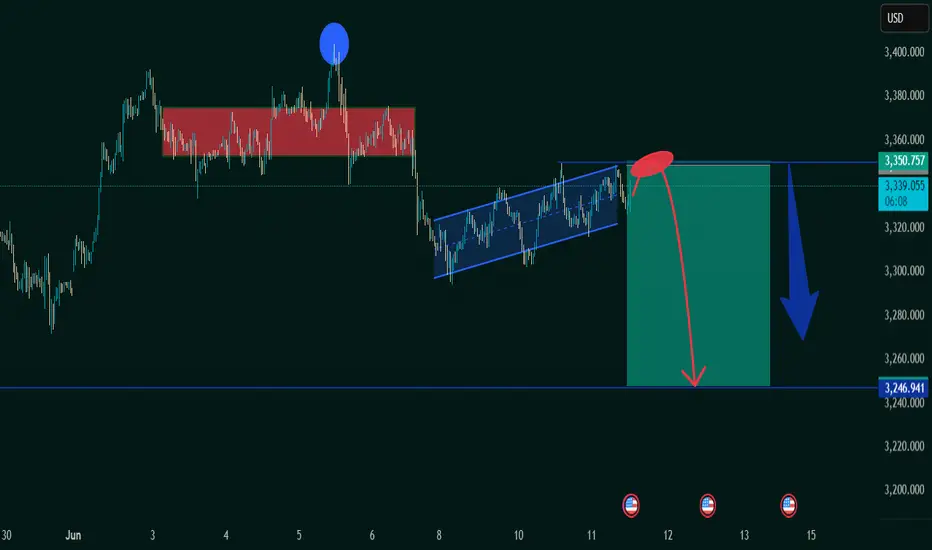
"XAU/USD Bearish Setup: Rising Channel Breakdown AnticipatedPrevious Resistance Zone (Red Rectangle):
The chart shows a clear resistance zone between ~3,340 and ~3,370 USD.
Price was rejected sharply from this zone earlier (marked by the large blue dot at the swing high).
Current Rising Channel (Blue Channel):
A rising wedge or ascending channel is forming, typically a bearish continuation pattern when found in a downtrend.
Price is currently testing the upper boundary of this pattern.
Bearish Projection (Red Path & Arrows):
The chart creator expects a rejection from the top of the channel, leading to a breakdown and a move toward the next key support at ~3,246.94 USD.
A large red arrow and projected box highlight the short setup zone with an implied favorable risk/reward ratio.
Support Target:
Blue horizontal line at 3,246.94 marks the next significant support level, likely a take-profit target for short sellers.
Macro Factors:
Three small icons indicate upcoming U.S. economic events, possibly influencing XAU/USD volatility and confirming the move.
✅ Summary:
Bias: Bearish
Pattern: Rising Channel (bearish structure)
Entry Zone: Around 3,350–3,360 USD (top of channel)
Target Zone: ~3,246 USD
Risk: Invalid if price closes strongly above the resistance zone (~3,370 USD)