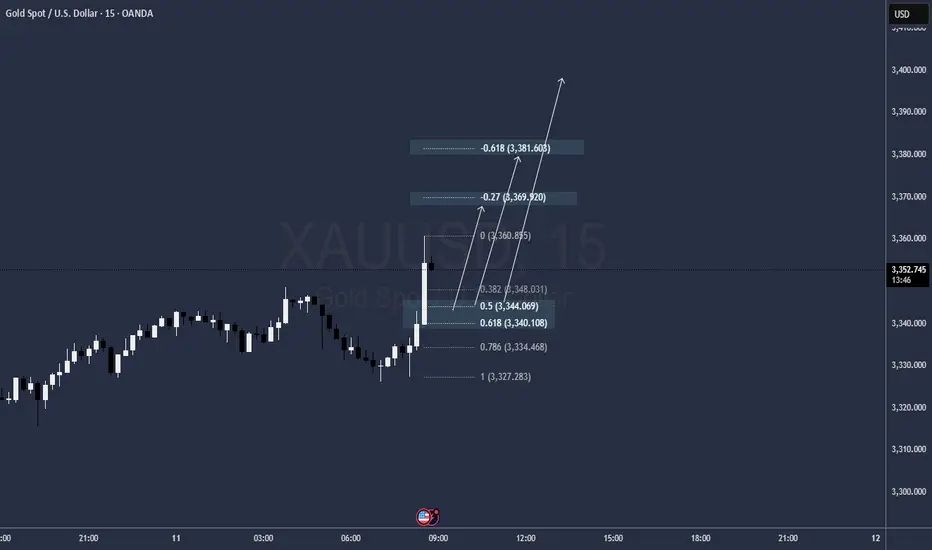
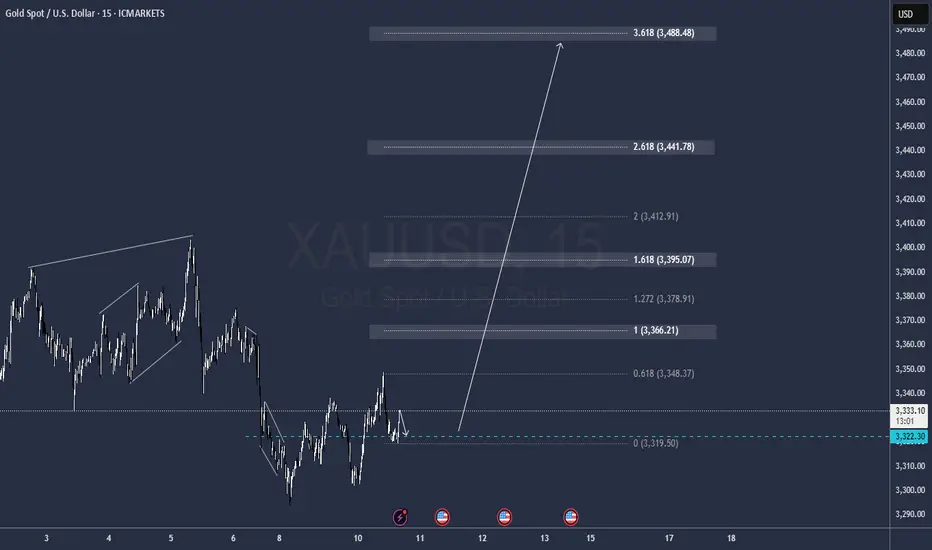
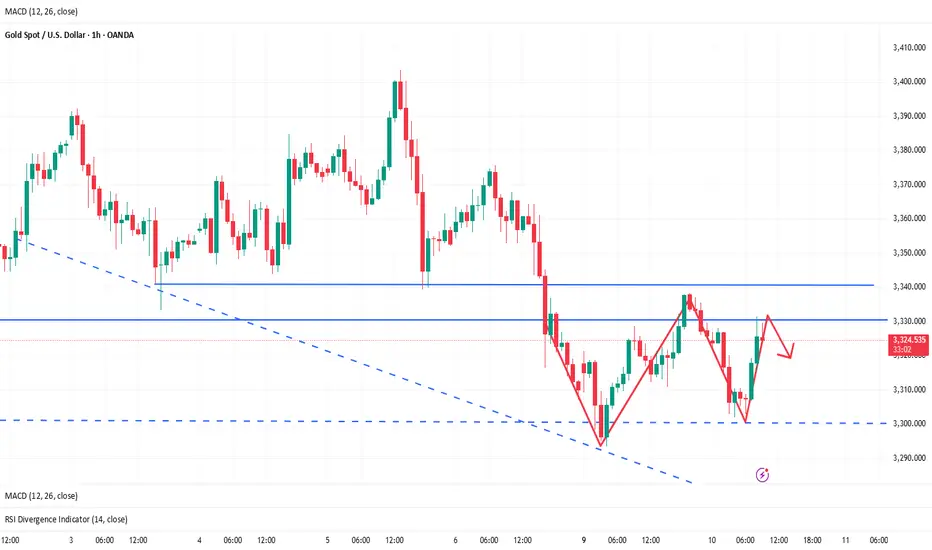
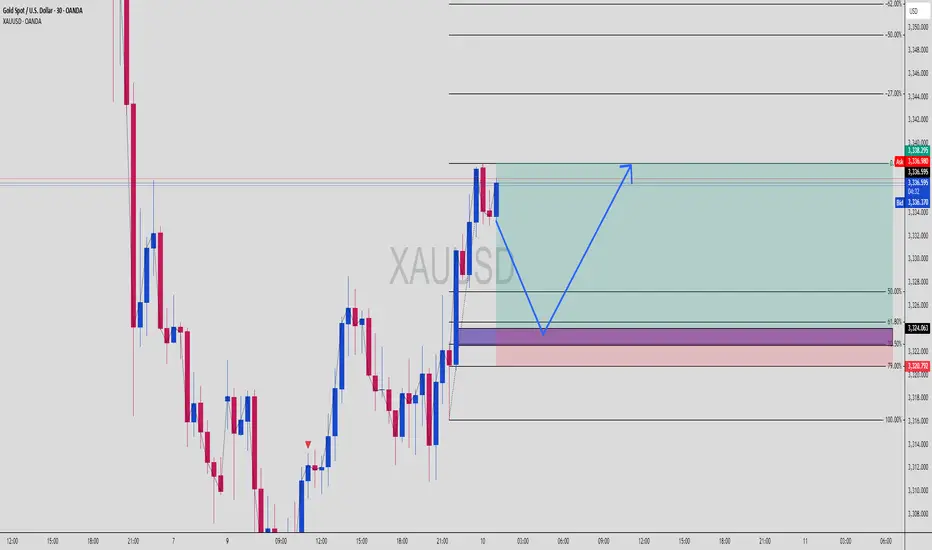
GOLD is a BUY doesnt Matter when you read thisanother chance to entry at 50
levels highlighted in the chart
gg
Goldlong
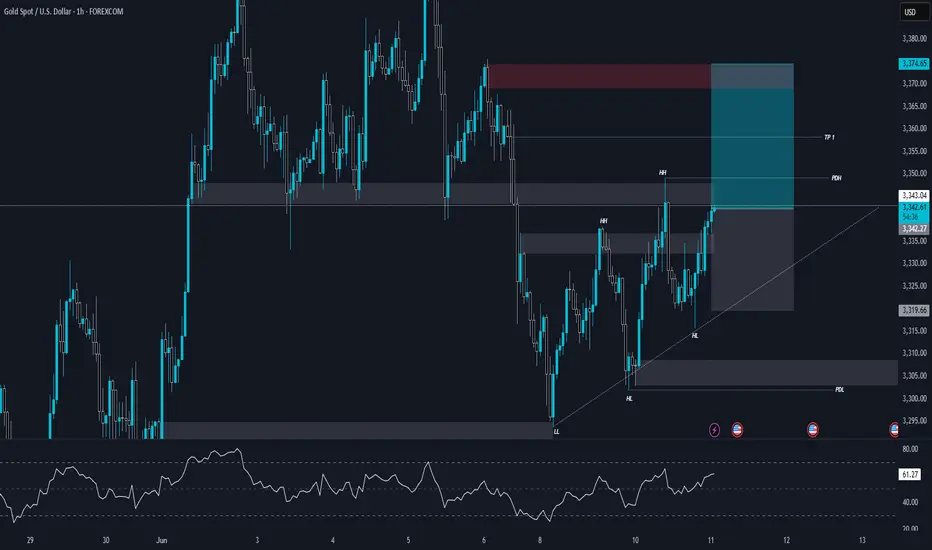
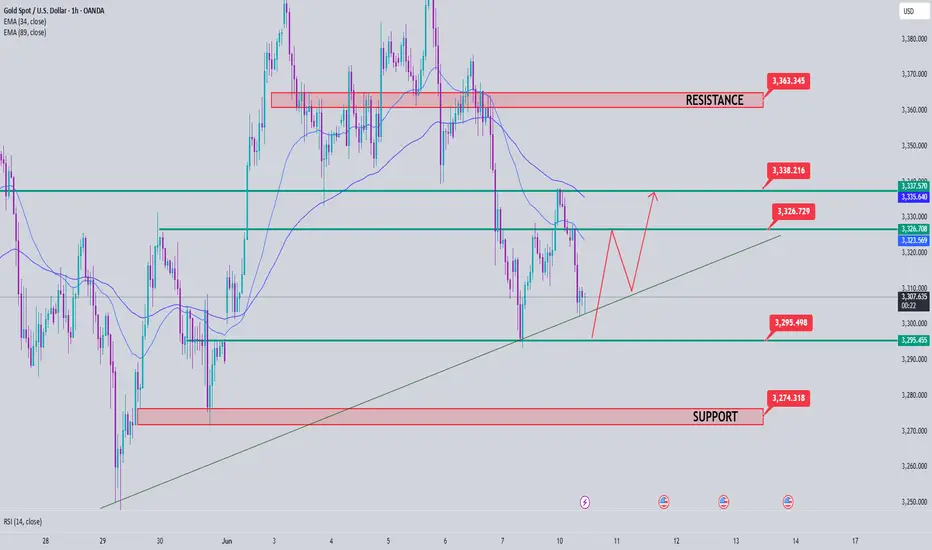
XAUUSD | 1H Chart Analysis | Uptrendurrently, Gold (XAUUSD) is showing bullish momentum after breaking previous market structure to the upside. Price has formed a clear Higher Low (HL) and Higher Highs (HH), indicating that short-term structure has shifted into an uptrend.
🔼 Key Technical Observations:
The previous LL (Lower Low) got broken, and price created a new HL, showing buyer pressure.
The bullish structure is supported by an ascending trendline.
Price is currently trading near PDH (Previous Day High) and approaching a key supply/resistance zone (highlighted in red).
RSI is still not in extreme zones but steadily climbing, showing strength in the current bullish move.
📊 Current Market Structure:
Shift from previous downtrend into short-term uptrend.
Formation of clear HL & HH.
Price respecting trendline support.
Clean bullish break of internal resistance levels.
📌 Potential Scenarios:
Scenario 1 (Bullish Continuation):
If price holds above the PDH and supply zone gets broken, we may see continuation toward TP1 and higher.
Scenario 2 (Rejection & Short-term Pullback):
If price faces strong rejection from the current supply zone, short-term retracement is possible toward the previous demand zones or trendline support.
Possible pullback zones: 3340 → 3320 → 3310 area.
✅ Bias: Short-Term Bullish
As long as price holds above the HL zone and trendline, bulls are in control. But keep an eye on price reaction around current supply zone for any signs of weakness or reversal.
CPI is coming, which direction should gold go?
True trading masters can maintain inner peace in the hustle and bustle of the market and are not confused by short-term fluctuations. They know that the short-term trend of the market is full of randomness, like ripples on the water, seemingly complicated but difficult to predict. They are like gatekeepers of the mind, with strong determination to resist the emotional interference of the market, and no matter how big the market fluctuations are, they will not let them lose their footing. When others are scared and want to sell their stocks quickly, they can keep their composure; when others are stimulated by the daily limit and want to chase high, they can hold the bottom line.
The international gold price opened at $3,325/ounce and closed at $3,322/ounce on the last trading day. The real part of the daily K-line fell by only $3/ounce and finally closed at the cross line. Yesterday, the gold price fluctuated slightly and closed down, mainly because of the market's attention to the progress of Sino-US trade negotiations. The market generally believes that if the negotiations can ease trade tensions and boost the global economy, it will weaken the demand for safe-haven assets. At the same time, the strengthening of the US dollar also brings downward pressure on gold.
Weekly candlestick chart: running in the rising channel, long-term buy on dips
Daily candlestick chart: running in disordered oscillation structure, cautiously wait and see in the medium term
4-hour chart: running in an oscillating bullish trend, short-term buy on dips
30-minute chart: bottom structure established, short-term buy on dips above 3326
Intraday plan to continue to buy in the 3332 area, defend 3325, target 3350-60
Gold is in a state of shock again, the market is waiting for CPI📰 Impact of news:
1. May CPI data
📈 Market analysis:
Gold is still fluctuating, and the bulls and bears are currently in a stalemate. The market is waiting for the release of today's CPI data. From the 1H chart, the Bollinger Bands are narrowing, and the gold price is above the 3331 middle track. RSI is stuck at 55, and the MACD golden cross green column is narrowing. For short-term trading, pay attention to the resistance of 3340-3350, and the support of 3320-3310 below.
🏅 Trading strategies:
SELL 3340-3350
TP 3320-3310-3300
BUY 3320-3310
TP 3330-3345
If you agree with this view, or have a better idea, please leave a message in the comment area. I look forward to hearing different voices.
OANDA:XAUUSD FX:XAUUSD FOREXCOM:XAUUSD FXOPEN:XAUUSD TVC:GOLD

GOLD M30 intraday chart update for 11 June 25Hello Trader, Welcome to the US CPI Day
AS you can see that market is still below 3350 Psychological level with given rewards multi-time from that level
now all eyes on US CPI if market successfully breaks 3350-60 zone today the it will move towards 3370/80 or even 3400 psychological level
below 3350 psychological level market remains bearish for shorter term
Disclaimer: Forex is Risky

Will gold continue its uptrend from the 3,300 USD level?Hello dear traders!
Gold prices continued to decline against the US Dollar (USD) on Friday, falling below the previous psychological support level, which is now resistance, at 3,350 USD. The main reason was that the US Dollar gained some positive momentum as the market leaned toward the Fed maintaining its current policy in July following the May report, causing XAUUSD to move lower into the weekend.
From a technical perspective, as previously analyzed, gold broke below the psychological support level of 3,350 USD on Friday, with prices approaching the 3,300 USD support level at the time of writing. However, the RSI has dropped to the 30 level, indicating that selling pressure may be losing momentum, and global economic stress could potentially limit further losses.
Gold rebounds and repairs, is it a shock or a bull market?📰 Impact of news:
1. Geopolitical situation
2. Impact of the US dollar trend on gold
📈 Market analysis:
At the gold hourly level, after the pressure in the Asian session in the morning, it directly fell to the vicinity of 3302. The big Yin effectively lost the lower track of the descending flag consolidation channel. The original 3318 line was the confirmation of the channel counter-pressure point, which happened to be the 61.8% split resistance level at that time. At the same time, it lost the middle track. Therefore, we gave a trading idea of looking at the rebound under pressure and continuing to decline in the European session. As a result, the market directly took a V-shaped wash-up and once pulled up to the vicinity of 3342.
The European session fluctuated strongly and rose. Before and after the US session, it took advantage of the retracement to lure the short position, and there is still the possibility of a second pull-up space. Therefore, in the subsequent retracement support level, pay attention to two positions, one is 3322-3324, and the other is the 61.8% division support level of 3318. If it stabilizes, there is a high probability that there will be a second upward space, pointing to 3348. If the pressure here cannot be overcome, the bottom will continue to oscillate back and forth. At that time, it will fall back to see if a secondary low point can be formed to further stabilize the support. If it goes straight through and stands on it, 3293 may already be the short-term low.
On the whole, I still hold short orders before the effective breakthrough of 3345, but at the same time, as the gold price rebounds and moves upward, the short-term support level is temporarily expected to be 3325-3320.
🏅 Trading strategies:
SELL 3335-3345
TP 3325-3315
BUY 3325-3330
TP 3350-3360
If you agree with this view, or have a better idea, please leave a message in the comment area. I look forward to hearing different voices.
TVC:GOLD FXOPEN:XAUUSD FOREXCOM:XAUUSD FX:XAUUSD OANDA:XAUUSD
$Gold Fills the Gap – Is a Bullish Bounce Toward $3350 Next?By examining the gold chart on the 4-hour timeframe, we can see that in last week’s analysis, the price successfully hit all four targets: $3338, $3332, $3326, and $3317, and finally closed on Friday at $3309. This move delivered over 390 pips of return, and I hope you made the most out of it!
Now, let’s move on to the latest gold analysis: As you can see, today gold dropped to the $3294 zone, finally filling the liquidity gap previously marked on the chart. Currently, gold is trading around $3315, and I expect further bullish movement toward the $3330 area as the first upside target.
After that, we should closely watch the $3332–$3352 zone for a potential corrective reaction.
There are more details in this analysis that I’ll share soon — with your support!
THE MAIN TA :
Gold price rebounds and then falls
The current trend is similar to that of Monday. Now that the market has continued to rise, we should not rush to guess the top. The idea is to follow the trend and wait for the stagflation signal to appear before looking at the callback. At present, the turning point of this wave is roughly expected to be around 3338. After the turning point appears, I will prompt you to participate in short orders to watch the callback. The callback position is expected to be around 3312. That is, the idea of European trading is to participate in short orders near 3338, with the target near 3315; after there is a stop-loss signal near 3312 below, participate in long orders.
Gold at risk if US–China talks fail📊 Market Overview:
• Spot gold is trading around $3,309–$3,311/oz (according to TradingEconomics, Kitco…), slightly down by 0.5% as markets await the outcome of US–China trade talks in London.
• The US dollar has eased following some positive signals from the talks, but overall market caution remains high ahead of the June 11 CPI release and the upcoming Federal Reserve decision.
📉 Technical Analysis:
• Key resistance: $3,340 (June consolidation ceiling); further upside at $3,353–$3,370 if a breakout occurs.
• Nearest support: $3,298 (monthly pivot); if breached, price may move toward $3,270 → $3,243.
• EMA09/EMA20/EMA50: Price is trading below the short- to mid-term EMAs, indicating a consolidating or slightly bearish trend.
• Candlestick/momentum: Sideways structure within $3,298–$3,332; weak momentum. RSI and Stochastic are below mid-levels, signaling market caution.
📌 Outlook:
• Gold may continue to consolidate or edge lower in the short term if the US–China negotiations fail to deliver a significant breakthrough and no strong bullish data emerges.
• Conversely, any signs of renewed tension, failed trade talks, or unexpectedly high inflation figures could reignite bullish momentum and push prices back toward the $3,332–$3,370 range.
________________________________________
💡 Trade Strategy Suggestion:
➡️ SELL XAU/USD
Entry: $3,330–$3,335
• 🎯 TP: ~$3,310
• ❌ SL: $3,345
➡️ BUY XAU/USD
Entry: $3,298–$3,305
• 🎯 TP: ~$3,320
• ❌ SL: $3,288

Gold rises and then falls, short at 3330📰 Impact of news:
1. Geopolitical situation
2. Impact of the US dollar trend on gold
📈 Market analysis:
Gold rebounded again after falling to 3301, but the upper 3330-3340 line still has strong suppression on gold. Judging from the current trend, because the gold price has risen in the short term and returned to the 3325-3327 line, the short-term resistance is still 3330-3335 and it is expected to fall under pressure. Look for the 3315-3310 position. If it falls below this support, look down to the 3300-3290 line.
🏅 Trading strategies:
SELL 3330-3340
TP 3315-3310-3300
If you agree with this view, or have a better idea, please leave a message in the comment area. I look forward to hearing different voices.
OANDA:XAUUSD FX:XAUUSD FOREXCOM:XAUUSD FXOPEN:XAUUSD TVC:GOLD
Gold Price Analysis June 10Gold price reacted at the Trenline and EMA 34 yesterday and bounced back but still closed below the breakout zone of 3335.
The downtrend can still continue as long as 3335 remains strong today.
H4 shows the provincial port area at 3295 and 3275 in the opposite direction of the provincial port at 3339 and 3365.
H1 is still forming a clear downtrend. 3309 is the immediate resistance zone. is the price zone that can scalp breakout if it closes above this zone. break 3309 Gold will head to 3327 in this zone, if you want to SELL, you have to wait for confirmation from the selling candle. When the buyers push the price strongly through 3327, you have to wait for the US session resistance around 3338 yesterday. Resistance and support during the day are noted around 3275 and 3365
$XAU (GOLD) 15M AnalysisPrice rallied strongly into a bearish FVG (Fair Value Gap) around 3,335 after reclaiming demand...However, this rally lacked conviction and broke structure to the downside, forming a lower high and a weak low retest.
Ideal short setup:
Price returns into the FVG, rejects around 3,333–3,335, then shows signs of displacement downward.
First target: Break below 3,325.
Invalidation: Clean break and close above 3,336.
Bias: Short from FVG zone.
Target: 3,294 area of liquidity.
This is a classic liquidity sweep + FVG rejection setup.
Reclaim of the trendline after sweep.
Price to revisit the FVG zone around 3,335.
Final rejection and breakdown toward 3,294.
Silver & Gold Surge: SLV Inflows & GLD TargetsThe precious metals market is currently experiencing a significant surge, with both silver and gold capturing the attention of investors worldwide. This rally is underpinned by a confluence of factors, ranging from robust investment inflows into exchange-traded funds (ETFs) to evolving macroeconomic landscapes and persistent geopolitical uncertainties. The iShares Silver Trust (SLV) ETF has witnessed an unprecedented influx of capital, signaling a strong bullish sentiment for the white metal, while gold, represented by the GLD, is poised for a potential rebound, with analysts eyeing key price levels. Understanding the intricate dynamics driving these movements is crucial for anyone looking to navigate the contemporary financial markets.
SLV ETF Inflows Surge: Silver's Accelerated Rally
The iShares Silver Trust (SLV), the world's largest silver-backed exchange-traded fund, has recently recorded its most substantial inflows in years, marking a pivotal moment for the silver market. Last week alone, the SLV ETF saw weekly inflows surge by $451 million, a dramatic increase from previous weeks, pushing its year-to-date inflows to over $458 million and its total assets under management to more than $17 billion. This remarkable accumulation of capital into SLV signifies a profound shift in investor sentiment, reflecting a strong conviction that silver prices are set for continued appreciation. When investors pour money into an ETF like SLV, it directly translates into the fund acquiring more physical silver, thereby tightening supply and exerting upward pressure on prices. This massive inflow is not merely speculative; it indicates a broad-based belief among both institutional and retail investors in silver's potential.
Several key factors are fueling this accelerated rally in silver prices. One significant driver is the record-breaking surge in gold prices. Historically, silver has often been referred to as "poor man's gold" due to its similar safe-haven properties but lower price point. When gold experiences a substantial rally, silver often follows suit, as investors look for a more affordable alternative within the precious metals complex. Gold's recent ascent to nearly $3,500 per ounce has undoubtedly created a halo effect for silver, drawing in capital from those seeking exposure to precious metals without the higher entry cost of gold.
Another compelling reason for silver's outperformance is its perceived undervaluation relative to gold. The gold/silver ratio, which measures how many ounces of silver are needed to buy one ounce of gold, had peaked at around 106 when gold was surging. However, this ratio has since dropped significantly to around 92, indicating that silver has begun to catch up, suggesting it was previously undervalued. This rebalancing of the ratio has encouraged investors to shift their focus towards silver, anticipating further narrowing of the gap.
Beyond its role as a monetary metal and safe haven, industrial demand plays a uniquely critical role in silver's price dynamics, distinguishing it from gold. Silver is an indispensable component in numerous high-tech and green energy applications due to its exceptional electrical conductivity, thermal properties, and reflectivity. The renewable energy sector, particularly photovoltaic (PV) solar panels, consumes substantial amounts of silver, with each panel containing approximately 20 grams of the metal. The global push towards decarbonization and the increasing adoption of solar energy are creating an insatiable demand for silver. Additionally, its use in electric vehicles (EVs), electronics manufacturing, 5G technology, and medical devices further bolsters its industrial consumption. Reports indicate that global silver demand reached 1.2 billion ounces in 2024, driven by these industrial applications, with a significant supply deficit projected to continue. This robust and growing industrial demand provides a strong fundamental floor for silver prices, making it less susceptible to purely speculative swings.
Geopolitical tensions and economic uncertainties also contribute to silver's appeal as a safe-haven asset. In times of global instability, investors tend to flock to tangible assets like precious metals to preserve wealth. While gold typically garners more attention in such scenarios, silver also benefits from this flight to safety. The ongoing geopolitical developments and concerns about inflation continue to reinforce the attractiveness of both gold and silver as hedges against economic volatility and currency depreciation.
From a technical analysis perspective, silver's rally appears robust. The iShares Silver Trust (SLV) has broken above significant resistance levels, such as $31.75, which had previously acted as a ceiling. The ETF is trading well above its 50-day and 100-day Exponential Moving Averages (EMA), indicating a strong bullish trend. While the Relative Strength Index (RSI) has moved closer to overbought levels, the overall trend remains bullish, and the MACD indicator continues to signal upward momentum. Analysts suggest that if these technical indicators hold, silver could target the $40 mark in the near future. The breadth of participation from both institutional and retail investors, coupled with increasing trading volumes, suggests that this rally has stronger foundations than typical short-term spikes.
Furthermore, expectations of potential interest rate cuts by the US Federal Reserve are also providing tailwinds for precious metals. Lower interest rates reduce the opportunity cost of holding non-yielding assets like silver and gold, making them more attractive to investors. The anticipation of such policy shifts often prompts investors to front-run these decisions, leading to increased demand for precious metals.
GLD ETF Weekly Forecast: Gold's Rebound Potential
While silver commands attention with its recent surge, gold, represented by the GLD remains the cornerstone of the precious metals market. Gold recently hit record highs, touching nearly $3,500 per ounce, before experiencing a slight retreat due to profit-taking and some strengthening of the US Dollar. However, analysts are now forecasting a potential rebound, with a target of $3430 on the cards for the current week, indicating that the bullish sentiment for gold remains largely intact.
GLD is influenced by a diverse array of factors, making its price movements complex yet predictable to those who understand its drivers. One of the primary factors is gold's status as a safe-haven asset. During periods of economic uncertainty, political instability, or market volatility, investors traditionally turn to gold to preserve capital. Recent geopolitical tensions, such as the ongoing conflict in Eastern Europe, have consistently driven inflows into gold, as it acts as a hedge against global crises.
The strength or weakness of the US Dollar plays a crucial role in gold's price. Gold is primarily priced in US Dollars, meaning that a weaker dollar makes gold comparatively cheaper for buyers holding other currencies, thereby increasing demand and pushing prices up. Conversely, a stronger dollar can make gold more expensive, potentially dampening demand. While there has been some recent dollar strength, the overall sentiment regarding the dollar's long-term trajectory and its inverse relationship with gold remains a key determinant.
Interest rates and monetary policy, particularly from the US Federal Reserve, significantly impact gold prices. As a non-yielding asset, gold becomes less attractive when interest rates are high, as investors can earn better returns from interest-bearing assets. Conversely, lower interest rates reduce the opportunity cost of holding gold, making it more appealing. The anticipation of future rate cuts by central banks often provides a strong impetus for gold rallies.
Inflation and deflationary pressures also influence gold's appeal. Gold is widely regarded as a hedge against inflation. When the purchasing power of fiat currencies erodes due to rising inflation, investors often turn to gold to protect their wealth. Conversely, in deflationary environments, gold's appeal as a store of value can also increase. Recent inflation data, such as the Consumer Price Index (CPI) and Producer Price Index (PPI), are closely watched for their potential impact on gold's trajectory.
Central bank reserves and their purchasing trends are another significant, albeit often overlooked, factor. Central banks globally hold gold as a reserve asset to diversify their portfolios and safeguard against financial turmoil. Increased gold purchases by central banks signal a broader institutional confidence in gold and can significantly impact its demand and price.
Supply and demand dynamics in the physical gold market, including mining production, recycling, and demand from jewelry and industrial sectors, also play a role. While new supply from mining is relatively small compared to the total existing stock, changes in production levels can still influence prices. Investment demand through ETFs and other financial products further contributes to the overall demand picture.
From a technical standpoint, gold's recent retreat from its $3,500 peak has led to some profit-taking. However, key support levels are being tested, and analysts are looking for a rebound. The immediate resistance levels are around $3340-$3345, with a more significant hurdle at $3400. A decisive break above these levels, particularly $3400, could pave the way for a retest of the $3430 mark and potentially higher, towards $3500 and even $3600. The current bias for gold remains bullish, with buying opportunities identified at key pivot levels. The market is closely watching economic reports, such as the upcoming CPI data, as well as geopolitical developments, which could act as catalysts for gold's next major move.
The Interplay Between Gold and Silver
The intertwined fortunes of gold and silver are a recurring theme in the precious metals market. While both are considered safe-haven assets, their individual characteristics lead to nuanced differences in their price drivers. Gold is predominantly viewed as a monetary asset and a store of value, making it highly sensitive to macroeconomic indicators, interest rates, and geopolitical stability. Silver, while sharing these attributes, also benefits significantly from its extensive industrial applications. This dual nature often makes silver more volatile than gold, as it reacts to both investment demand and industrial cycles.
The recent outperformance of silver, as evidenced by the massive SLV ETF inflows, suggests a market correction where silver is catching up to gold's earlier gains. The narrowing gold-silver ratio indicates that investors believe silver was undervalued and is now reasserting its true worth. This dynamic creates a powerful feedback loop: as gold rallies, it draws attention to the precious metals sector, prompting investors to look for relative value, which often leads them to silver. As silver then accelerates, it further validates the strength of the broader precious metals market.
The current environment, characterized by persistent inflation concerns, ongoing geopolitical tensions, and the global push towards green energy technologies, provides a fertile ground for both gold and silver. Gold offers a traditional hedge against uncertainty, while silver provides exposure to both safe-haven demand and the booming industrial sector. The significant institutional inflows into SLV underscore a growing recognition of silver's unique position at the intersection of finance and industry.
In conclusion, the precious metals market is currently in a robust uptrend, driven by a powerful combination of investment demand, safe-haven appeal, and fundamental industrial growth. The unprecedented inflows into the SLV ETF signal a strong bullish outlook for silver, fueled by its undervaluation relative to gold and its critical role in emerging green technologies. Concurrently, gold, despite recent fluctuations, maintains a strong bullish bias, with analysts forecasting a rebound to key price levels, supported by its enduring safe-haven status and macroeconomic tailwinds. For investors, understanding these intertwined dynamics and monitoring key economic and geopolitical developments will be paramount in capitalizing on the ongoing rally in both gold and silver. The message is clear: the precious metals are shining bright, and their current momentum suggests further upside potential.
XAUUSD Bullish Reversal: Discount OB + Fib Stack = Buy SetupXAUUSD (30-Min) | Discount Reversal Zone + Fib Confluence = Smart Long Setup
This GOLD setup is built like a sniper’s dream — liquidity engineered, OB discounted, Fib alignment — all signs point to a bullish reaction off a Smart Money zone.
🔍 Smart Money Setup Breakdown:
🟣 Bullish Order Block (OB)
OB identified between 3,320.792 and 3,324.063
Price is retracing into this discount OB zone
This level also aligns with 70.5% – 79% Fib retracement — high-probability reaction zone
📐 Fibonacci Confluence
Fib drawn from swing low to recent high
61.8%, 70.5%, and 79% zones stacked directly over the OB
This confluence amplifies the chances of institutional buying
📉 Engineered Liquidity + Wick Zone
Price is likely to dip into this OB zone to hunt stop losses
Expect wick reaction, then reversal — typical Smart Money behavior
Anticipated pattern: Drop > Tap > Reverse bullish
📈 Anticipated Price Path
Price dips into OB zone
Strong bullish engulfing expected for confirmation
Targeting retracement to previous high & extension levels
🧠 Chart Ninja Entry Plan:
🔹 Entry Zone 3,320.792 – 3,324.063 (Discount OB)
🔺 SL Below 3,316.000 (below 100% Fib / low structure)
📈 TP 1 3,336.080 (Recent high)
📈 TP 2 3,342.000 – 3,348.000 (Fib extensions -27% to -50%)
⚖️ RRR 1:3 to 1:5 depending on execution and TP
🧠 Chart Ninja Wisdom:
"Gold always dips to discount before it runs —
but only the patient ninjas catch it while others panic." 🥷💰
🔁 Bonus Insight:
Price is currently compressing near equilibrium — meaning volatility is building. The next impulse could be fast. Wait for bullish confirmation candle on the OB tap for low-risk entry.
📊 Drop this zone into your chart and alert the OB area!
💬 Where are you placing your stop loss for this setup? Let’s chat!
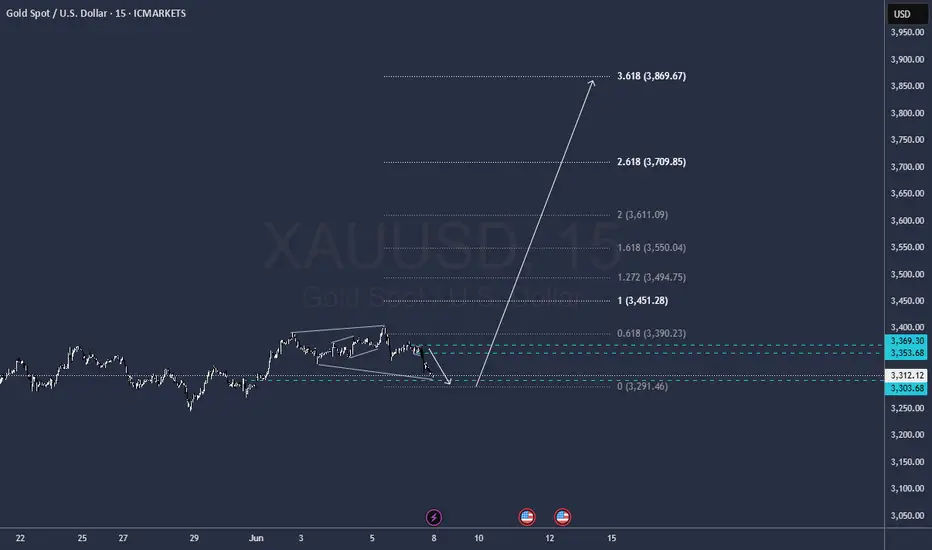
GOLD, sell your house and buy GOLDOK big move almost ready
Sel your house your dog your wife ad Buy Gold @ 3.290
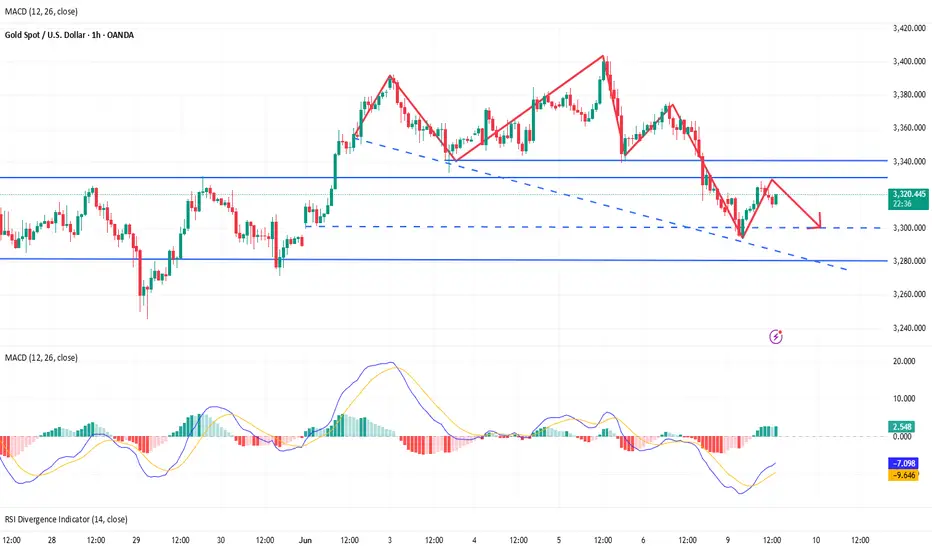
Gold rebound fails to change the trend and is still bearish?📰 Impact of news:
1. The streets of Los Angeles are full of "gunpowder smell"! Immigration protests escalate, and Trump sends troops to suppress them
2. Geopolitical situation
3. Federal Reserve political expectations
📈 Market analysis:
At the hourly level: the Bollinger Band opening is narrowing, the MACD technical indicator is running in a golden cross, and the RSI fluctuates frequently in the short term. There is a certain potential for short-term promotion. If the gold price stabilizes above 3315, it may trigger a rebound and touch 3330-3340 again. If the gold price continues to be below 3300 and the short position is strengthened, it may fall to a new low. Therefore, if it rebounds again to the 3330-3340 resistance line, short positions can still be considered.
🏅 Trading strategies:
BUY 3315-3318
TP 3330-3335
SELL 3330-3340
TP 3300-3290-3280
If you agree with this view, or have a better idea, please leave a message in the comment area. I look forward to hearing different voices.
OANDA:XAUUSD FX:XAUUSD FOREXCOM:XAUUSD FXOPEN:XAUUSD TVC:GOLD
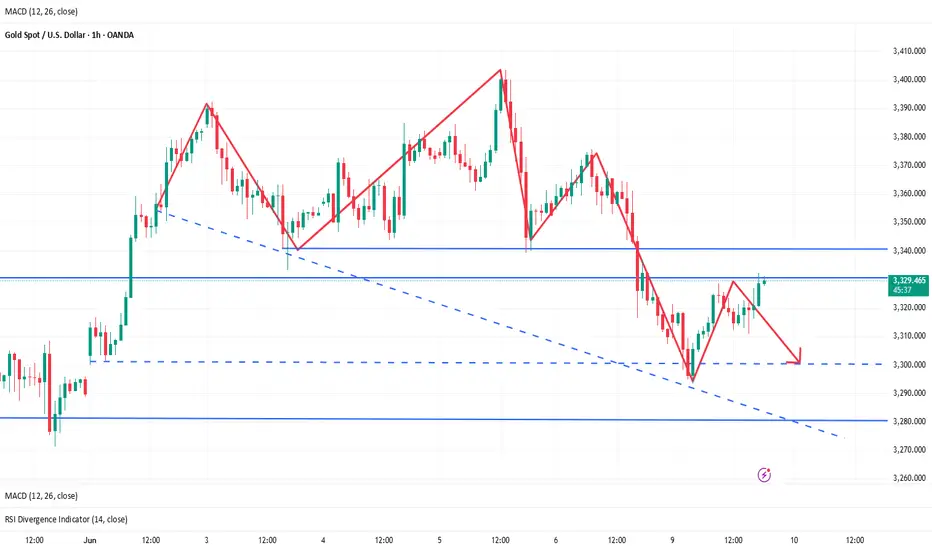
Evening gold trend analysis and operation layout📰 Impact of news:
1. The streets of Los Angeles are full of "gunpowder smell"! Immigration protests escalate, and Trump sends troops to suppress them
2. Geopolitical situation
3. Federal Reserve political expectations
📈 Market analysis:
Gold rebounded as expected and touched the 3330 line. In the short term we need to pay attention to the 3335 line. On the one hand, it is the top and bottom, and on the other hand, the annual average line is also the pressure point of the upper track of the downward channel. Once it is suppressed below 3335, it will continue to fluctuate downward. If it unexpectedly breaks through 3335 or even 3340, then 3293 is likely to become the short-term bottom.
At present, the rise has slowed down after rising to 3330, and the technical side shows a top divergence signal, so in the short term, we still maintain the idea of shorting at a high level of fluctuation.
🏅 Trading strategies:
SELL 3335-3345-3355
TP 3310-3300
If you agree with this view, or have a better idea, please leave a message in the comment area. I look forward to hearing different voices.
TVC:GOLD FXOPEN:XAUUSD FOREXCOM:XAUUSD FX:XAUUSD OANDA:XAUUSD
Gold rebound is difficult to change the current weakness
Gold prices have risen strongly in 2025 and continue to hit new highs. It is worth noting that gold prices have risen by more than 25% so far this year, but have recently retreated as the latest US non-farm payrolls report showed continued strength in the labor market. At the same time, the rebound in gold prices in 2025 was largely driven by uncertainty over Sino-US trade tensions and broader geopolitical risks, which led to sharp stock market fluctuations.
However, a call between the leaders of China and the United States last Friday eased concerns about the trade war, causing gold prices to extend their decline. Although underlying concerns remain, the call briefly calmed investors' nerves.
Views on today's gold trend
The European session continued to retreat and the lowest price reached 3293, then slowly strengthened. The current highest price reached 3328, which is still a little short of our expected highest price of 3330. Therefore, today's strategy does not need to be changed for the time being. If the current market price reaches 3330-35 again, short orders can still be entered. The current trend is still weak, and there is a high probability that it will fall for the second time. Therefore, the current idea of shorting on pullback remains unchanged for the time being.
Gold: short at 3330-3335 on rebound, defend above 40, and target 3290-3280

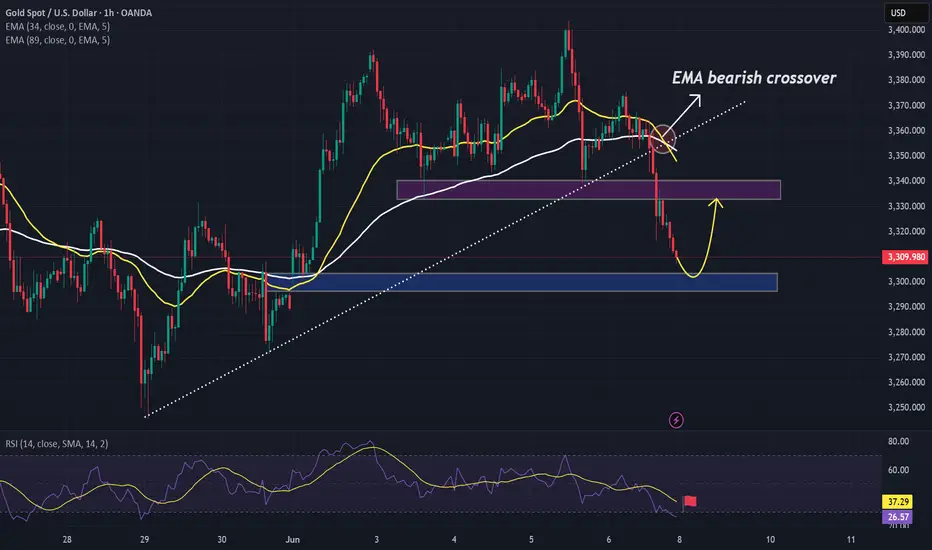
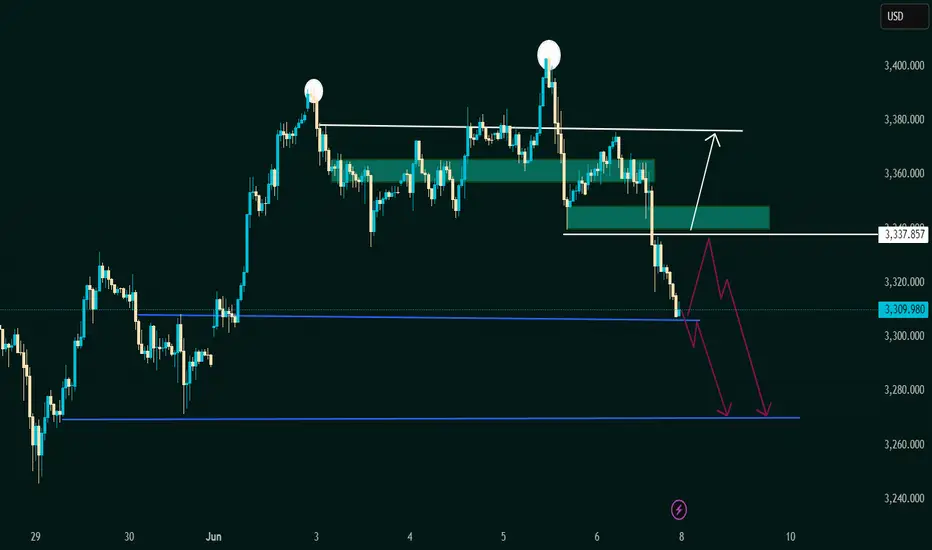
Potential Breakdown with Retest or Reversal Zone –This chart represents a classic Double Top pattern, a bearish reversal signal indicating strong resistance around the 3,380 - 3,390 USD zone (marked with two white circles).
---
🔍 Key Zones and Levels:
1. Resistance Zone (~3,380 - 3,390 USD):
Price was rejected twice here.
Suggests strong selling pressure and buyer exhaustion.
2. Mid Support/Retest Zone (~3,337.857 USD):
Marked with a horizontal white line.
Could act as a short-term resistance if price retraces.
3. Demand Zone (~3,330 - 3,337 USD):
Highlighted green box: potential reversal/retest zone.
Bullish scenario: price bounces from here and heads back to retest resistance.
4. Current Price (~3,309.980 USD):
Price has broken below the demand zone and is approaching strong horizontal support.
5. Lower Support (~3,265 - 3,270 USD):
Highlighted with blue horizontal lines and purple arrows.
Could be the next bearish target if breakdown is confirmed.
---
🔄 Two Possible Scenarios:
📉 Bearish Continuation:
Price retests the broken demand zone (now resistance).
Rejects and forms a lower high.
Falls toward the lower support around 3,265–3,270 USD.
📈 Bullish Reversal:
Price reclaims the green demand zone.
Pushes above 3,337.857 USD level.
Heads back to retest the double top area (~3,380 USD).
---
✅ Conclusion:
The bias is currently bearish, supported by:
Double top formation.
Breakdown below key demand zone.
Momentum favoring further downside.
However, a bullish reversal is possible if price reclaims the 3,337 USD zone and shows strong bullish structure.
Gold weakness continues, bears continue to exert force📰 Impact of news:
1. The streets of Los Angeles are full of "gunpowder smell"! Immigration protests escalate, and Trump sends troops to suppress them
2. Geopolitical situation
3. Federal Reserve political expectations
📈 Market analysis:
At present, the hourly moving average of gold price is spreading downward. At the same time, the 4H chart has retreated from a high and lost the middle track, breaking through the rising trend line. The low point of the trend line coincides with the middle track. Today's operation uses the low point of 3330-3335 as the critical point of strength and weakness. If the market rebounds below this range, you can just go bearish. If it breaks through this dividing point, you need to be cautious. On the whole, the recommended short-term operation strategy for gold today is to mainly short on rebound. Focus on the resistance of 3330-3340 on the upper side in the short term, and focus on the support of 3290-3280 on the lower side in the short term. The market fluctuates greatly, and stop loss is strictly controlled!
🏅 Trading strategies:
SELL 3325-3335
TP 3300-3290-3280
If you agree with this view, or have a better idea, please leave a message in the comment area. I look forward to hearing different voices.
TVC:GOLD FXOPEN:XAUUSD FOREXCOM:XAUUSD FX:XAUUSD OANDA:XAUUSD

GOLD - TIME TO DIGGING GOLDTeam, we do not often trade gold, but when we do, we kill them
I have been waiting for a few days for my entry-level setup.
Please follow the strategy and structure below
Target 1 - take 50% volume
Target 2 - take 30%
Target 3 - all your
WITH RISK management, make sure once it hits 1st target, bring stop loss to BE
I look forward to killing GOLD together.
If you see my videos, 95% of my target is always hit.
Please NOTE: i still hold my short UK100/FTSE100 and AUS200 as well.. This week, we should hit our target for both.
