The long strategy has been successful, pullback and go long📰 Impact of news:
1. European Central Bank deposit facility rate in the eurozone as of June 5
2. Initial jobless claims data
3. Non-farm payroll data
4. Worsening geopolitical situation
📈 Market analysis:
At present, the gold price has broken through the previous highs of 3392 and 3395. There is no obvious peak signal in the short term. At the same time, as the gold price continues to rise, the lower support will also move up in the short term, and the 4HMACD has a golden cross trend. In the short term, pay attention to the 3385 support below and the 3410 resistance above. The 1H indicator is close to the overbought area. We still need to be vigilant about the risk of rising and falling. If the gold price retreats to 3390-3385, we can consider going long with a light position.
🏅 Trading strategies:
BUY 3390-3385-3375
TP 3400-3410
If you agree with this view, or have a better idea, please leave a message in the comment area. I look forward to hearing different voices.
OANDA:XAUUSD FX:XAUUSD FOREXCOM:XAUUSD FXOPEN:XAUUSD TVC:GOLD
Goldlong

Is there still a chance for a bull market in gold's decline?📰 Impact of news:
1. European Central Bank deposit facility rate in the eurozone as of June 5
2. Initial jobless claims data
3. Non-farm payroll data
4. Worsening geopolitical situation
5. Watch the impact of the dialogue between Trump and Xi Jinping on gold
📈 Market analysis:
This round of geopolitical conflict caused an upward breakthrough, but the price has cooled down due to the negotiations between China and the United States. The current market is swaying at 3374. In fact, gold has not yet taken a more obvious direction. After all, tomorrow, Friday, is a key node in the data market game. At the 4H level, today's European session has reached the 3404 line, and encountered resistance and pressure here. The current retracement is in line with our expectations, and we expect to go long. As long as the key position of the middle track is maintained, it will continue to rise after being pulled down. At present, I still hold long orders.
🏅 Trading strategies:
BUY 3390-3385-3375
TP 3400-3410
If you agree with this view, or have a better idea, please leave a message in the comment area. I look forward to hearing different voices.
TVC:GOLD FXOPEN:XAUUSD FOREXCOM:XAUUSD FX:XAUUSD OANDA:XAUUSD
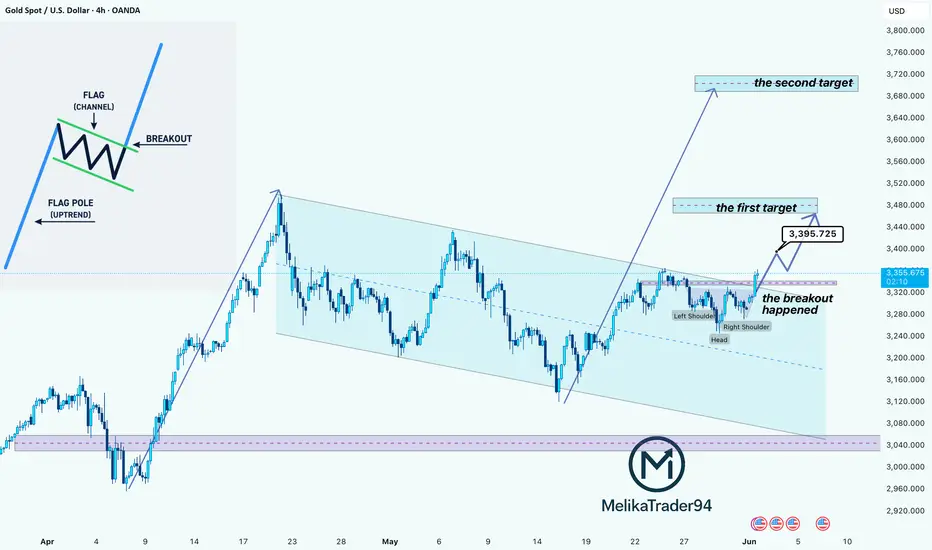
Gold Breaks Out of Bullish Flag >> Eyes on $3,480 and $3,720Alright, so looking at this 4-hour chart of Gold, there's a really clean bullish flag pattern that’s just broken out, which is a strong continuation signal.
You can see that after that big push upward, the price consolidated inside a downward (sloping channel for a few weeks. That’s pretty classic behavior. a strong move followed by a period of rest where the market cools off a bit, but without giving up too much ground. That’s what forms the "flag."
Now, the exciting part is that we’ve just broken out of that channel to the upside, and it’s not just a breakout for the sake of it, it’s supported by an inverse head and shoulders right at the top of the channel. That’s a double confirmation that buyers are stepping in with conviction.
The chart also marks two potential targets:
The first target is around $3,480, which is a reasonable measured move based on the height of the flag.
The second target is around $3,720, which would be a more extended continuation if the momentum kicks in.
As long as the price holds above the breakout area (around $3,320–$3,340), this setup looks solid. If we pull back and retest that area and hold, that might be a great long entry with those two targets in mind.
If price drops back into the channel, though, that could mean the breakout was a fakeout, so that level is key.
Gold Holds Above Key Support – Eyes Still on 3400 (READ CAPTION)By examining the gold chart on the 4-hour timeframe, we can see that the price successfully hit the $3367 target exactly as expected, and then corrected back to $3346. Currently, gold is trading around $3358, and if it can hold above $3350, we can expect further upside. Based on the previous analysis, the next bullish targets remain at $3367, $3380, $3391, and $3400. (Maximum support is always appreciated, my friends!)
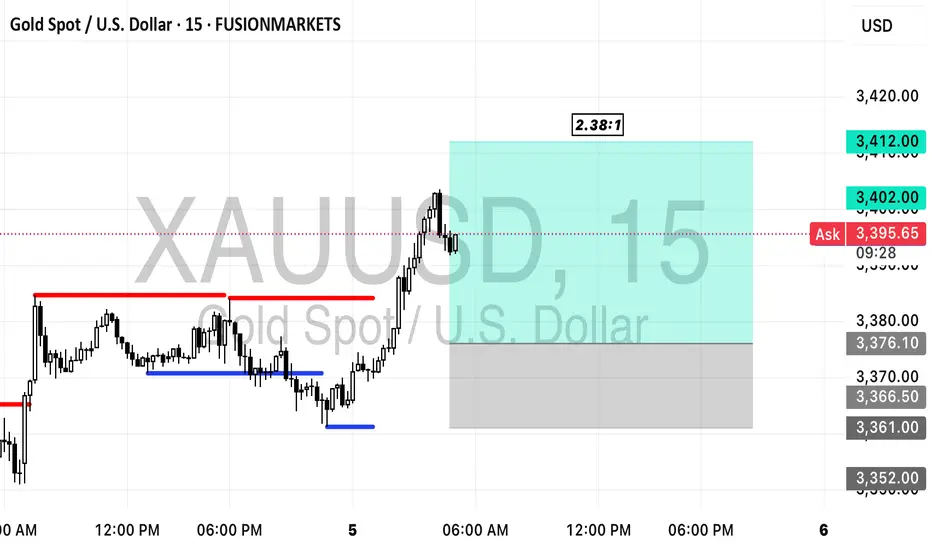
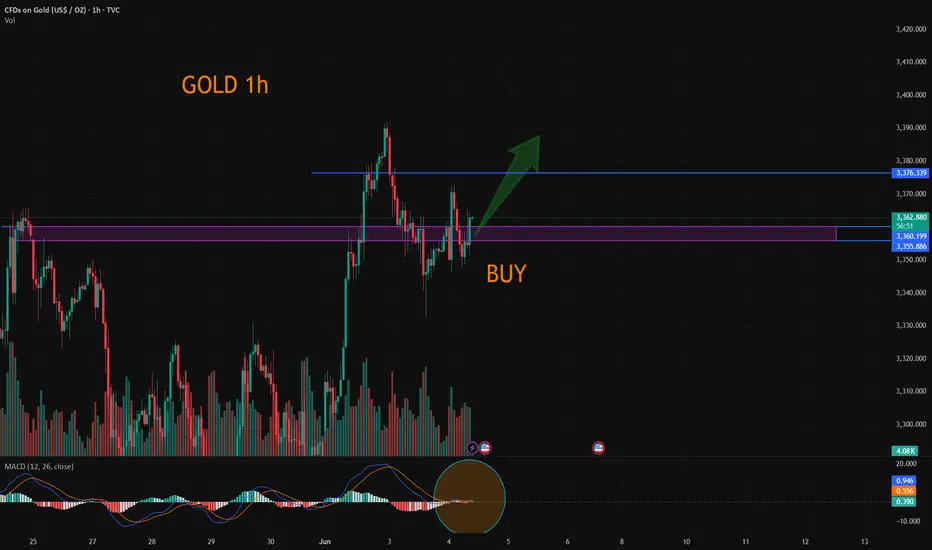
Trade Idea: XAUUSD Long (BUY LIMIT)Entry Type: Buy Limit
Timeframe Alignment: H4 bullish continuation → M15 demand zone retest → M3 structure forming base at support
Session Timing: Aligned with London–New York overlap (between 4:30 AM and 6:30 AM PST)
⸻
🔹 Trade Setup
• Entry: 3376.10 (Buy Limit)
• Stop Loss: 3361.00
• Take Profit: 3412.00
⸻
🔹 Trade Logic
• Price is pulling back into a clear M15 demand zone around 3376, which aligns with prior consolidation and breakout zone.
• Trend remains bullish on the H4 and M15 with higher lows and sustained closes above the 50 EMA.
• 3376 area also marks a low-volume imbalance fill on lower timeframes (M3), suggesting institutions may defend this level.
• TP is just below prior H4 swing highs (~3415)
⸻
🚫 Invalidation Window
• cancel the trade entirely if not activated by 6:30 AM PST to maintain session alignment and volatility edge.
FUSIONMARKETS:XAUUSD
XAU/USD(20250605) Today's AnalysisMarket news:
U.S. economic data-① ADP employment increased by 37,000 in May, far below the expected 110,000 and the previous value of 62,000. ② The U.S. ISM non-manufacturing index in May fell to 49.9, shrinking for the first time in nearly a year, and the expected increase was from 51.6 to 52.
Technical analysis:
Today's buying and selling boundaries:
3366
Support and resistance levels:
3407
3392
3382
3351
3341
3326
Trading strategy:
If the price breaks through 3382, consider buying in, and the first target price is 3392
If the price breaks through 3366, consider selling in, and the first target price is 3351
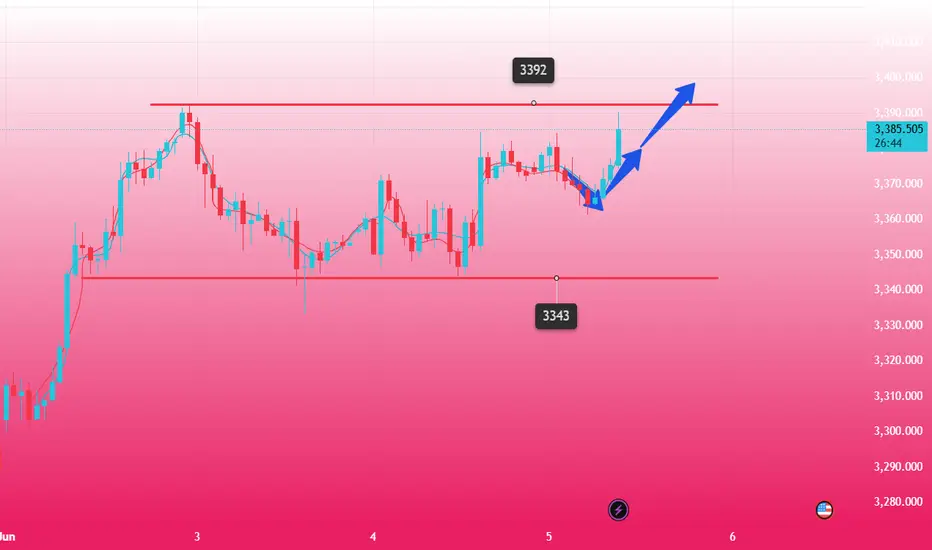
Gold------Buy near 3360-3380, target 3390-3400Gold market analysis:
Recently, the daily gold trading has begun to be a game. Today's idea is to continue buying and looking for buying opportunities. At present, it is an obvious shock rise, not a direct one-sided one. Don't rush to enter the warehouse. Yesterday, the daily line closed positive, and the short-term 3392 was suppressed. The daily moving average began to diverge. There is not much time for high-level shocks. The shock is mainly because this week is a data week. The market has too many uncertainties about the future. For example, yesterday's ADP employment data is like this. There is a more heavy NFP later. I estimate that the shock market will continue before the non-agricultural data. Today, we focus on the opportunity of shock retracement and continue to buy.
The analysis chart shows that the hourly shock range is 3392-3342. Yesterday's daily closing raised the shock platform. Today, we focus on the support of two shock platforms. One is around 3363, which is an hourly shock, and the other is 3354. This position is the moving average and pattern support. These two supports in the Asian session are both buying opportunities. In addition, if it breaks 3392, it may stand on 3400 and start a new bullish pull.
Support 3363, 3354, strong support 3343, suppression 3385, strong pressure 3392, the market strength and weakness watershed 3363.
Fundamental analysis:
The US ADP employment data released this time showed a significant reduction in employment, supporting gold to suppress the US dollar, and also giving the US market a new expectation for non-agricultural.
Operation suggestion:
Gold------Buy near 3360-3380, target 3390-3400
Bull market returns? Aiming at 3400?📰 Impact of news:
1. New uncertainty in Russia-Ukraine negotiations
📈 Market analysis:
The current trend of gold prices is erratic and discontinuous, and only swing trading can be adopted during the day. In the short term, there is a certain pressure at 3385-3395 above. If this resistance area is broken, the gold price is expected to continue to rise. The short-term support below FOREXCOM:XAUUSD is at 3350-3340. At present, the news has a greater impact on the gold price, coupled with the support of market risk aversion, so in the short term, attention should be paid to the break of the upper resistance.
🏅 Trading strategies:
BUY 3370-3365
TP 3385-3395-3400
SELL 3395-3400
TP 3380-3370
BUY 3350-3340
TP 3370-3380
If you agree with this view, or have a better idea, please leave a message in the comment area. I look forward to hearing different voices.
OANDA:XAUUSD FX:XAUUSD FXOPEN:XAUUSD TVC:GOLD
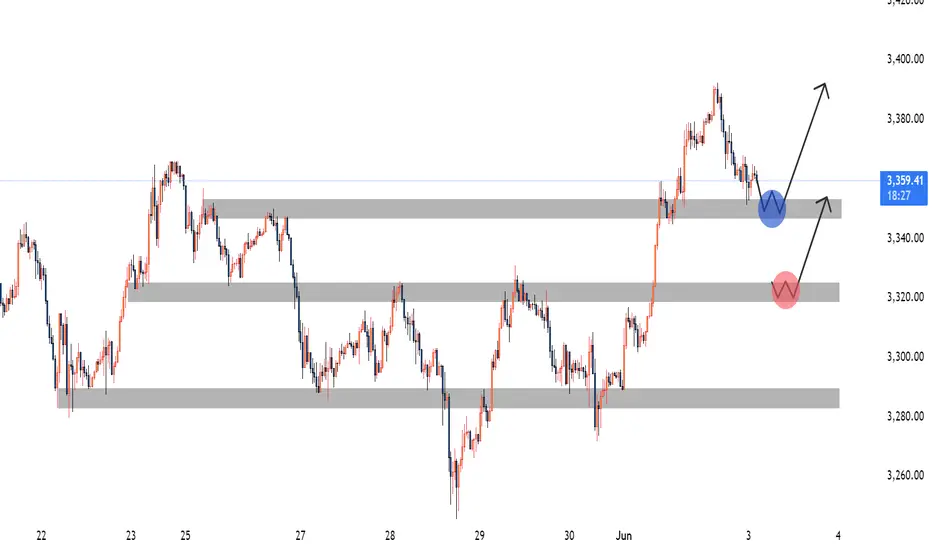
Gold XAUUSD Possible Move 6th May 2025I'm watching two key demand zones today for potential buy opportunities:
📍 Zone 1: 3348–3352 (Blue Zone)
Reasoning: This area aligns with a previous demand zone that has already shown strong bullish reaction. Price is currently retracing into this area.
Signal to Enter: Look for:
A liquidity sweep below the zone (e.g., a quick wick down grabbing stop-losses).
Followed by a bullish engulfing candle or a break of minor structure to the upside on lower timeframes (e.g., M1–M5).
Expectation: If confirmed, this could trigger the next leg up toward the recent highs (approx. 3385+).
📍 Zone 2: 3320–3325 (Red Zone)
Reasoning: A deeper zone of interest where price last consolidated before a strong rally. Ideal for deeper pullback entries if the first zone fails.
Signal to Enter:
Look for a retest and bullish rejection with strong wick rejections or a CHoCH (Change of Character) on LTF.
A clean break of minor bearish structure can serve as confirmation.
Expectation: If this level holds, a bounce back toward the mid/high 3300s is likely.
✅ Trade Setup Summary:
Buy Zone 1: 3348–3352
Signal: Liquidity grab + Bullish engulfing / BOS (low timeframes)
Target: 3365–3375-85
Invalidation: Clean break and close below 3345
Buy Zone 2: 3320–3325
Signal: Rejection wicks + CHoCH or FVG entry
Target: 3335–3355-3375
Invalidation: Break below 3315
Gold price fluctuates before NFP data, be careful📰 Impact of news:
1. European Central Bank deposit facility rate in the eurozone as of June 5
2. Initial jobless claims data
3. Non-farm payroll data
4. Worsening geopolitical situation
📈 Market analysis:
Since the release of ADP data last night, gold prices have been rising all the way, reaching a high of around 3382, which is in line with the expected resistance of 3385-3395 we saw yesterday. Currently, the bulls are stable above 3330, and the gold price is still in a bullish trend on the daily chart. Although the current market is in a state of consolidation, there is a possibility of a surge and fall in the short term. Only after a negative line correction occurs, it may continue to be bullish. In short-term trading, pay attention to 3385-3395 on the top and the opportunity to retreat to 3365-3355 on the bottom. Pay attention to data such as initial jobless claims and tomorrow's non-agricultural data.
🏅 Trading strategies:
BUY 3365-3355-3345
TP 3370-3380-3400
If you agree with this view, or have a better idea, please leave a message in the comment area. I look forward to hearing different voices.
TVC:GOLD FXOPEN:XAUUSD FOREXCOM:XAUUSD FX:XAUUSD OANDA:XAUUSD

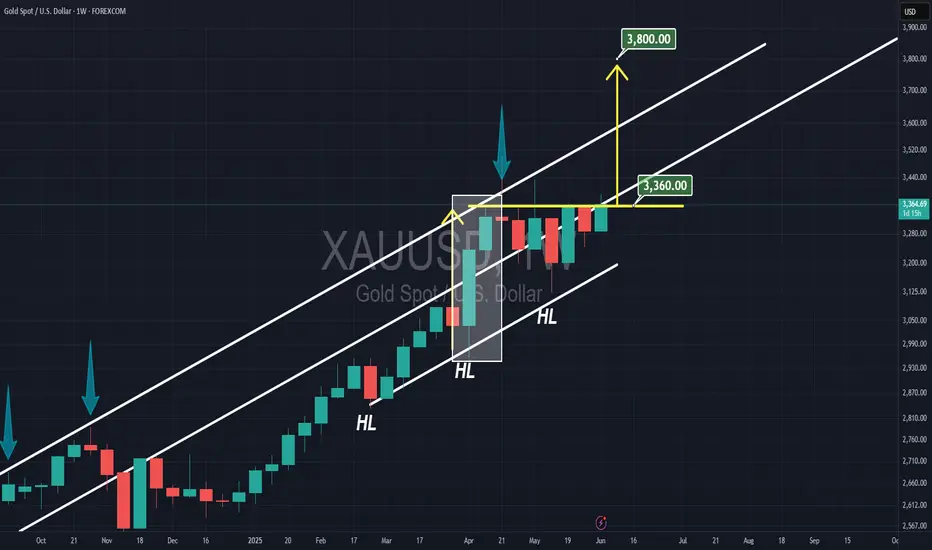
Gold can make new ATH...(05JUNE2025)As Gold had 2 weeks rally in early April, now is consolidating below the 33360 resistance on weekly timeframe for 7 weeks. I believe this important resistance eventually get broken and we see new all time highs for Gold.
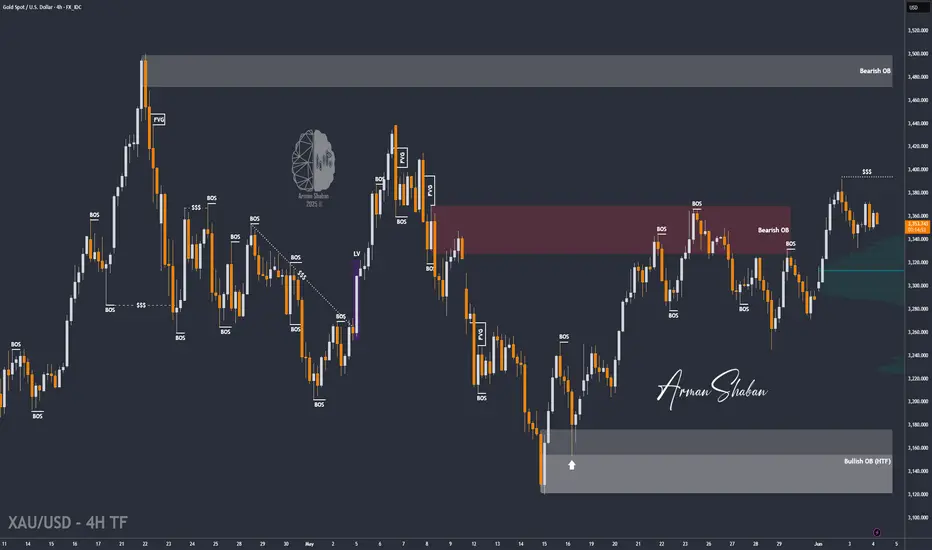
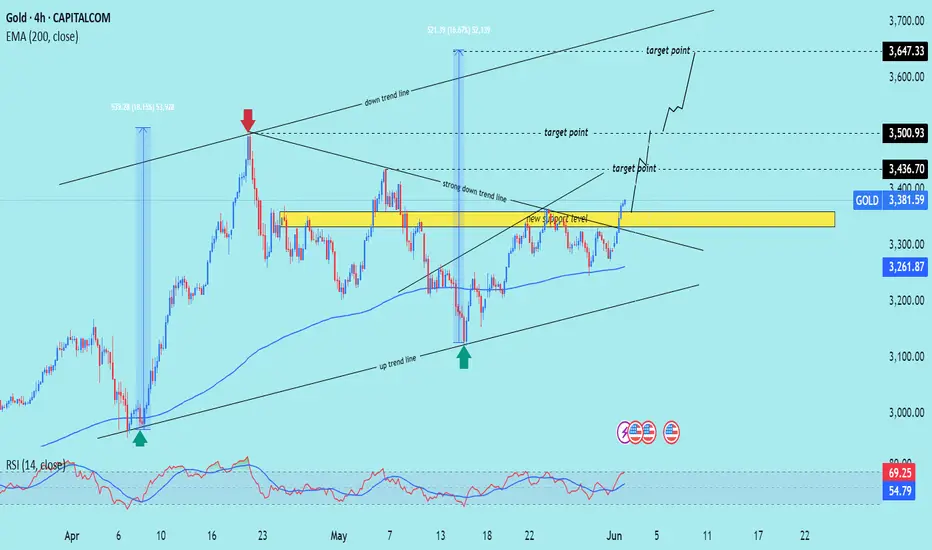
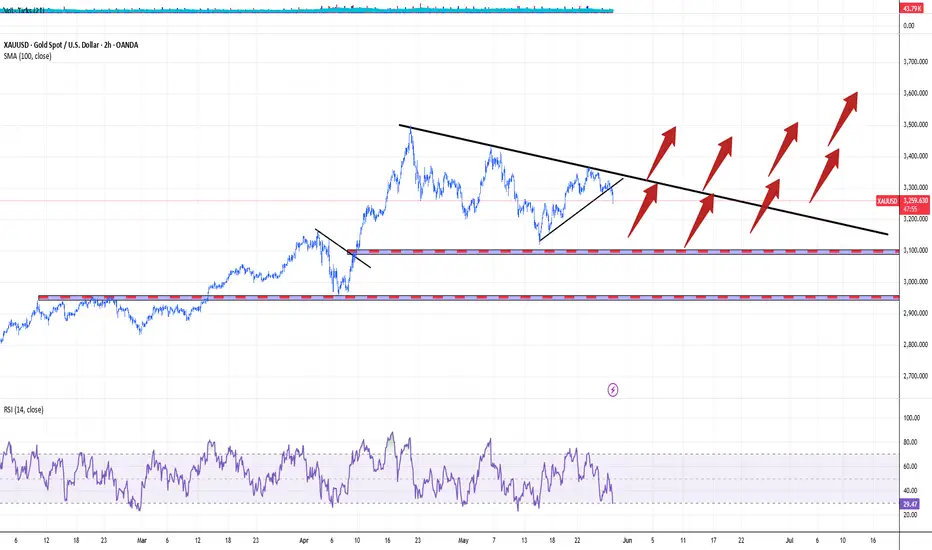
XAU/USD) Breakout strong bullish trend Read The captionSMC Trading point update
Technical analysis chart of gold (XAUUSD) on the 4-hour timeframe. Here’s a breakdown of the key ideas presented in the chart:
---
Key Support/Resistance Zone
A yellow rectangular zone marks a significant support/resistance level.
This level was previously a resistance and has now been flipped into support ("new support level").
---
Trend Analysis
Uptrend line (lower diagonal line): Shows support and higher lows forming a bullish structure.
Downtrend lines (upper diagonals): Show past resistance levels being tested.
Strong downtrend line has now been broken, which is bullish.
---
Target Points
Three bullish targets are marked:
1. $3,436.70
2. $3,500.93
3. $3,647.33
These targets seem to be based on:
Breakout above the resistance zone.
Measured move projections from previous impulsive rallies.
---
Technical Indicators
200 EMA (Exponential Moving Average): Currently at $3,261.87, acting as dynamic support.
RSI (Relative Strength Index):
Current RSI is 54.80, indicating neutral momentum.
Previously touched overbought zone (~69), indicating strong recent bullish momentum.
---
Arrows
Green arrows mark strong bullish bounce points.
Red arrow marks a rejection from the downtrend line (previous resistance).
Mr SMC Trading point
---
Conclusion (Idea Summary)
Price has broken out of consolidation and downtrend resistance.
If the price holds above the yellow support zone and 200 EMA, a bullish continuation is likely.
Targets: $3,436 → $3,501 → $3,647.
Confirmation of breakout and momentum depends on volume and RSI behavior in coming candles.
---
pelas support boost 🚀 analysis follow)
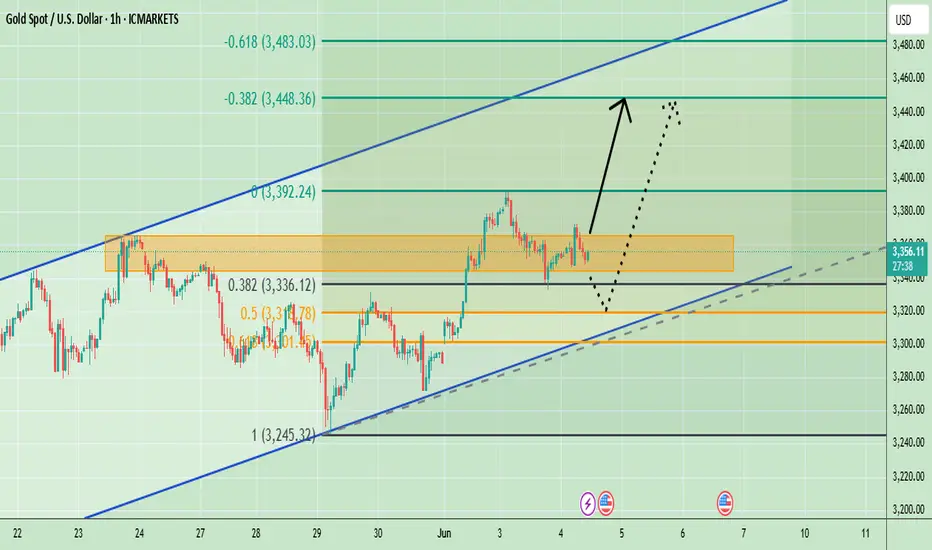
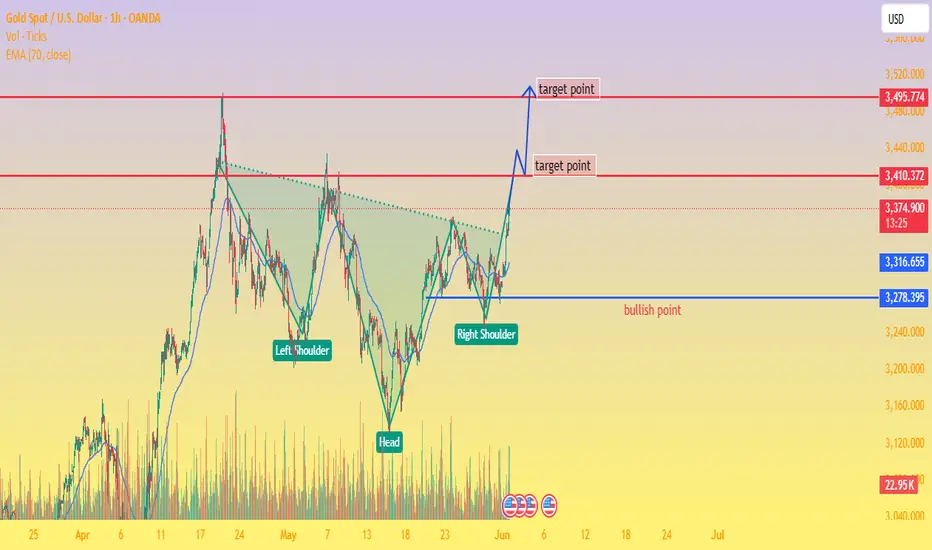
Gold's Bullish Comeback Inverted Head & Shoulders Pattern📊 Chart Analysis
This is a 1-hour chart of XAU/USD (Gold Spot vs. USD) showing a classic Inverted Head and Shoulders pattern — a bullish reversal formation.
🔍 Pattern Breakdown:
Left Shoulder: Formed in early May.
Head: Deep dip mid-May.
Right Shoulder: Developed in late May.
Neckline Breakout: Price has broken above the neckline with strong bullish momentum.
📈 Key Levels:
🔵 Bullish Confirmation: 3,278.395 (breakout level, neckline)
🔼 First Target: 3,410.372 🔴
🎯 Final Target: 3,495.774 🚀
📉 EMA 70 (3,316.651) is acting as dynamic support, aligning with the bullish scenario.
🧠 Interpretation:
As long as price stays above the bullish zone (3,278), the bias remains strongly bullish.
Traders might consider entering on pullbacks or breakouts with stops below the right shoulder or neckline.
📌 Summary:
✨ Bullish Reversal Unfolding
💹 Breakout confirmed
🎯 Targeting higher highs
XAUUSD BULLISH SETUP. GOLD GOES 'PREPARING FOR SUMMER'Gold spot prices have experienced significant volatility and notable technical developments over the past several months. Since the start of 2025, gold surged by over 25%, reaching an all-time high of $3,500 per troy ounce in April before retracing to hover near $3,300 by late May.
This rally was fueled by persistent geopolitical tensions, particularly in the Middle East, and a weaker US dollar, which made gold more attractive to international buyers.
Technically, gold entered a parabolic upswing earlier in the year, becoming extremely overbought before breaking below its parabolic trend, signaling a potential top and the start of a corrective phase.
The Relative Strength Index (RSI) has recently dropped below 52, its lowest since February, reflecting weakening bullish momentum. The Average Directional Index (ADX) near 15 also indicates a lack of strong trend direction.
Key support levels are identified at $3,196 (55-day SMA), $3,120 (May low), and $3,031 (100-day SMA), while resistance sits at $3,350.
We are looking forward to further Gold accumulation, ahead of scorching hot summer months.
--
Best wishes,
@PandorraResearch Team 😎
XAU/USD(20250604) Today's AnalysisMarket news:
Fed Logan: We should focus on achieving the 2% inflation target, rather than trying to make up for past inflation shortfalls; Bostic: We still think there may be a rate cut this year.
Technical analysis:
Today's buying and selling boundaries:
3359
Support and resistance levels
3417
3395
3381
3337
3322
3301
Trading strategy:
If the price breaks through 3359, consider buying, the first target price is 3381
If the price breaks through 3337, consider selling, the first target price is 3322
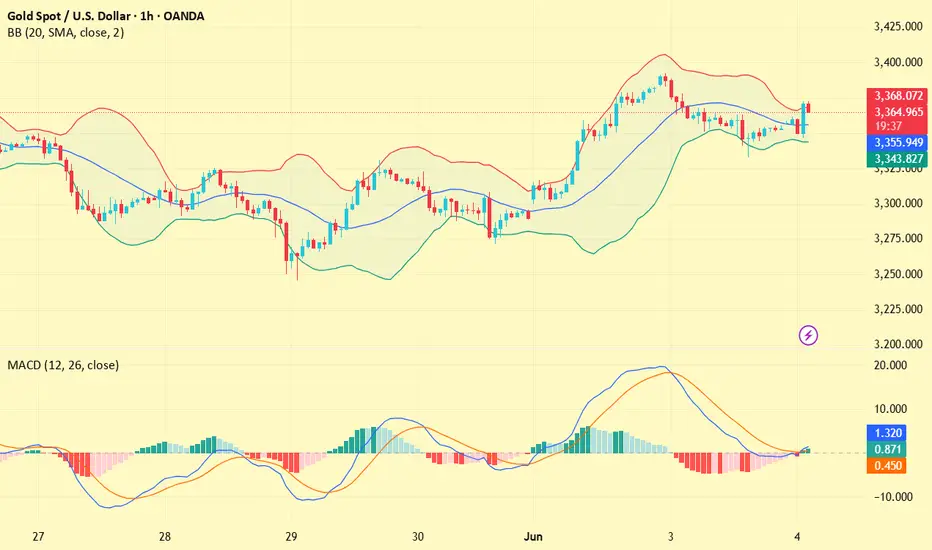
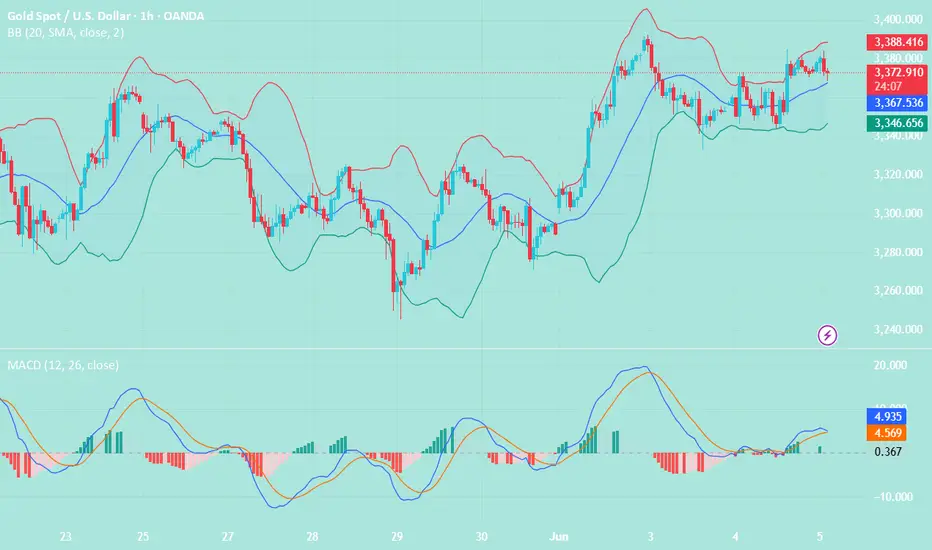
Gold should beware of unexpected employment data explosion!Market New s
On Wednesday (June 4) in the Asian market, spot gold fluctuated slightly and is currently trading around $3,346 per ounce. The international gold price fell 0.83% on Tuesday, after hitting a high of $3,392 since May 8. The price decline was mainly suppressed by the rebound of the US dollar exchange rate. At the same time, the tense international trade situation, the weakness of the US labor market and the cautious attitude of the Federal Reserve have cast a fog of uncertainty over the gold market.However, the market remains vigilant about the global situation. The continued expansion of the US fiscal deficit, the escalation of trade tensions between Asian powers and the United States, and the failure of the second round of peace talks between Ukraine and Russia have led to market risk aversion still supporting London gold prices. The Fed's wait-and-see attitude and cautious assessment of inflation expectations have further increased market uncertainty. Pay close attention to Friday's non-farm payrolls data and the Fed's policy guidance to determine the next wave of gold price movements. In addition, this trading day pays attention to the US ADP employment data in May and the US ISM non-manufacturing PMI data in May, as well as news related to the international trade situation. News related to the geopolitical situation also needs to be paid attention to.
Technical Review
Gold rose strongly overnight because Ukraine directly blew up 41 Russian fighter jets. Today, the expected rhythm was completed and the bottom rebounded. In the four-hour chart, the hourly chart price still maintains the upper track of the Bollinger Band channel, and the daily chart MA10-day moving average 3326 and the 5-day moving average 3340 are running above. In the wide range of market fluctuations, short-term participation is the main. Intraday callbacks are still mainly low-price buying. In terms of the moving average system, the short-term moving average diverges upward, providing certain support for the price, but the deviation rate from the long-term moving average has a trend of shrinking, so beware of price corrections. At the 4-hour level, the 5-day moving average crosses the 10-day moving average to run. If the hourly price can effectively break through the upper edge of the recent fluctuation range of 3400, it is expected to usher in a wave of rising prices in the short term; on the contrary, if it falls below the lower edge of 3300, it may further explore.
Today’s analysis
Gold rebounded in the Asian session and then rushed up directly, and the center of gravity of the rebound low point is also constantly moving up. At present, from the one-hour market, the short-term gold price has stabilized above the top and bottom conversion position of 3340, and it also remains above the upward trend line. Buying is strong. For the future trend, we still have a buying mindset!
Gold price rebounded to the lowest level of 3346 in the Asian session, and the buying energy is relatively strong, but I still suggest that you don’t chase orders. There is no good thing in the Asian session. Chasing the rise is easy to be trapped at a high point. We only need to pay attention to two points in the Asian session, which are the key position of 3330 and the short-term support level of 3346. If there is a rebound to 3350 during the session, start ambush buying!
Operation ideas:
Short-term gold 3350-3360 long, stop loss 3330, target 3370-3400;
Short-term gold 3370-3380 short, stop loss 3350, target 3340-3320;
Key points:
First support level: 3338, second support level: 3326, third support level: 3303
First resistance level: 3370, second resistance level: 3386, third resistance level: 3396

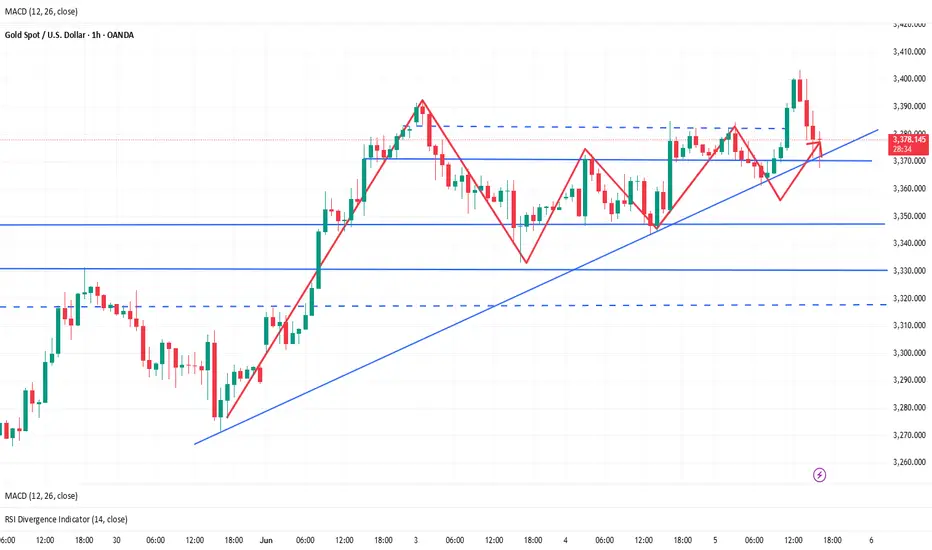
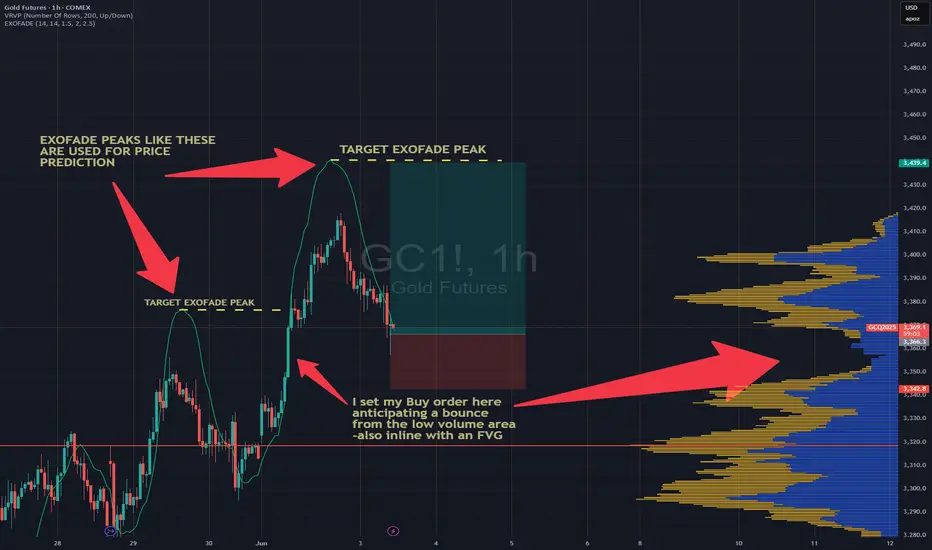
Gold Pullback Entry Opportunity Gold resumed its rally, sparked by recent tarrif news. Price is pulling back at the moment and has entered an sweet spot where we can confidently take our first low risk Buy.
BUYING HERE BECAUSE
1. We're entering into a low volume area, which is also in line with an FVG on the 1hr chart
2. When a new uptrend starts, i like to buy first 2 instances price pullback to bounce from my trend cloud indicator We didn't get a perfect bounce as it has broken below it, but i'am still buying regardless due to my first reason above about the low volume gap.
PROFIT TARGET
Setting my profit target to my trusted Exofade peak. As long as the uptrend continues, Exofade peaks will ALWAYS get taken out. That why i love this indicator, and its free. It's my gift to y'all :) . Just search for it in trading view indicators.
XAUUSD:Go long
Gold in yesterday bottom pick up, back to hit a low after pumping, and then stabilize and pull up, the daily line is a single negative back to step, corrected gold continues to be bullish, short - term back to step support to see 3355-3360
Trading Strategy:
BUY@3355-60
TP:3375-80
↓↓↓ More detailed strategies and trading will be notified here ↗↗↗
↓↓↓ Keep updated, come to "get" ↗↗↗
Market situation unclear? Check out this analysis📰 Impact of news:
1. ADP data is significantly positive
2. Trump: "Mr. Too Late" Fed Chairman Powell must cut interest rates now
📈 Market analysis:
The ADP data is significantly bullish, but we cannot rule out that this is an illusion created by the market, because although the daily line has formed a golden cross, it has not fully released the bullish momentum, and has not been able to exert force in the bullish upward trend. Therefore, I prefer to go long at a low position in the US market rather than chasing it immediately. At the same time, the upper 3365 may become a short-term strong pressure level. If the gold price encounters resistance here, the US market will usher in a retracement, and then it will be our time to go long.
🏅 Trading strategies:
SELL 3360-3365
TP 3340-3330
BUY 3330-3317
TP 3360-3370-3400
If you agree with this view, or have a better idea, please leave a message in the comment area. I look forward to hearing different voices.
TVC:GOLD FXOPEN:XAUUSD FOREXCOM:XAUUSD FX:XAUUSD OANDA:XAUUSD
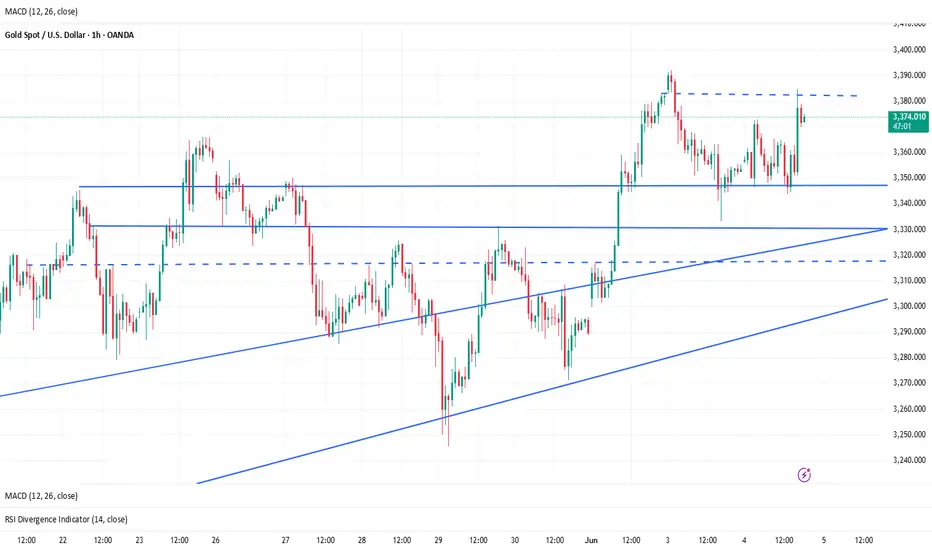
If the direction is unclear, don’t panic, respond flexibly!Gold has been showing a daily yin-yang alternating pattern since last Wednesday, but the overall rising rhythm has not been broken. The MA5-day moving average and the MA10-day moving average formed a golden cross and continued to extend upward. The arrangement of this moving average system provides a certain support momentum for the gold price. During the day, we need to focus on the support effect of the moving average. The current 5-day moving average is near 3340, and the 10-day moving average is near 3325. These two positions constitute an important support area for the short-term gold price correction. In terms of upper resistance, first pay attention to yesterday's high of 3392. If the gold price can break through this resistance level, it means that the upward momentum is strong, and it is expected to continue to be strong to 3400-3420, further opening up the upward space.
From the 4-hour chart, as long as the short-term gold market is above 3330, then gold is still in a strong bullish trend. On the contrary, if it falls below the closing line near 3330, then it is a broken trend line, and the subsequent market is likely to form a weak shock pattern again, so the current operation is actually very simple. As long as the 3330 position is not broken, you can rely on 3330 to enter the market and do more. Focus on the support near yesterday's low of 3333 below, and focus on the resistance near 3375-3380 above.
Gold operation suggestions: It is recommended to short gold near 3365-3375, with a target of 3350. Go long gold when it falls back to 3335-3345, with a target of 3360-3370.

Types of Engulfing Candles!In trading, an Engulfing candle (or Engulfing pattern) is a two-candle reversal pattern that can indicate a potential change in market direction. It is commonly used in technical analysis in both bullish and bearish contexts.
Types of Engulfing Candles
1. Bullish Engulfing Pattern:
Occurs during a downtrend.
The first candle is bearish (red or black), showing continued selling pressure.
The second candle is bullish (green or white) and completely engulfs the body of the first candle (its open is lower and close is higher).
This pattern signals a potential reversal to the upside.
2. Bearish Engulfing Pattern:
Occurs during an uptrend.
The first candle is bullish.
The second candle is bearish and completely engulfs the first candle's body (its open is higher and close is lower).
This pattern signals a potential reversal to the downside.
Key Characteristics
The second candle’s body must fully engulf the first candle’s body (wicks/tails are not necessary to engulf).
The stronger the engulfing candle (in terms of size and volume), the more significant the signal may be.
Often more reliable when confirmed with volume or used in conjunction with other technical indicators (e.g., RSI, support/resistance levels).
Example:
Bullish Engulfing Example:
Day 1: Bearish candle opens at $100 and closes at $95.
Day 2: Bullish candle opens at $94 and closes at $101 — it completely engulfs Day 1's body.
This would suggest a potential shift from sellers to buyers.

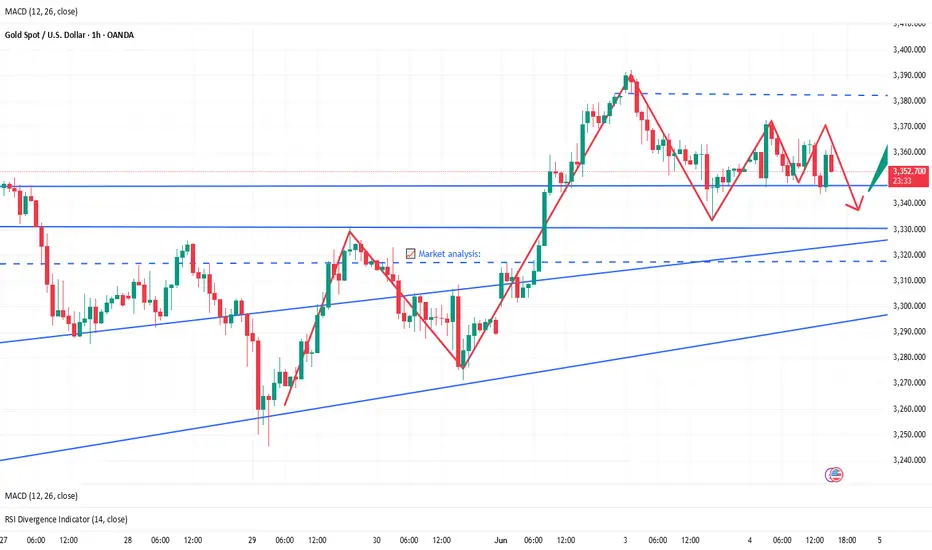
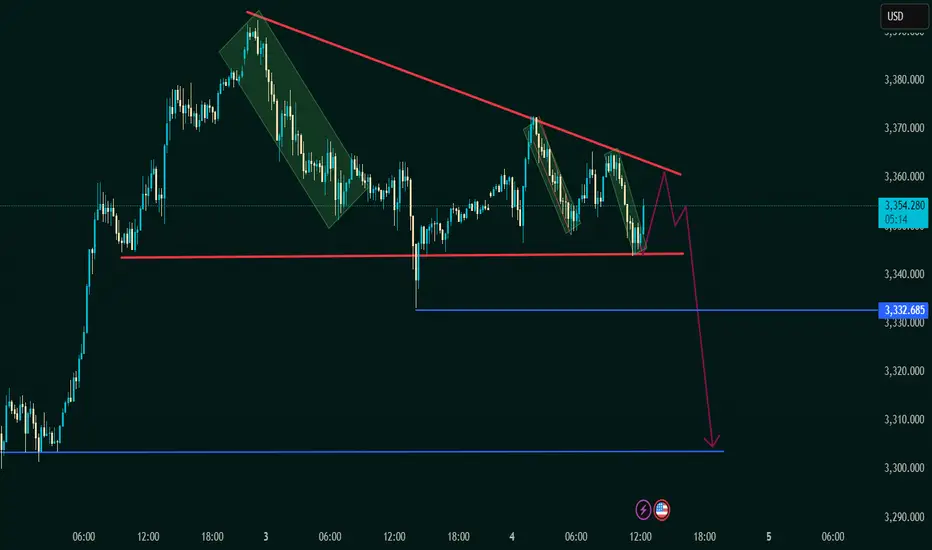
XAU/USD (Gold vs USD)📏 Trendlines:
Red descending trendline = consistent lower highs → selling pressure increases.
Horizontal red support line (~3349) = price tested multiple times, but no strong bounce.
📦 Chart Patterns:
Multiple bear flag formations marked in green = typical continuation patterns in downtrends.
Suggests repeated attempts to rally are being sold into.
🟣 Support & Resistance:
Immediate resistance: Downtrend line (~3355–3360).
Key support level: 3349 (horizontal red line).
Breakdown target: 3332.685 (blue horizontal line) and further to ~3310 zone.
🧭 Price Projection:
🚨 Expect a potential pullback to the trendline (~3355), which may reject again.
📉 If 3349 support breaks, a strong drop to 3332 is likely.
Final bearish target: ~3310 level, aligning with the magenta arrow.
📌 Conclusion:
⚠️ Bias: Bearish under 3355.
🧨 Watch for breakdown confirmation below 3349 to trigger short positions.
🕵️♂️ Be cautious of false breakouts; wait for candle close confirmation.
XAU/USD Consolidating Near $3,350 – Watch for Break Above $3,365Gold is currently trading around $3,350, showing signs of consolidation after recent gains. Technical indicators suggest a cautious approach, with key resistance at $3,365 and support at $3,345. Market sentiment remains bullish due to ongoing geopolitical tensions and economic uncertainties. Traders should monitor these levels closely and manage risk appropriately.
📊 Key Levels
Resistance: $3,365, $3,400, $3,450
Support: $3,345, $3,300, $3,285
📈 Trading Strategy
🔸 Bullish Scenario:
Breakout Above $3,365 : Could target $3,400 and potentially $3,450
Support Holding Above $3,345 : May lead to a retest of $3,400
🔸 Bearish Scenario:
Failure to Hold Above $3,345 : May lead to a retest of $3,300 or lower
Break Below $3,300 : Could extend the correction towards $3,285
Note
Please risk management in trading is a Key so use your money accordingly. If you like the idea then please like and boost. Thank you and Good Luck!