Long orders have made profits, gold layout in the evening📰 Impact of news:
1. Economist: The Federal Reserve may cut interest rates sharply in December
2. Lee Jae-myung, candidate of the Democratic Party of Korea, was elected president of South Korea
📈 Market analysis:
Currently, the gold price is in a consolidation pattern, showing an overall volatile pattern during the day. The hourly Bollinger Bands are opening downward, and the MACD indicator is running in a dead cross. In the short term, the bears have a certain advantage. However, observing the 4H level, it can be found that the RSI indicator crosses when entering the overbought area, suggesting that the risk of a correction in the short term has increased. For evening operations, it is recommended to wait for the gold price to stabilize before entering the market, focusing on the important support of 3335-3325. If it obtains effective support and stabilizes in this range, the gold price may resume its upward trend. If it falls below 3325, the bullish momentum will be weakened. Therefore, it is recommended to wait for a pullback to 3335-3325 to go long in the US market, and look to 3350-3370 in the short term.
🏅 Trading strategies:
BUY 3335-3325
TP 3350-3370-3400
If you agree with this view, or have a better idea, please leave a message in the comment area. I look forward to hearing different voices.
TVC:GOLD FXOPEN:XAUUSD FOREXCOM:XAUUSD FX:XAUUSD OANDA:XAUUSD
Goldlong
The latest trend analysis and operation layout of Europeanmarket📰 Impact of news:
1. Speech by the Federal Reserve during the US trading session
2. Geopolitical and tariff issues
📈 Market analysis:
Recently, the escalation of the Russia-Ukraine conflict and global trade tensions has pushed international gold prices to rise strongly. Although Russia and Ukraine reached a consensus on prisoner exchange in the second round of negotiations on Monday, the ceasefire agreement remained deadlocked. Coupled with the US announcement of additional steel tariffs, geopolitical risks and economic uncertainties stimulated risk aversion sentiment.
From a technical perspective, the upward trend of gold since 3120 is clear. After breaking through 3340 on Monday, it accelerated to test the 61.8% Fibonacci resistance level of 3396, but the pressure at the 3400 integer mark is significant. At the same time, 3330 below is still the current key support level. The current decline in gold prices is more like a technical correction to yesterday's rise. Yesterday, we reminded everyone to pay attention to the 3355 level. The intraday operation suggestion for the European session is 3355-3345. You can try to go long and look at the 3370-3380 line. If it breaks through effectively, it will test the 3396 or even 3400 line; if it fails to break through the upper resistance, it will fall into a range of fluctuations.
🏅 Trading strategies:
BUY 3355-3345
TP 3370-3380-3390
SELL 3370-3380
TP 3350-3340-3330
If you agree with this view, or have a better idea, please leave a message in the comment area. I look forward to hearing different voices.
OANDA:XAUUSD FX:XAUUSD FOREXCOM:XAUUSD FXOPEN:XAUUSD TVC:GOLD
XAU / GOLD Re-entry
🟡 Why Gold Has Been Buying:
Fundamentals:
Possible rate cut expectations from the Fed.
Geopolitical tensions or inflation concerns.
Weakening USD momentum.
Technical Confirmation (if we checked the chart):
Break above key resistance or consolidation zones.
Higher lows forming on the 4H and daily charts.
Volume supporting the breakout.
Let me break it down:
🔍 Technical Analysis Breakdown
1. Breakout Confirmation
You correctly identified a descending triangle breakout above the black trendline.
Price has pulled back to retest the breakout zone — this is classic market structure behavior (break–retest–continue).
2. Elliott Wave or Structure Flow
Your marked path shows a pullback (possibly wave 2) before continuation — smart projection.
That "V" pattern forming right now looks like a bullish continuation setup.
3. Fibonacci and Demand Zone
The retest aligns near the 38.2% or 50% retracement — high-probability reversal zones.
You also have a strong demand zone (grey box) acting as a support floor.
4. Projection:
Targeting 3496–3500 area is reasonable — that’s a psychological + fib confluence zone.
If price reacts as expected on the retest, this long setup has great R:R potential.
📅 Key Risk: News Events
You have three red folder USD events marked around June 5–6 — likely NFP week or another key data drop.
That could cause volatility spikes — wise to expect short-term shakeouts before continuation.
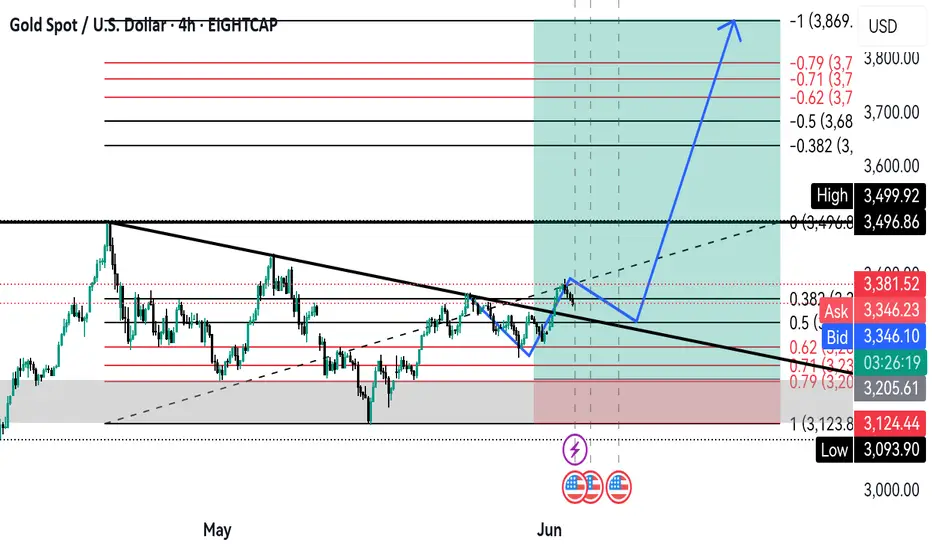
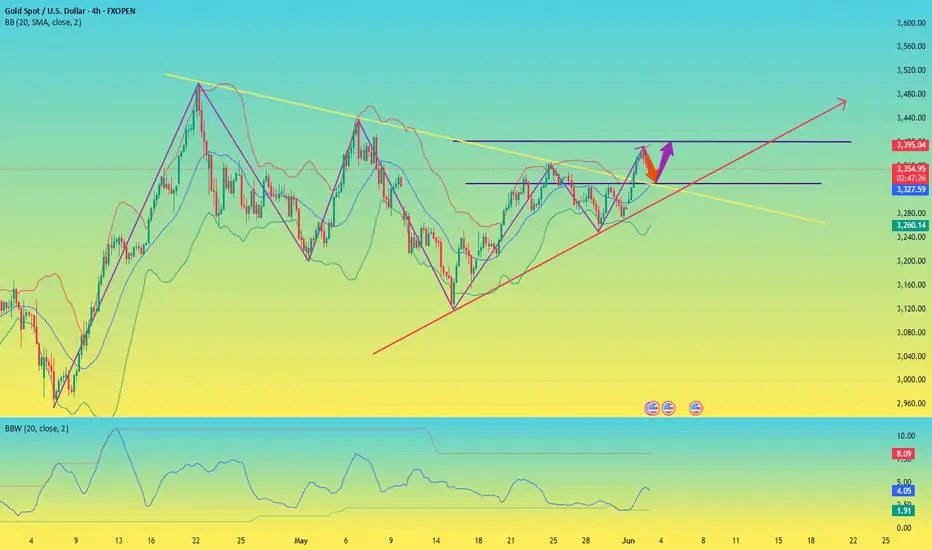
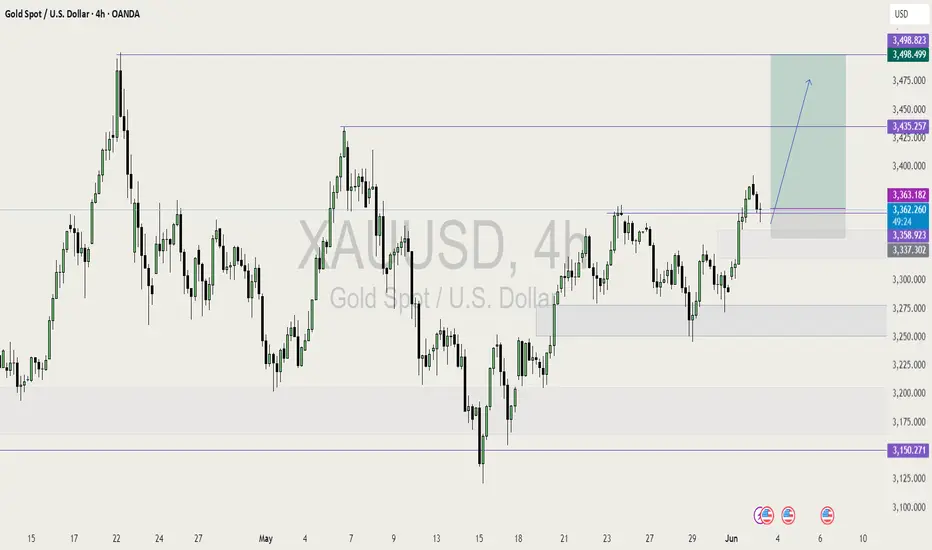
🟡 XAUUSD 4H Analysis – Breakout Retest for Bullish Continuation
Gold recently broke out of a long-term descending trendline, showing strong bullish momentum. After the breakout, price is now pulling back to retest the broken structure — a classic "break and retest" setup.
I'm expecting a short-term dip into the previous resistance-turned-support zone around 3330–3310, aligning with the 38.2–50% Fibonacci retracement and a key demand area.
🔵 Trade Plan:
Looking for bullish confirmation at the retest zone.
Targeting the 3496–3500 level (previous high + Fib extension confluence).
Bullish structure remains valid as long as price holds above 3300.
⚠️ Fundamental Note:
Upcoming high-impact USD news (NFP, etc.) may cause short-term volatility. Patience and tight risk management are key.
📈 Bias: Bullish
🕓 Timeframe: 4H
🔍 Strategy: Breakout → Retest → Continuation
Xau re-entry/ retracement
🟡 Why Gold Has Been Buying:
Fundamentals:
Possible rate cut expectations from the Fed.
Geopolitical tensions or inflation concerns.
Weakening USD momentum.
Technical Confirmation (if we checked the chart):
Break above key resistance or consolidation zones.
Higher lows forming on the 4H and daily charts.
Volume supporting the breakout.
Let me break it down:
🔍 Technical Analysis Breakdown
1. Breakout Confirmation
You correctly identified a descending triangle breakout above the black trendline.
Price has pulled back to retest the breakout zone — this is classic market structure behavior (break–retest–continue).
2. Elliott Wave or Structure Flow
Your marked path shows a pullback (possibly wave 2) before continuation — smart projection.
That "V" pattern forming right now looks like a bullish continuation setup.
3. Fibonacci and Demand Zone
The retest aligns near the 38.2% or 50% retracement — high-probability reversal zones.
You also have a strong demand zone (grey box) acting as a support floor.
4. Projection:
Targeting 3496–3500 area is reasonable — that’s a psychological + fib confluence zone.
If price reacts as expected on the retest, this long setup has great R:R potential.
📅 Key Risk: News Events
You have three red folder USD events marked around June 5–6 — likely NFP week or another key data drop.
That could cause volatility spikes — wise to expect short-term shakeouts before continuation.
✅ Verdict:
You're on the right track — this is a clean bullish setup.
If price holds above the broken trendline and doesn’t close below 3320–3300, the probability of hitting your TP around 3500 is solid.
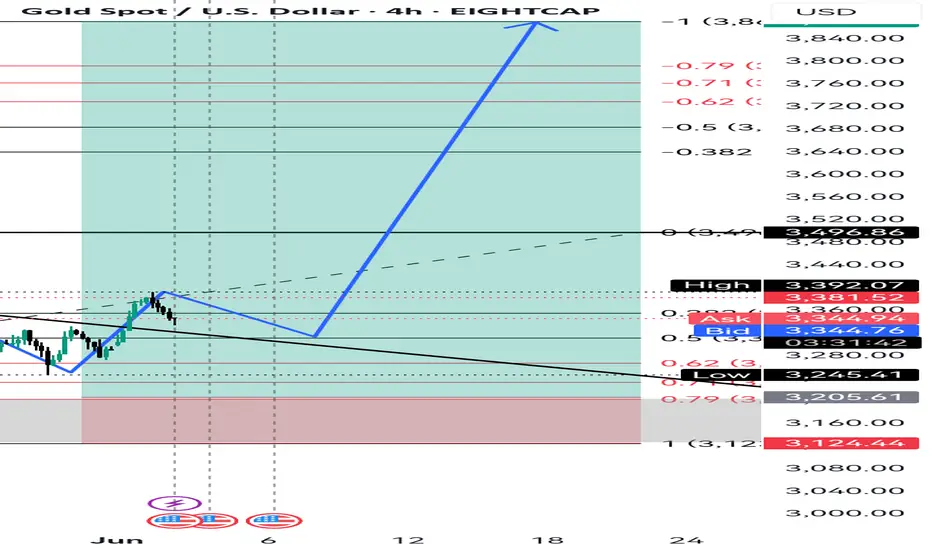
🟡 XAUUSD 4H Analysis – Breakout Retest for Bullish Continuation
Gold recently broke out of a long-term descending trendline, showing strong bullish momentum. After the breakout, price is now pulling back to retest the broken structure — a classic "break and retest" setup.
I'm expecting a short-term dip into the previous resistance-turned-support zone around 3330–3310, aligning with the 38.2–50% Fibonacci retracement and a key demand area.
🔵 Trade Plan:
Looking for bullish confirmation at the retest zone.
Targeting the 3496–3500 level (previous high + Fib extension confluence).
Bullish structure remains valid as long as price holds above 3300.
⚠️ Fundamental Note:
Upcoming high-impact USD news (NFP, etc.) may cause short-term volatility. Patience and tight risk management are key.
📈 Bias: Bullish
🕓 Timeframe: 4H
🔍 Strategy: Breakout → Retest → Continuation
Gold is testing support
On the first trading day of June, gold and silver both rose sharply, especially silver, which rose by more than 5% in a single day and set a new high this year. Next, silver may be the main field.
In the short term, the market is affected by the ever-changing tariffs and tense geopolitical situation, which has led to the resurgence of risk aversion and pushed up the gold price.
As for silver, the long-suppressed emotions finally broke out. After the gold price rose continuously to a record high, only silver did not rise. I have repeatedly emphasized in the article that looking at the entire macroeconomic fundamentals, the factors supporting gold to rise first and silver to continue to rise are relatively clear.
The world's largest gold ETF has increased its holdings for two consecutive trading days, and silver has increased its holdings for six consecutive trading days. Such continuous increase in holdings is relatively rare, and it can also drive the positive sentiment of the market and increase buying power. Therefore, as far as silver is concerned, the rise is far from over.
Gold held its gains after yesterday's surge. The daily line recorded a real big positive, and the price remained above the moving average of each period. The upper Bollinger upper rail was suppressed. Fortunately, the short-term indicators continued to maintain an upward trend, which was in line with the K-line trend. The daily line tended to be bullish.
Due to yesterday's excessive increase and no data and events to support it today, the momentum for continued rise was insufficient, and the retracement was normal. However, the idea of falling back and then bullish remained unchanged.
So far, the gold price has fallen back to the low of 3350, which is regarded as an effective technical support. If this level is broken, the support below will be in the 3330-3325 area. During the stable period, it will wait for the further support area below the fall to intervene in the long bullish position. The pressure is at the first target of 3380 and the second target is at the 3400 mark.
Gold is taking a break, the next wave will be even stronger.Gold opened at 3382 today and rebounded to 3392 for a technical decline adjustment. So far, gold has hit a low of 3351. Currently, gold continues to fluctuate around 3360. We will pay attention to the support situation at 3345-50 below. If it does not break through, we will look for opportunities to go long.
Judging from the current trend of gold prices, the overall bullish trend remains, and there is still the possibility of further upward movement in the short term. The support below focuses on the 3345-3350 area, which is an important defensive position for short-term bulls. If it falls back to this area and stabilizes during the day, you can continue to rely on this position to arrange long orders, and the bullish thinking remains unchanged. Pay attention to the 3395-3400 first-line pressure above. If this range is effectively broken, the gold price is expected to hit the previous high and further open up the upward space. From the daily level, the market is still in the "low-long" rhythm of the trend, and it is expected to maintain a volatile upward trend in the short term. The recent market fluctuations are large. In terms of operation, it is necessary to strictly control the position and pay attention to risk prevention.
Gold operation strategy recommendation: Go long when gold falls back to 3345-3355, target: 3380-3390.

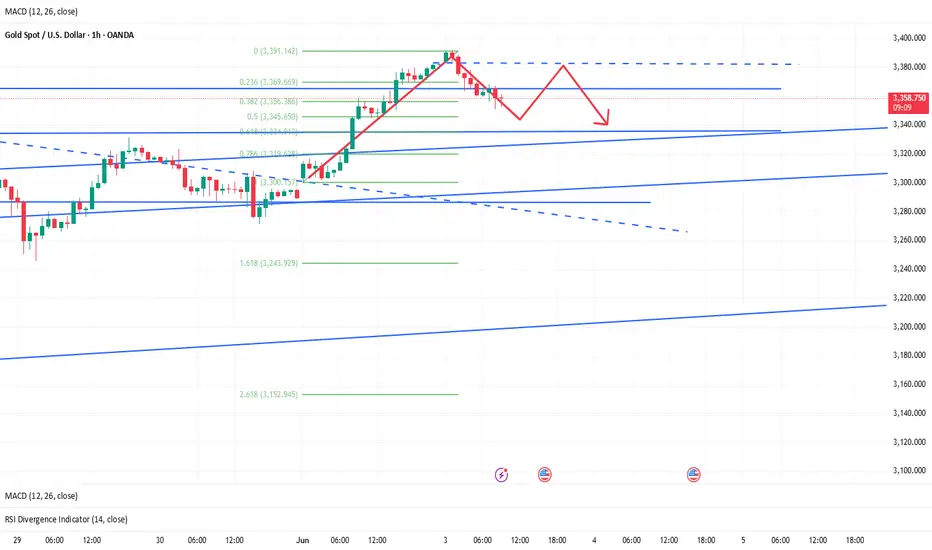
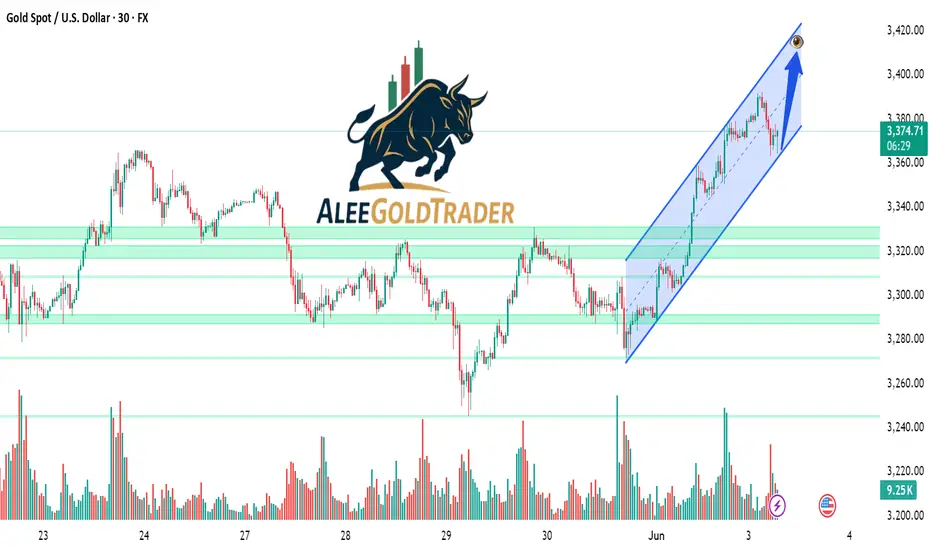
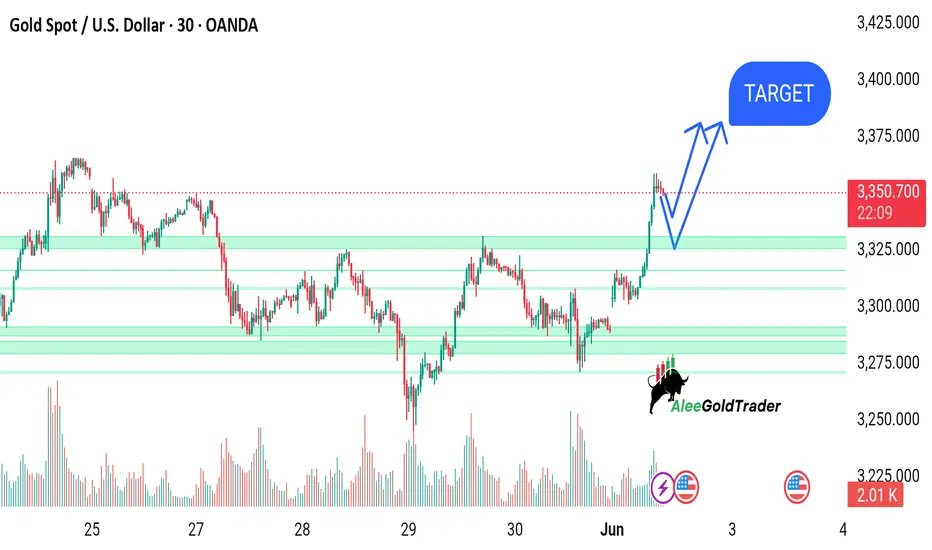
Gold Price Analysis (XAU/USD) – Bullish Channel Projection – This 30-minute candlestick chart of Gold Spot (XAU/USD) displays a strong bullish trend within an ascending channel marked in blue. Price action has bounced from key support zones (highlighted in green) and is currently retracing within the channel. The chart suggests a potential continuation toward the upper boundary of the channel, around the $3,400–$3,410 level, as indicated by the blue arrow. Key support lies near $3,340 and $3,310, with volume activity showing increased interest on upward moves. The analysis implies bullish momentum may persist if the trend channel remains intact.
Gold Price Analysis June 3D1 candle confirms strong price increase by breaking the previous selling zone around 3365 and breaking the trendline structure
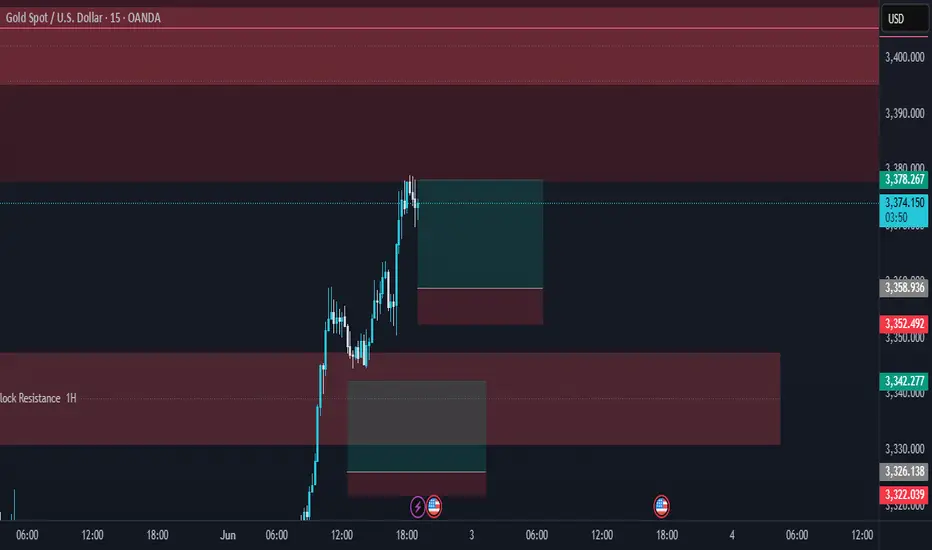
On the h4 time frame, it shows quite nice price increase waves. On h1, it shows that this morning's Asian session has profit-taking waves from sellers, leading to gold prices worth retesting important support zones.
3353 has reacted once, many zones are considered buying opportunities today. 3332, 3325, 3315 are considered price reactions for long-term BUY signals today, which can push up to 34xx
If 3353 remains stable, Gold will push up to 3390 to react once before touching the daily resistance zone around 3408
GOLD LONG IDEAGold has been extremely bullish in the last few months on higher time frame.
Monthly : Bullish
Weekly : Bullish
Daily: Bullish
4HR : Bullish
I will be buying this bullish trend retracement on 4HR time frame.
But I want to see a bullish price action before I enter the trade for long.
My overall target is the major high created in April.
My RR is 1:5.
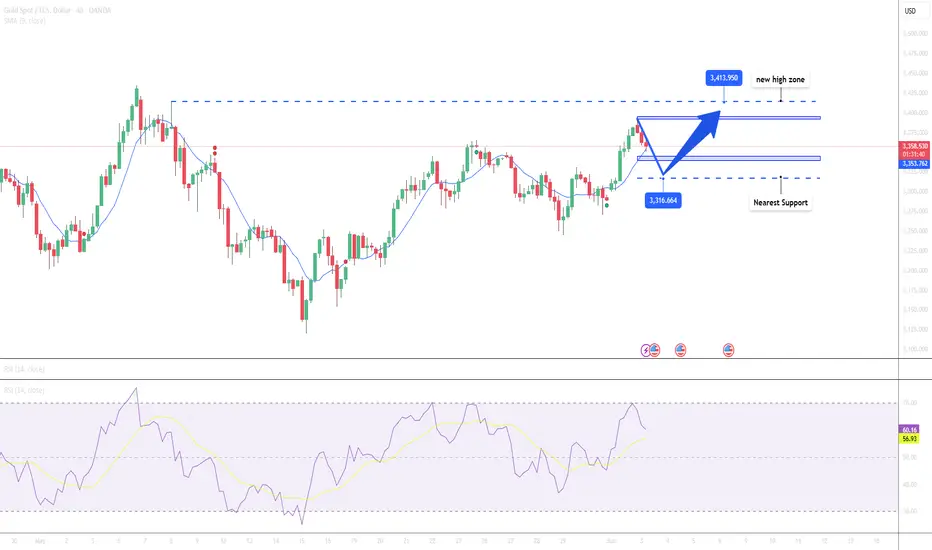
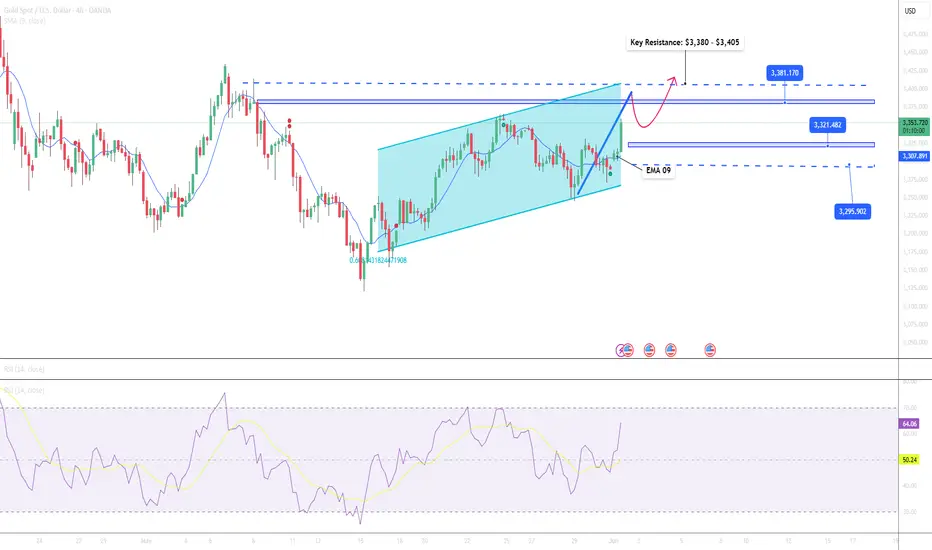
Gold Extends Rally as USD Weakens and Geopolitical Risks Mount📊 Market Overview
Gold (XAU/USD) surged and recorded a session high near $3,392/oz on June 3, 2025. The U.S. dollar continued to weaken as Treasury yields declined, while investors rushed into safe-haven assets amid intensifying Russia–Ukraine tensions and renewed U.S.–China trade conflicts.
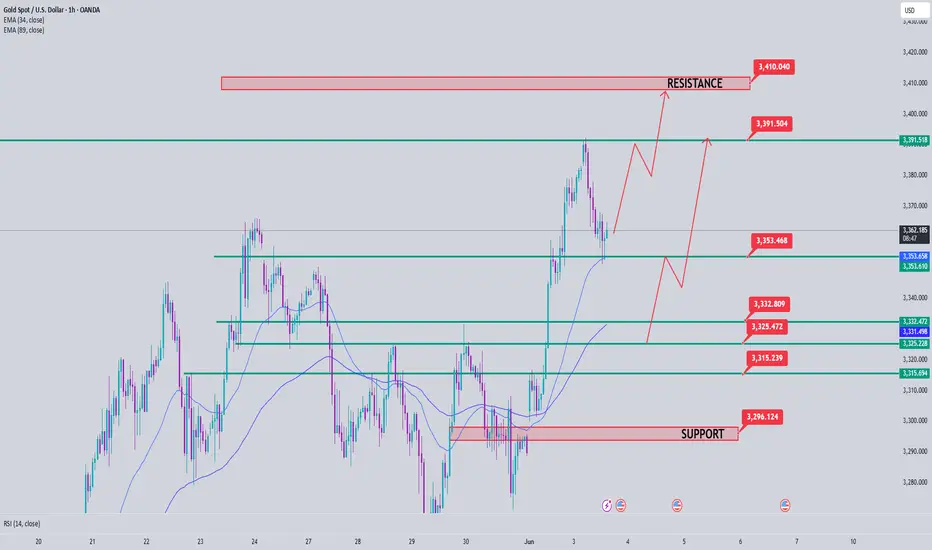
📉 Technical Analysis
• Key Resistance: $3,392 – $3,410 (new high zone)
• Nearest Support: $3,345 – $3,318
• EMA 09: Price remains above EMA 09, confirming the short-term uptrend.
• RSI (H4): Approaching 70, showing strong bullish momentum but nearing overbought conditions.
• Candle Pattern: Long upper wick seen on H4 candle at $3,392 suggests profit-taking pressure. If this level holds, a short-term correction may follow.
📌 Outlook
Gold may experience a short-term pullback if it fails to break above the $3,392 – $3,410 resistance area due to profit-taking. However, the broader trend remains bullish as long as the USD stays weak and geopolitical tensions persist.
💡 Suggested Trading Strategy
🔻 SELL XAU/USD at: $3,388 – $3,392
🎯 TP: $3,345 (~400 pips)
❌ SL: $3,397
🔺 BUY XAU/USD at: $3,318 – $3,322
🎯 TP: $3,365
❌ SL: $3,308
Evening gold analysis and trading point layout📰 Impact of news:
1. Fed's Goolsbee: Despite the unresolved tariff issue, it is still believed that interest rates are expected to fall in the next 12 to 18 months
2. May PMI data is positive
3. Russian media: Russia lists the full withdrawal of Ukrainian troops from Russian territory as one of the ceasefire options
📈 Market analysis:
Judging from the 4H chart, gold is currently fluctuating around the 3370 line, and the bulls are still relatively strong. We should pay attention to the short-term support at 3365-3355 below, and the short-term suppression at 3385-3395 above. If it breaks through the upper suppression, we will pay attention to the 3400 line suppression position. The recent market fluctuations have been relatively large, so bros must set take-profit and stop-loss when trading independently!
🏅 Trading strategies:
BUY 3365-3355
TP 3370-3380-3400
If you agree with this view, or have a better idea, please leave a message in the comment area. I look forward to hearing different voices.
TVC:GOLD FXOPEN:XAUUSD FOREXCOM:XAUUSD FX:XAUUSD OANDA:XAUUSD

Gold remains up at the beginning of this week
📌 Gold Consulting
Gold prices rose sharply on Monday, reaching their highest level in more than four weeks, affected by the escalation of geopolitical risks caused by the conflict between Russia and Ukraine. The re-escalation of trade tensions between China and the United States prompted investors to buy gold throughout the day. As of this writing, XAU/USD is trading at $3,377, up 2.70%.
Market sentiment turned sour on news that Ukraine launched an airstrike against Russia, destroying long-range bombers and other aircraft. Meanwhile, US President Trump doubled the tariffs on steel and aluminum imports to 50%, effective June 4, and his remarks against China led to a decline in US and global stock markets. CNBC
Reports said that Trump and Chinese President Xi Jinping may talk this week, but not on Monday.
📊Comment Analysis
Gold prices maintained their upward momentum at the beginning of this week, but tariff tensions and war with Russia remain unpredictable. Gold prices are supported and will return to the 3400 area.
💰Strategy Package
🔥Sell Gold Zone: 3409-3411 SL 3416
TP1: $3400
TP2: $3388
TP3: $3372
🔥Buy Gold Zone: $3313-$3315 SL $3308
TP1: $3327
TP2: $3340
TP3: $3355
⭐️ Note: Labaron hopes that traders can properly manage their funds
- Choose the number of lots that matches your funds
- Profit is 4-7% of the fund account
- Stop loss is 1-3% of the fund account

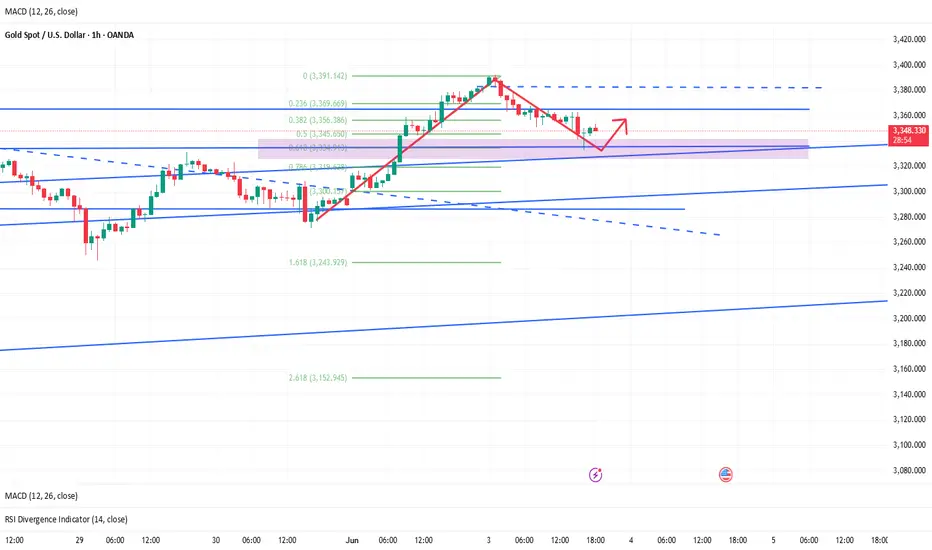
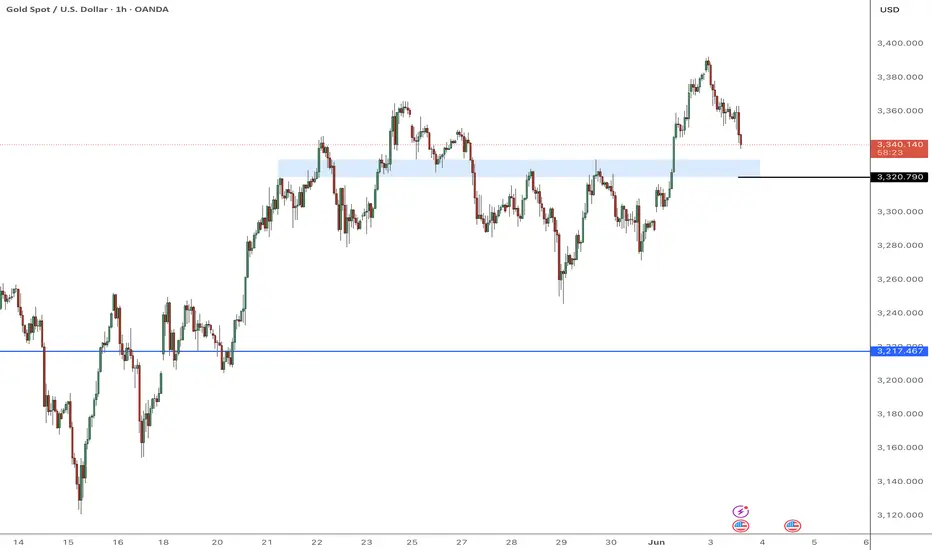
Gold (XAU/USD) Bullish Breakout Analysis – 30-Minute Chart. This chart shows a bullish breakout in Gold Spot (XAU/USD) on the 30-minute timeframe. After breaking above key resistance levels around the 3,325.000 zone, price action has shown strong upward momentum. The chart suggests a potential short-term pullback (as illustrated by the blue retracement path) followed by a continuation toward the projected target zone near 3,400.000. Multiple support zones (highlighted in green) now provide a solid base for potential buying opportunities. This setup, marked by volume confirmation and structure breakout, aligns with a bullish market sentiment.
XAUUSD Bullish Signal | Technical + Custom AlgoSmart Trend Signal | Technical Analysis + Custom Algorithm
This signal is the result of a combination of classic technical trend analysis and a proprietary software I personally developed.
Don't chase long positions easily during high-level adjustments📰 Impact of news:
1. The conflict between Russia and Ukraine breaks out again, exacerbating the uncertainty of the situation
2. The tension in the Middle East continues, Iran claims to be ready to defend its airspace at any time, and the Houthi armed forces attack Israeli airports
3. May PMI data released
📈 Market analysis:
In the short term, the double high points above the gold price are suppressed at the 3365 line. The MACD indicators at the 4H and daily levels tend to form a golden cross, releasing bullish signals. In the short term, if you want to confirm a unilateral upward trend, you need to break through the 3365 line. Despite the strong bullish signals, as I just reminded you, the current technical indicators are close to overbought areas, and I still think there is a certain risk of a correction. In the European session, I will consider trying to short at the 3355-3365 line, and pay attention to the short-term support at 3340-3330 line below. Later, after the price gets some support at the support level, we can consider long trades.
🏅 Trading strategies:
SELL 3355-3365
TP 3340-3330-3320
If you agree with this view, or have a better idea, please leave a message in the comment area. I look forward to hearing different voices.
OANDA:XAUUSD FX:XAUUSD FOREXCOM:XAUUSD FXOPEN:XAUUSD TVC:GOLD

Gold is rising strongly, waiting for a breakthrough.Gold prices soared after the Asian market opened, reaching an intraday high near 3363. However, today's market is also affected by many black swan events.
Event summary:
On the eve of the ceasefire negotiation between Russia and Ukraine, Ukraine attacked a Russian military base with a drone; the United States said it was unaware of the incident.
Trump made a statement saying that China violated the relevant provisions on trade tariffs, and then the US Treasury Secretary said: The United States will never default. This news has worsened Sino-US trade relations.
Due to the sudden black swan event, the sentiment for gold as a safe-haven asset has rapidly heated up, and the price of gold has skyrocketed in the Asian market.
At present, due to the impact of international events, the price of gold has calmed down after the correction, and is currently consolidating around 3355. The 1-hour chart shows that the 5-day MA moving average is currently flat, but the 10-day and 30-day MA moving averages have turned sharply and are on an upward trend, so I think that the current rise in gold has not yet reached its peak.
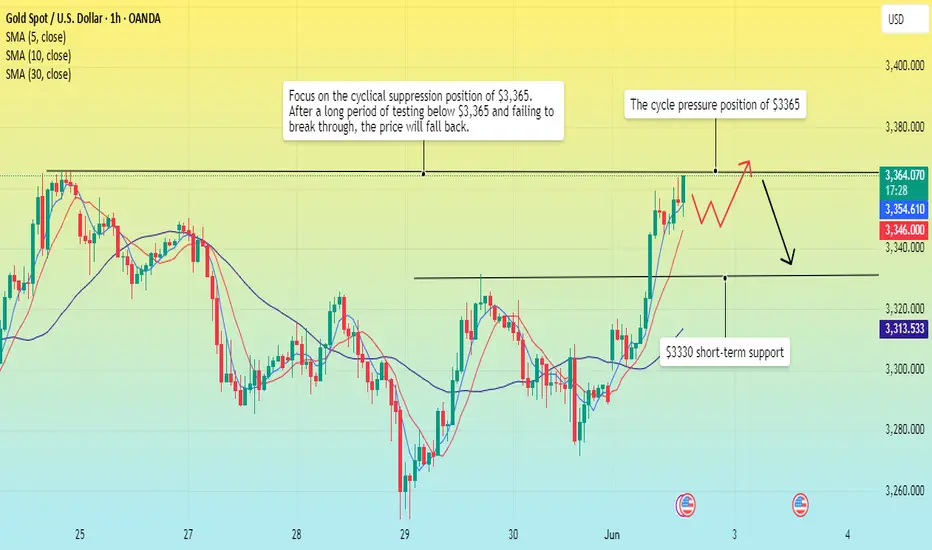
Market analysis:
The support level in the Asian morning session is around 3300, and the gold price has successfully stood above 3330, and the lower support has also moved up to around 3330; the intraday gold price has a very small retracement, and it is still breaking through the upper side. It is currently trying to break through the cycle suppression level of 3365. After a strong breakthrough, it will reach the cycle high point of 3370. If it fails to break through strongly, the price will fall below 3365 and may touch the current support level of 3330.
Operation strategy:
Buy near 3345, stop loss 3335, target range 3360-3370.
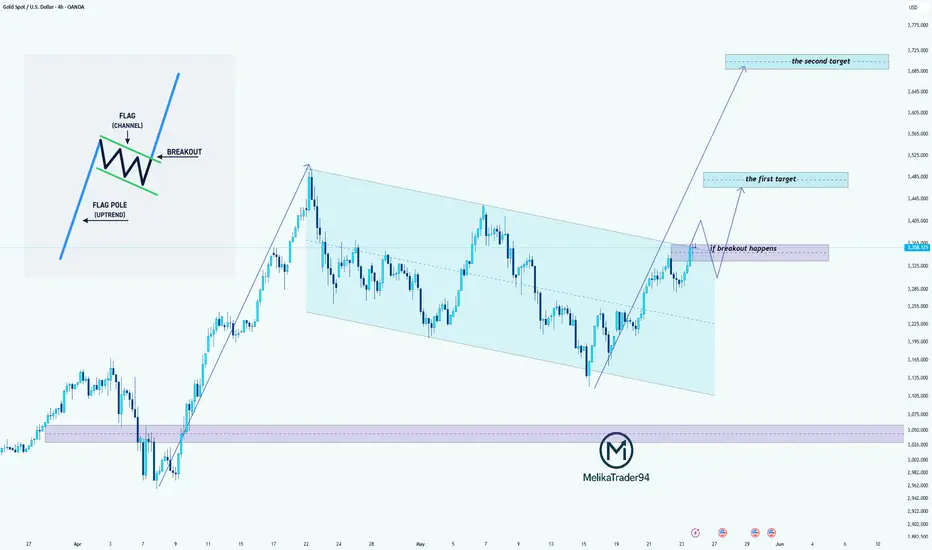
Gold: Bullish Flag Formation Suggests Further Upside Potential Hello guys, let's dive into Gold analysis!
Gold is currently forming a bullish flag pattern, a continuation formation that typically follows a strong upward impulse (flagpole). After a sharp rally, the price consolidated within a downward channel, creating the classic flag structure.
🔍 Technical Breakdown:
Flagpole: The strong bullish rally in early April marks the beginning of the uptrend.
Flag (Channel): Price has corrected in a downward-sloping channel, respecting both upper and lower bounds, creating a textbook flag pattern.
Breakout Zone: Price is now testing the upper boundary of the flag. A confirmed breakout above this resistance would signal a continuation of the prior uptrend.
🎯 Price Targets:
First Target: Around $3,445, which aligns with the measured move from the breakout point.
Second Target: Around $3,725, representing full flagpole projection from the breakout zone.
📌 Key Levels to Watch:
Breakout Confirmation: A strong 4H close above the flag’s upper boundary (~$3,260) with volume confirmation would validate the pattern.
_____________________________________
Invalidation: A rejection from the resistance and a fall below the channel may delay the bullish scenario, potentially retesting lower support around $3,090.
📊 Conclusion:
This setup favors bulls, but patience is key. Traders may consider waiting for a clear breakout and retest for safer long entries, aiming for the outlined targets.
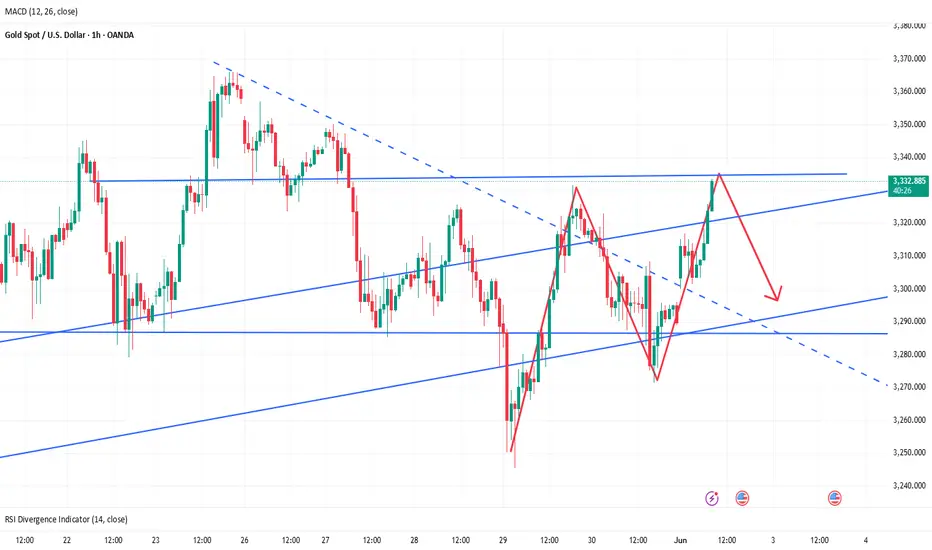
Gold Continues to Rise Amid Increased Safe-Haven Demand📊 Market Overview:
Gold prices surged on June 2, 2025, reaching multi-week highs as investors sought safe-haven assets amid escalating geopolitical tensions and trade war concerns. U.S. President Donald Trump's announcement to double tariffs on steel and aluminum imports to 50%, along with Ukraine's drone attacks on Russian facilities, prompted investors to flock to gold as a secure investment.
📉 Technical Analysis:
• Key Resistance: $3,380 – $3,405
• Nearest Support: $3,320 – $3,295
• EMA: Price is above EMA 09 → uptrend.
• Candlestick Patterns / Volume / Momentum: RSI(14) at 65 , MACD(12,26) signaling buy, indicating continued upward momentum.
📌 Outlook:
Gold may continue its short-term uptrend if it holds above the $3,320 support level. However, caution is advised due to potential technical corrections as RSI indicates overbought conditions.
💡 Suggested Trading Strategy:
SELL XAU/USD at: $3,380 – $3,385
o 🎯 TP: $3,320
o ❌ SL: $3,405
BUY XAU/USD at: $3,295 – $3,320
o 🎯 TP: $3,380
o ❌ SL: $3,270
Is the positive news fading? The latest analysis of gold📰 Impact of news:
1. The conflict between Russia and Ukraine breaks out again, exacerbating the uncertainty of the situation
2. The tension in the Middle East continues, Iran claims to be ready to defend its airspace at any time, and the Houthi armed forces attack Israeli airports
3. May PMI data released
📈 Market analysis:
As geopolitical conflicts between Russia and Ukraine and the Middle East broke out again over the weekend, gold jumped higher today. From a technical perspective, the 1H chart shows a bullish arrangement, but the gold price is in a downward channel at the daily level. The gold price is currently near the middle track of the Bollinger Band and is obviously suppressed by the downward channel. The 4H level Bollinger Bands narrowed, the moving averages adhered, the long and short positions were in a stalemate, and the MACD indicator hovered around the 0 axis. 3330 - 3335 above is the key resistance area. If it breaks through 3340, it is expected to continue to see new highs. At the same time, there is short-term support in the 3285-3280 range below. 3270 - 3265 becomes the key important support. If it falls below, it may fall to 3245. For short-term operations in the Asian and European sessions today, if the resistance area of 3325-3335 cannot be effectively broken through, you can consider shorting and look towards 3310-3290 in the short term.
🏅 Trading strategies:
SELL 3325-3335
TP 3310-3290
If you agree with this view, or have a better idea, please leave a message in the comment area. I look forward to hearing different voices.
TVC:GOLD FXOPEN:XAUUSD FOREXCOM:XAUUSD FX:XAUUSD OANDA:XAUUSD
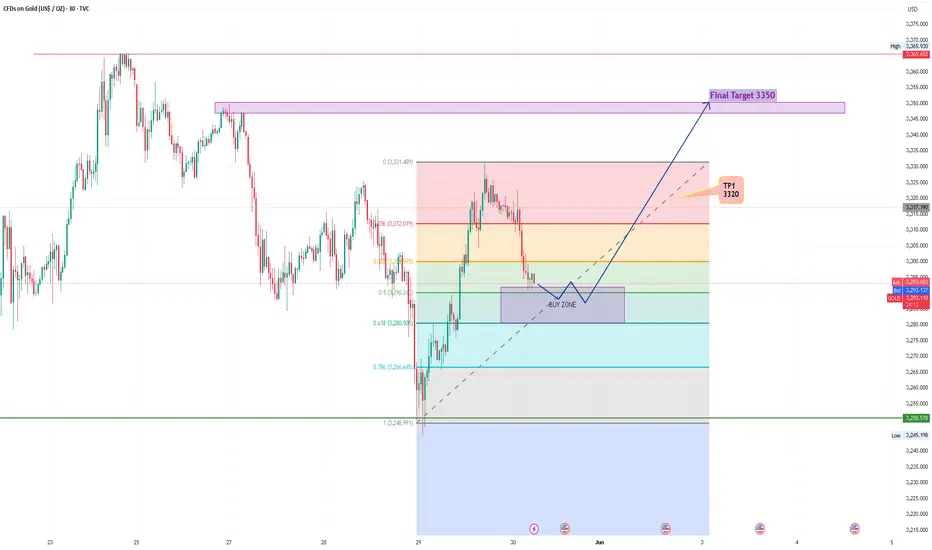
XAU/USD Buy Setup Explanation (Using Fibonacci Levels)This chart presents a bullish trading setup on gold (XAU/USD) based on a Fibonacci retracement strategy. It suggests a buy opportunity after a pullback.
✅ Fibonacci Levels:
> 0.0% (Top): $3,331 – recent swing high (used as reference)
> 23.6%: $3,312 – minor resistance zone
> 38.2%: $3,297 – initial pullback area
> 50.0%: $3,290 – psychological mid-level
> 61.8% (Golden Ratio): $3,280 – key Fibonacci support
> 78.6%: $3,266 – deeper retracement support
> 100% (Bottom): $3,249 – recent swing low
🟪 Buy Zone (Between 50% and 61.8%):
The marked BUY ZONE is between $3,290 and $3,280, aligning with the Fibonacci golden pocket.
This is a high-probability reversal area, as it combines:
Strong Fibonacci confluence (50%–61.8%)
Prior price reaction zones (structure-based support)
: TP1: $3,320 – aligns with previous structure zone and 23.6% retracement.
: Final Target: $3,350 – a retest of the major resistance and previous high.
📌 Conclusion:
This is a classic Fibonacci retracement long setup:
Wait for a bullish reversal pattern (e.g., pin bar, engulfing) in the buy zone.
As long as the price holds above $3,266, the bullish structure remains valid.
Ideal for swing traders looking to catch a bounce off the golden ratio support.
Gold Price Forecast – Bullish Reversal from Support Zone.This 2-hour chart of Gold Spot (XAU/USD) displays a technical analysis setup with key support and resistance zones. The price recently bounced from a significant green support zone near $3,260, suggesting bullish momentum. The projected blue zigzag arrow illustrates a potential upward price movement towards the $3,340 resistance area, indicating a bullish reversal scenario. Volume bars at the bottom highlight recent buying interest. If the price sustains above the immediate resistance (~$3,280), it may continue to rise, targeting successive resistance levels around $3,320 and $3,340.

Gold May Undergo Short-Term Correction Before Continuing Uptrend📊 Market Overview:
Gold prices are currently around $3,307/oz, up 0.5% on June 2, supported by safe-haven demand amid escalating geopolitical tensions and trade concerns. However, after reaching a peak of $3,500 in April, gold has corrected as market sentiment shifted towards riskier assets due to easing US-China trade tensions.
📉 Technical Analysis:
• Key Resistance: $3,325 – $3,350
• Nearest Support: $3,280 – $3,265
• EMA: Price is above EMA 09 → uptrend.
• Candlestick Patterns / Volume / Momentum: Gold is in a consolidation phase with a slight upward bias. Technical indicators like RSI(14) at 56.183 and MACD(12,26) signaling buy suggest continued upward momentum.
📌 Outlook:
Gold may experience a short-term correction if it fails to hold the $3,280 support level. However, the long-term trend remains positive if the price stays above EMA 09 and does not break key support.
💡 Suggested Trading Strategy:
SELL XAU/USD at: $3,325 – $3,330
🎯 TP: $3,305
❌ SL: $3,335
BUY XAU/USD at: $3,280
🎯 TP: $3,300
❌ SL: $3,270
