Buying on pullbacks remains the main theme!Tariff turmoil resurfaces, gold price jumps!
The Trump administration once again wields the tariff stick, threatening to impose a 50% tariff on the EU from June 1, and saying that there has been no progress in the negotiations between the US and the EU. Because the timing of this threat is quite subtle. Just earlier this week, the EU just submitted a new framework proposal to the US to restart bilateral trade negotiations. This directly led to a jump in gold price tonight!
Faced with the tough stance of the US, the EU is not sitting still. It is reported that the EU has formulated a contingency plan. If the negotiations fail, it will impose additional tariffs on US exports worth 95 billion euros in response to Trump's "reciprocal" taxation and 25% tariffs on cars and some parts, which will inevitably cause further impact on the market!
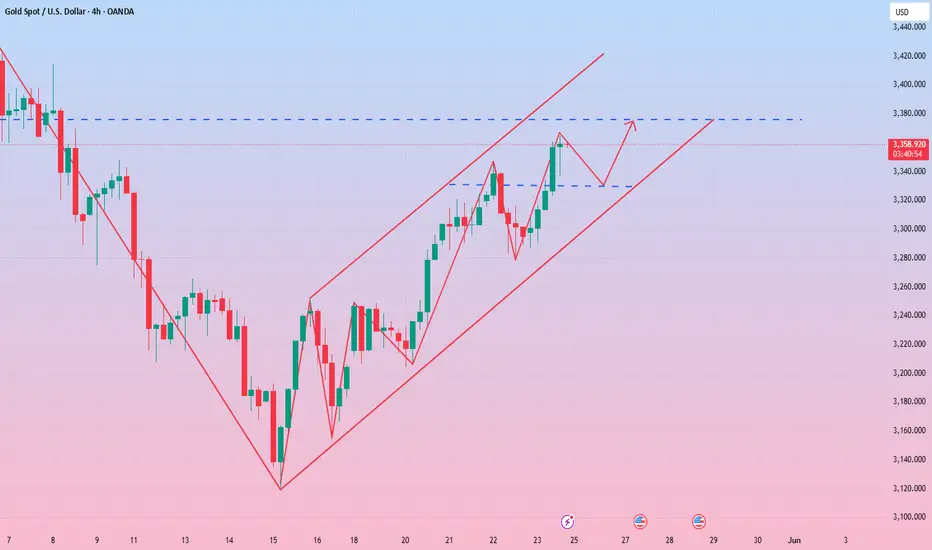
The bulls are in control and are unwilling to give the bears too many opportunities to cover their losses. Therefore, the strategy of following the trend needs to be more active - strong markets usually do not experience a deep retracement, and the correction phase will not break the previous low for the second time. After the current gold price surged to 3365, the intraday bull defense position should be set at 3340. The previous low of 3320 has been effectively supported, and the bulls have taken the absolute initiative, and there will be no short-selling opportunities in the short term. Based on the current strong bullish performance, continuing to maintain a bullish mindset is the core of the transaction.
Operation strategy:
1. Gold recommends going long in the 3340-3330 area, with a target of 3350-3360.
2. Gold recommends going short in the 3365-3375 area, with a target of 3350-3340.
Goldlong
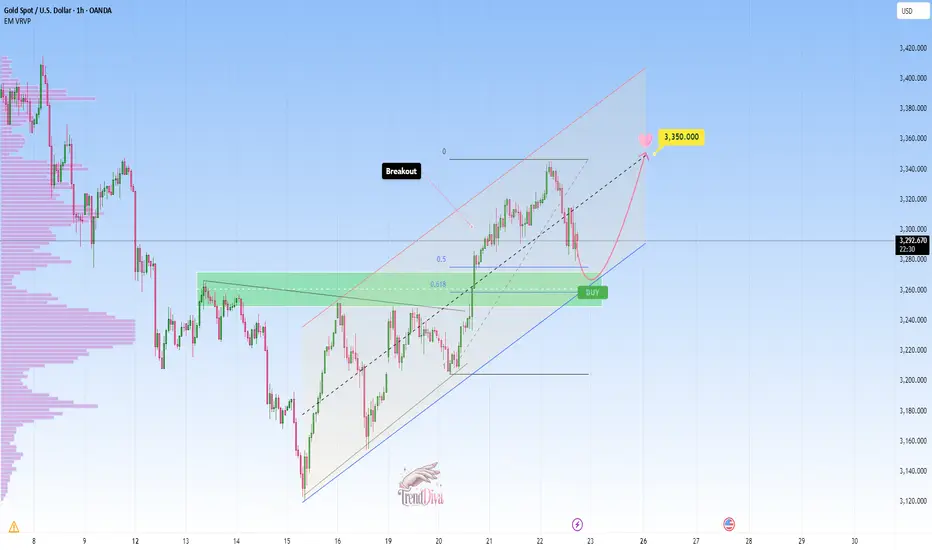
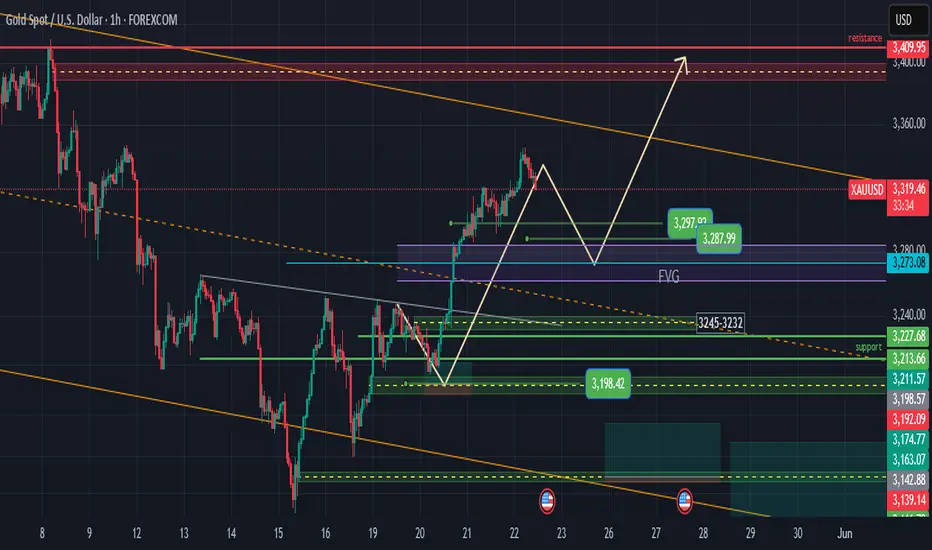
GOLD trending higher: Can buyers push towards 3,350$?Right now OANDA:XAUUSD is a classic case of a market trading within an ascending channel, with price action consistently respecting both its upper and lower borders.
The price has broken above a clear resistance zone and may pull back for a retest. This area also happens to coincide with the golden pocket of the recent swing and so it deserves special attention. If it holds as support, then that would be a confirmation of the bullish structure with the most likely possibility of a move towards 3,350, the middle side of the channel.
As long as the price stays above this support zone, the validity of the bullish setup is still there. If it does not, the short-term bullish outlook would therefore be interrupted and might be followed by further downside pullback.
Be sure to use proper risk management always.
XAUUSD Intraday Analysis – 23 May 2025Technical Outlook:
Price is currently trading within a well-defined ascending channel, with both the upper and lower trendlines being respected consistently. The recent bullish momentum aligns well with the overall market structure, suggesting continued upward pressure.
Channel Support Zone: The lower bound of the channel has consistently acted as dynamic support, with price bouncing each time.
Fair Value Gaps (FVGs): Two clear FVGs are present, with price reacting to the first one already. The second, slightly higher FVG, aligns with the midline of the channel — a common area of short-term consolidation or continuation.
Key Buy Zones:
Zone 1: 3300–3305 – Ideal first entry zone aligning with minor demand and the lower region of the current consolidation.
Zone 2: 3315–3320 – Second entry zone closer to mid-channel and higher FVG area.
Bullish Confluence:
Channel support (structure).
FVG demand zones.
Higher highs and higher lows (market structure).
No significant resistance until ~3380–3400, providing ample R:R.
📈 Trade Signal (XAUUSD)
Bias: Bullish
Entry Zones:
🔹 Buy Limit @ 3300–3305
🔹 Buy Limit @ 3315–3320
Stop Loss: (just below channel support)
Take Profit 1: 3335
Take Profit 2: 3355
Take Profit 3: 3375
Take Profit 4: 3385
Risk Management: 1–2% per entry zone based on your account size. Adjust position size according to risk tolerance.
Kindly follow, share, support and boost.
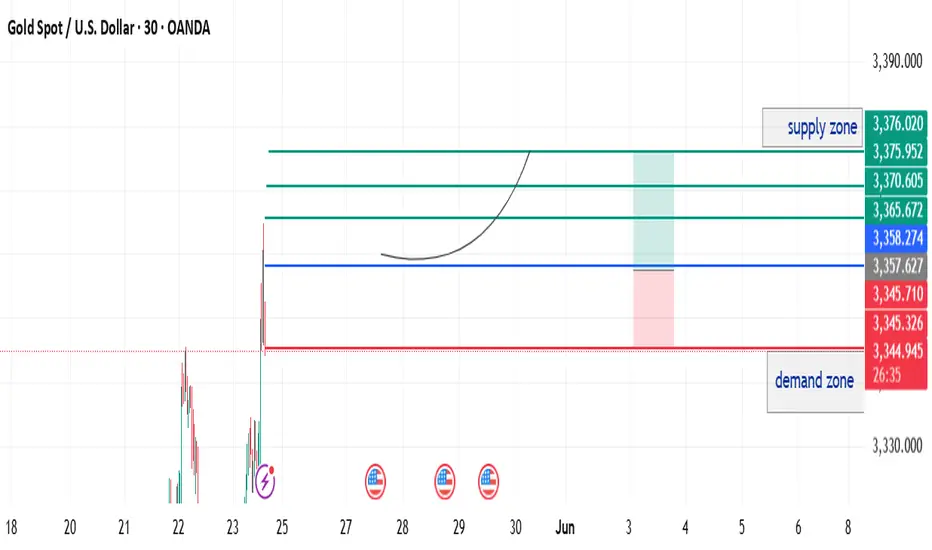
Gold Buy Setup: Demand Reaction with Eyes on Supply Zone”Gold (XAUUSD) has reacted strongly from the 3345–3351 demand zone, indicating that buyers are stepping in with some serious momentum. The wick rejections and bullish engulfing candles point to institutional interest in this area.
Right now, the price is hanging around the mid-level (3357–3358). If this level holds as support, we expect to see a continued push towards the 3370–3376 supply zone, which coincides with a significant resistance level on the 30-minute chart and a potential area for liquidity sweeps.
The route to the supply zone looks technically clear, backed by:
- Reaction from the demand zone
- A bullish internal structure
- Price making higher lows on lower timeframes
🔹Trade Setup (Buy Bias):
- Entry Zone: 3357–3358
- Stop Loss: Below 3345 (to invalidate the demand)
Take Profits:
- TP1: 3370
- TP2: 3376 (upper limit of the supply zone)
⚠️ Notes:
If the price closes below 3345, we’ll shift to a neutral bias.
Make sure to wait for clear bullish confirmation before jumping into any market entries.
📊 Bias: Bullish (Short-term swing towards the supply zone)
Timeframe: 30-minute chart
Market Structure: Bullish after defending the demand
Trump triggers risk aversion, how to position gold?🗞News side:
1. Trump plans to impose a 50% tariff on the EU
2. Houthi armed forces strike Israel again
3. Pay attention to the impact of the US dollar trend on gold
📈Technical aspects:
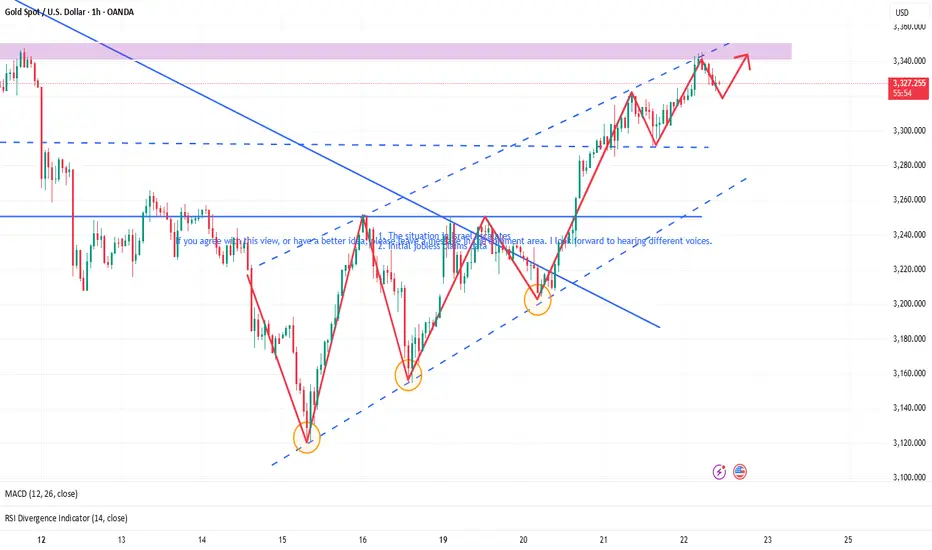
Trump is "crazy?" He suggested to impose a 50% tariff on the EU directly from June 1, and threatened to impose a 25% tariff on iPhones not produced locally. This news caused the euro, European stocks, and iPhone stock prices to plummet. At present, the gold price is consolidating between 3350 and 3360. For the US market, it is necessary to prevent a wash, but the short-term increase has been too large. If there is a rapid adjustment, the amplitude will also be large. Therefore, the US market is stuck in the range operation. Pay attention to the support of 3335-3325 below. If it continues to rise, pay attention to the resistance range of 3375-3385.
If you agree with this view, or have a better idea, please leave a message in the comment area. I look forward to hearing different voices.
OANDA:XAUUSD FX:XAUUSD TVC:GOLD FXOPEN:XAUUSD FOREXCOM:XAUUSD

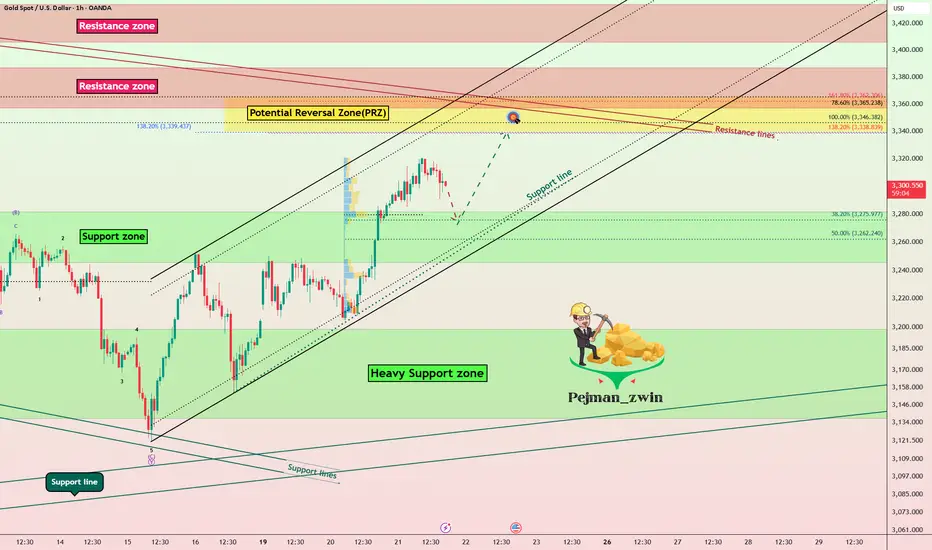
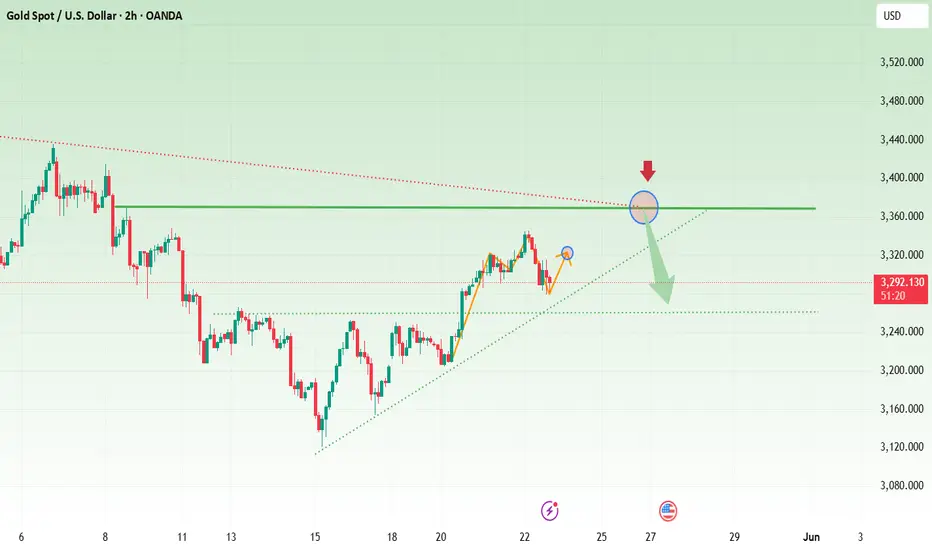
Gold Retests Broken Resistance – Is the PRZ Next?As I expected in the previous IDEA , Gold ( OANDA:XAUUSD ) managed to break the Resistance zone($3,280-$3,245) and touched the first target .
Gold appears to be completing a pullback to the Resistance zone($3,280-$3,245) .
On my chart , the Resistance zone($3,280-$3,245) is currently labeled Support zone($3,280-$3,245) .
I expect Gold to move towards the Potential Reversal Zone(PRZ) and Resistance lines after the pullback is completed .
Note: If Gold touches $3,243 , we should expect a drop.
Gold Analyze ( XAUUSD ), 1-hour time frame.
Be sure to follow the updated ideas.
Do not forget to put a Stop loss for your positions (For every position you want to open).
Please follow your strategy; this is just my idea, and I will gladly see your ideas in this post.
Please do not forget the ✅' like '✅ button 🙏😊 & Share it with your friends; thanks, and Trade safe.
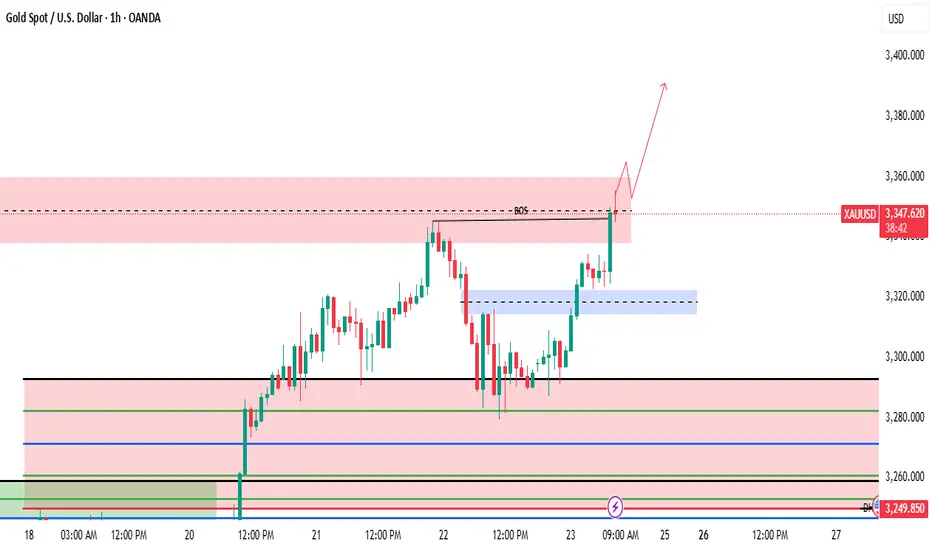
$3350 would indicate short-term strengthGold Price Analysis – Technical Outlook
Gold is currently approaching a critical resistance level around 3350. If the price manages to break and close above this level on the 15-minute chart, it could signal the continuation of the bullish trend. A confirmed 15-minute candle close above 3350 would indicate short-term strength and increased buying pressure.
To strengthen this bullish bias, we are also watching for a Break of Structure (BOS) on the 1-hour timeframe. A BOS would suggest a shift in market structure, potentially transitioning from a consolidation or retracement phase into a new impulsive leg to the upside.
If both conditions – the 15M candle close above 3350 and a 1H BOS – are met, the next immediate target would be 3370. Depending on how the price action unfolds beyond that point, and supported by additional confirmations such as volume, momentum indicators, or price patterns, there could be further upside potential.
As always, ensure you apply risk management and conduct your own thorough analysis before making any trading decisions.
Disclaimer: This is not financial advice. Please do your own research (DYOR).
3330 is in stalemate 3335 is the key to long and short positions🗞News side:
1. PMI and initial jobless claims data
2. Geopolitical situation
3. Progress of the G7 meeting
📈Technical aspects:
Currently, the gold price is caught in a fierce battle between bulls and bears at the 3330 level. From a technical point of view, gold is still in the weekly level adjustment and no clear unilateral trend has emerged. Recently, there has been frequent changes in long and short positions, and the rise and fall of prices depends on the impact of news on the market. Even if gold experiences a correction at present, it is likely to be only a small range. Therefore, in the short term, attention should be paid to the resistance line of 3330-3335. If it breaks through, it is expected to look towards yesterday's high of 3345. If it encounters resistance and pressure at 3330-3335, it may retreat to 3310-3300 in the short term for correction. The upper strong pressure is still at 3350-3360, and the lower support of 3300-3290 is still strong. There is no good entry trading opportunity at present, so brothers should wait patiently.
If you agree with this view, or have a better idea, please leave a message in the comment area. I look forward to hearing different voices.
FOREXCOM:XAUUSD FXOPEN:XAUUSD TVC:GOLD FX:XAUUSD OANDA:XAUUSD
Gold XAUUSD Possible Move 22 May 2025🧠 Technical Analysis
Price action recently broke down from a rising wedge formation—a classic bearish pattern—indicating a short-term correction. After forming a local top near the 3,345 supply zone, price is now retracing and approaching a key demand zone around 3,295/90–3,300, which previously acted as consolidation support before the breakout.
This zone also aligns with:
Previous demand / order block area.
Liquidity grab potential below minor structure.
Psychological round number 3,300.
If bullish structure forms (e.g., double bottom, bullish engulfing) in this zone, it would confirm buyers stepping back in.
Given the strong bullish momentum prior to the wedge, this current drop is likely a healthy retracement before continuation toward higher levels.
📈 Trade Setup (Buy Limit Idea):
Buy Entry: 3,295–3,300 (within demand zone)
Stop Loss: 3,285 (below zone, structure invalidation)
Take Profit 1: 3,320 (first supply reaction level)
Take Profit 2: 3,345 (prior high/supply zone)
Take Profit 3: 3,355 (liquidity sweep above highs)
Risk-Reward: ~2.5R to TP2
Confirmation Tip: Look for bullish price action (e.g., bullish engulfing, break of minor structure) on M5–M15 before entering.

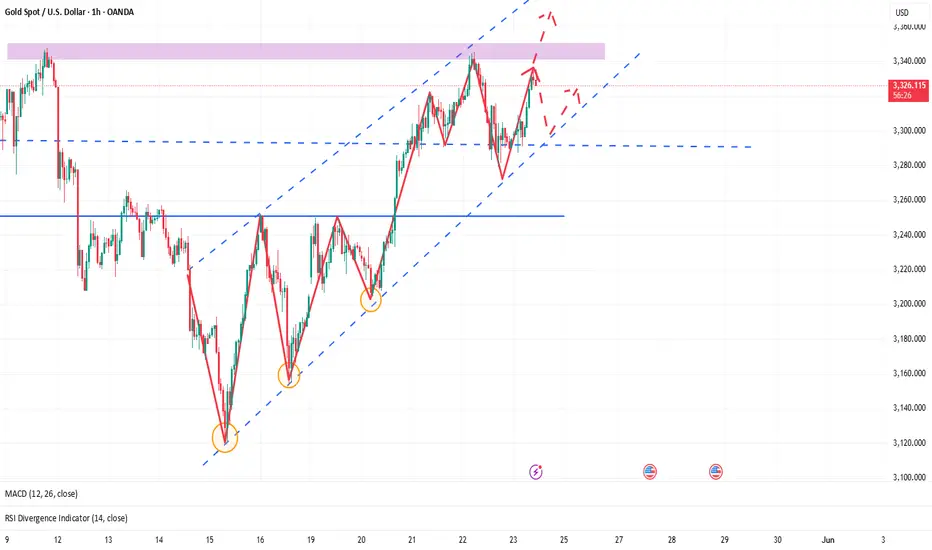
Gold May Continue Rising – Signs of Short-Term Recovery EmergingGold is showing a strong recovery from the recent low of $3280/oz and has now surpassed the key resistance at $3325, currently trading around $3330. The upward momentum remains intact as gold continues to trade above the EMA 09, indicating that bulls are still in control in the short term.
There is a possibility that gold could retrace slightly to the $3310 zone to gather momentum before pushing higher toward the next resistance at $3350.
Key factors supporting the short-term bullish outlook:
• The US dollar has temporarily weakened after economic data came in less impressive, giving gold room to rise.
• Gold demand has seen a slight rebound from ETFs after recent sell-offs.
• Geopolitical tensions in the Middle East and cautious sentiment in equity markets continue to support gold as a safe-haven asset.
🔍 Technical Analysis:
• Price remains above the EMA 09, indicating the bullish trend is still intact.
• Nearest support: $3310 – could be an attractive entry point for buyers.
• Next resistance: $3350 – serves as the immediate upside target.
• Bullish candlestick patterns are forming with no strong reversal signals so far.
💡 Suggested Trade Strategy (Short-Term Bias: Bullish):
• BUY XAU/USD at 3310 – 3312
🎯 TP: 3325 – 3327
❌ SL: 3307
• BUY XAU/USD at 3320 – 3322
🎯 TP: 3335 – 3337
❌ SL: 3317
Flexible strategies lead to the best response.📍News:
The continued escalation of the war in the Middle East has increased risk aversion in the gold market.
At the same time, the Russian-Ukrainian negotiations broke down, and Russia launched the largest attack since 2022. Under the double attack, the market's risk aversion is full.
📊Gold technical analysis:
Today's gold price showed a violent fluctuation pattern. During the Asian session, the gold price quickly broke through the 3345 regional resistance and then fell back quickly, indicating that the short-term top pressure was significant. Subsequently, the market fluctuated repeatedly in the 3345-3320 high range and the 3320-3280 low range. After testing the 3350 high point in the Asian session, it retreated sharply, releasing a staged peak signal, indicating that the previous increase has entered the correction and callback stage, but the overall trend is still dominated by wide fluctuations.
Market sentiment reversed, and the price slowly fell and then was pulled up by the positive line. The game between long and short positions was fierce. Although the short position once dominated, the long position counterattacked strongly, and it is expected that it may hit the resistance near 3320 again. The current market has not formed a unilateral trend. The operation is still to deal with the idea of shocks, and maintain the idea of high-altitude and low-multiple. The strong resistance above is at 3350, and the key support below is 3280-3275. The probability of breaking down in the short term is low.
🎯Operational suggestions: Go long on gold when it falls back to around 3280-3275, look at 3300 and 3320, and go short if the rebound pressure of 3320 is not broken.

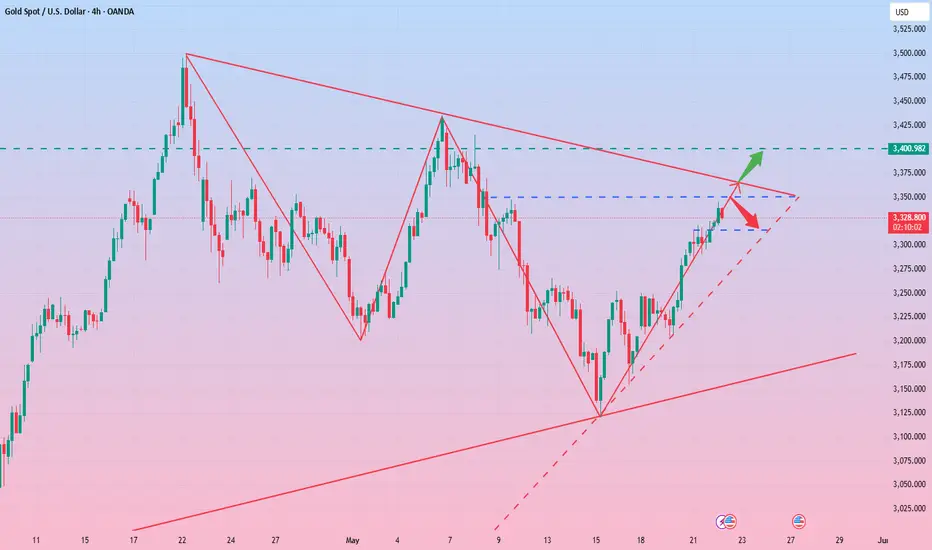
Gold Price Analysis May 22The recent consecutive bullish candles have brought gold close to ATH. With the current candlestick force, gold is still not strong enough to close above 3400 today and will still encounter some selling force creating a new half wave that can push it back above 3400
The immediate barrier zone is 3344 that the Asian session needs to pay attention to. If it does not break through at the end of the session, it is possible to SELL around this area, the target will not be long because the buying force is still strong according to the main trend. In case of breaking 3344, 3360 is the next price reaction zone for the European and American sessions. The resistance at 3395 will play a key role in preventing gold from a strong slide.
On the other hand, any retest is considered a good opportunity to buy. 3322 and 3290 are the targets of SELL orders and are also buying opportunities when there is confirmation of buying force around this area.

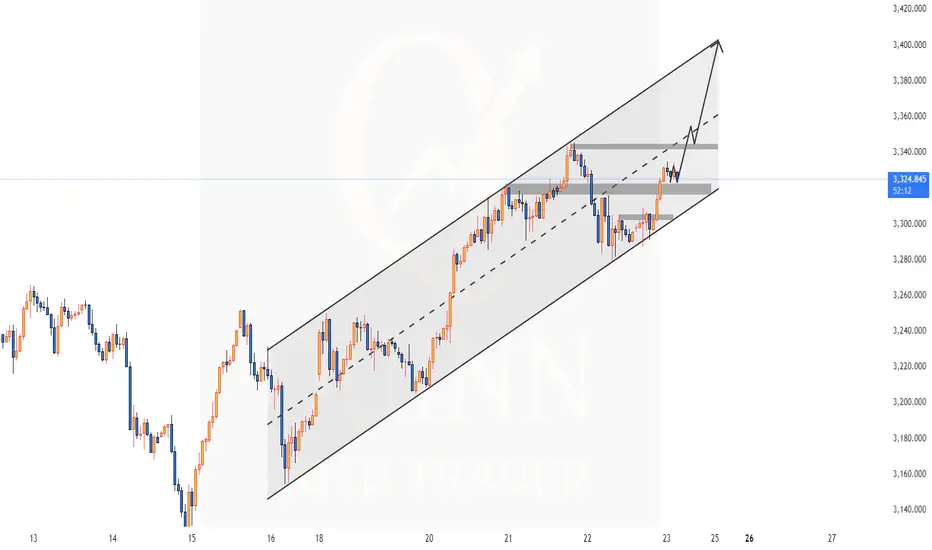
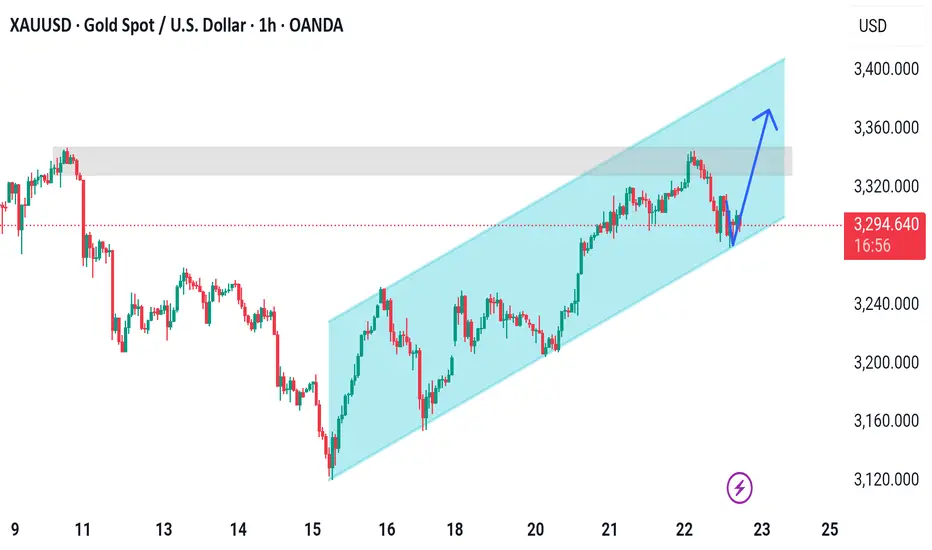
Xauusd Parallel Channel AheadTrend: The asset is in a clear short-term uptrend, staying within a rising channel.
Support Zone: Price is currently testing the lower channel support, a common place for bullish reversals if the channel remains intact.
Resistance Zone: There is a horizontal resistance area marked in gray around the $3,340–$3,360 range, which aligns with prior price reactions.
Potential Setup: If the price respects the trendline, a long position with a target near the upper channel line (around $3,370–$3,400) could be considered. A stop loss might be placed just below the channel to manage risk.
The gold trend takes a sharp turn, is a bear market coming?🗞News side:
1. PMI and initial jobless claims data
2. Geopolitical situation
3. Progress of the G7 meeting
📈Technical aspects:
During the Asian session, gold prices approached a two-week high. However, as the market digests the previous positive news and European and American economic data are about to be released intensively, gold's short-term trend faces uncertainty. The key data that everyone needs to pay attention to today include the May PMI data and the number of initial jobless claims in the United States. At the same time, the international trade situation, geopolitical dynamics, the progress of the G7 meeting and the speeches of Federal Reserve officials may have an impact on the market, so it is recommended that everyone keep a close eye on the impact of the news. Judging from the 4H market trend, the US market is paying attention to the short-term support around 3280-3275. Once it stabilizes above 3280, you can arrange to go long. On the contrary, once it falls below 3280-3275, it is possible to fall to the important support area of 3260-3250.
If you agree with this view, or have a better idea, please leave a message in the comment area. I look forward to hearing different voices.
OANDA:XAUUSD FX:XAUUSD TVC:GOLD FXOPEN:XAUUSD FOREXCOM:XAUUSD

Gold bulls push prices to around 3355
📌 Driving events
Gold prices rose more than 0.50% and held above the $3,300 mark, driven by renewed safe-haven demand and rising geopolitical tensions in the Middle East. As of writing, gold/USD is trading around $3,317, rebounding from an intraday low of $3,285.
Market sentiment remains fragile, with US stocks falling into negative territory and US Treasury yields slightly higher. All eyes are on the upcoming vote on President Trump's tax reform plan. According to estimates by the Congressional Budget Office (CBO), the plan could lead to an approximately $3.8 trillion expansion of the US national debt. Uncertainty about the fiscal outlook continues to stimulate demand for gold as a defensive asset.
📊Comment Analysis
Gold price recovery is good, pay attention to the 3358 price area, adjust downward, and continue to accumulate funds around 3300
💰Strategy Package
🔥Sell gold area: 3358-3360 SL 3365
TP1: $3350
TP2: $3337
TP3: $3322
🔥Buy gold area: $3284-$3276 SL $3270
TP1: $3300
TP2: $3320
TP3: $3340
⭐️ Note: Labaron hopes that traders can properly manage their funds
- Choose the number of lots that matches your funds
- Profit is 4-7% of the fund account
- Stop loss is 1-3% of the fund account
Seize the opportunity in the gold marketGold fell after reaching a high point during the day, reaching a high of 3345 before going out of the big drop space, and the evening star appeared in the 4H cycle. Combined with the correction of the top divergence of the indicator, the short-term will enter the adjustment stage. Pay attention to the middle track support around 3280-75 in the future market. If it does not break, you can consider going long. Pay attention to the upper pressure of 3320 and 3335. Keep the idea of shock in operation!
Operation suggestion: Go long on gold around 3280-3275, and look at 3300 and 3320. Go short if the rebound pressure of 3320 is not broken.

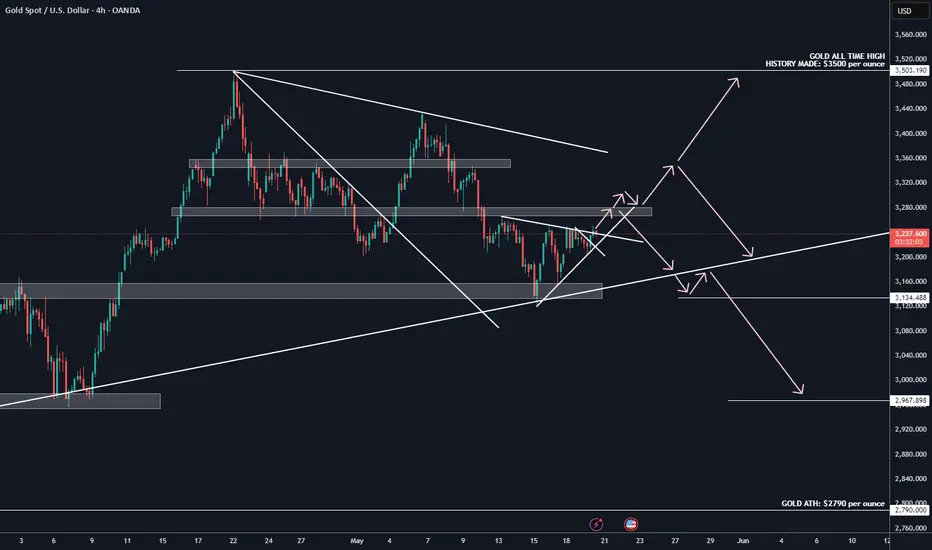
GOLD possible outcomesGold is now approaching 3275 area, which is probably the biggest make or break are right now
If we will see break, we gonna see some retest of previous resistance and we could see retest of ALL TIME HIGH again
If we hold this important 3275 area, we could see one more leg to the lower trendline (Daily TL) and possibly testing higher timeframe support of 3150 area... Possible retest of Daily trendline could lead us to even bigger decline all the way down to 2970 support area
Intraday volatility,there is still chance to go long on pullback🗞News side:
1. The situation in Israel escalates
2. Initial jobless claims data
📈Technical aspects:
Influenced by recent news, gold showed a volatile rebound trend. Gold continued to rise in the early Asian session, r OANDA:XAUUSD eaching a high of around 3345. The 3290-3300 level below has absolute support in the short term. As long as it does not fall below 3290, you can go long at 3290-3300. In the 4H cycle, the Bollinger opening and the moving average diverge upwards. The upward momentum is sufficient, and it is not easy to guess the top. Pay attention to the 3310-3300 line of support below, and pay attention to the suppression of the 3340-3350 area above. If the gold price stabilizes at 3350, it is expected to further explore the resistance of 3360-3370. If the European session falls into volatility, maintain the range of high selling and low buying, and consider going long when it retreats to the support level of 3320-3310.
If you agree with this view, or have a better idea, please leave a message in the comment area. I look forward to hearing different voices.
FOREXCOM:XAUUSD FXOPEN:XAUUSD TVC:GOLD FX:XAUUSD
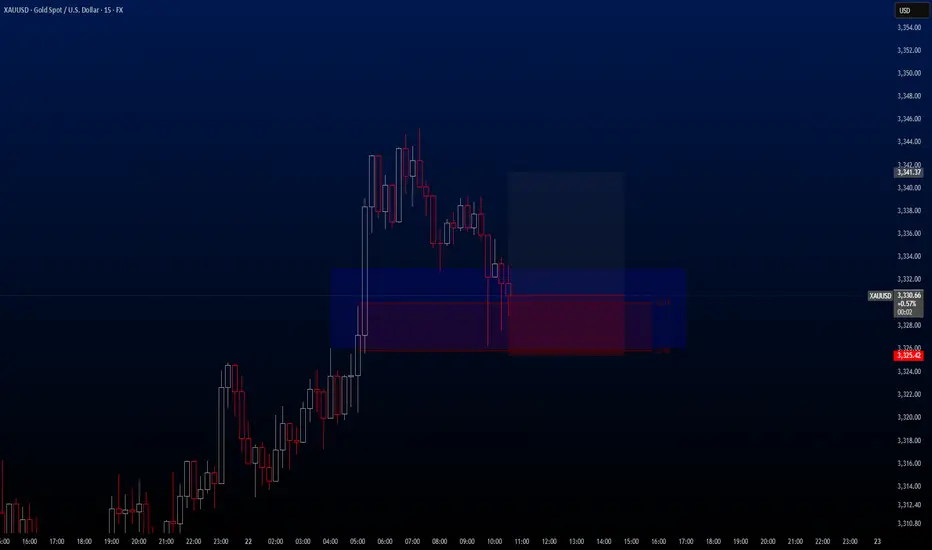
XAUUSD✅ Second Trade of the Day – XAUUSD
The second trade of the day comes from Gold (XAUUSD).
Just like BTC, gold has shown strong bullish momentum in recent days. I’m looking to take advantage of this minor pullback within the broader uptrend — a classic continuation setup on the 15-minute chart.
🔍 Trade Details:
✔️ Timeframe: 15-Minute
✔️ Risk-to-Reward Ratio: 1:2
✔️ Trade Direction: Buy
✔️ Entry Price: 3330.72
✔️ Take Profit: 3341.37
✔️ Stop Loss: 3325.42
🔔 Disclaimer: This is not financial advice. I'm simply sharing a trade I'm personally taking based on my own system, strictly for educational and illustrative purposes.
📌 If you're interested in a more systematic and data-driven trading approach:
💡 Follow the page and enable notifications to stay updated on future trade setups and advanced market insights.
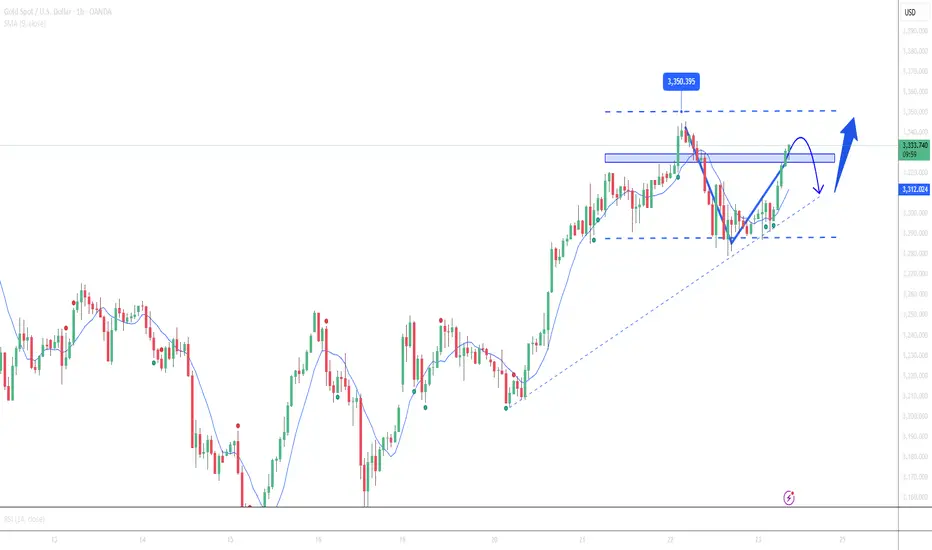
Gold Analysis One Hour Time Frame
One hour time frame I still expect an increase to hit the ceiling of the descending channel, even if it breaks this ceiling with a shadow... For today, the support areas and the important area of FVG, whose center is marked, are important support points that can be seen and triggered by Bayer to continue on the path.
Gold XAUUSD Intraday Move 21.05.2025Gold is currently trading within a well-respected ascending channel, approaching a significant resistance zone around 3315–3320, where previous supply caused a sharp sell-off. This resistance zone has been tested again and shows signs of rejection with consolidation and wicks to the upside.
If price fails to break above this resistance, we may see a corrective drop toward the 3285–3290 zone, which aligns with:
The channel midline
Previous minor structure support
A potential bullish order block/demand zone
This level present a high-probability buy opportunity within the bullish structure.
Preferred Scenario:
Wait for a retracement to 3285–3290 (buy zone)
If bullish price action forms (e.g., bullish engulfing, rejection wicks), enter long position
Trading Signal – Buy Setup
Buy Limit: 3287
Stop Loss: 3275 (below demand and channel)
TP1: 3315
TP2: 3335 (channel top)
Risk/Reward: ~1:2+
Alternative Bearish Scenario:
If price breaks below 3280 with momentum and closes below the ascending channel, avoid buying and reassess for a possible bearish trend shift.

The unilateral offensive is fierce: the bulls have clear goalsGold is performing strongly sideways. We are in the same rhythm as yesterday and continue to maintain bullishness. Gold broke through the key resistance of 3280 on Tuesday and then rose strongly. It is currently above the area near 3330. The technical side shows that the bullish trend continues. The next target may point to the high of 3400. After rising continuously on Monday and Tuesday, it slightly adjusted back to around 3285 on Wednesday and stabilized before rising again. The daily line closed positive and stood firmly on the middle track. The Bollinger band opened upward, and the upper track pressure was at 3400, suggesting that the medium-term upward space is open. The Bollinger band opened significantly, the moving average was arranged in a bullish pattern, and the upward momentum was strong. Short-term support focuses on the moving average at 3315. If the correction does not break this position, the trend long order can follow up. If the key resistance of 3350 is effectively broken, it will further open up the upward space.
Gold operation suggestions: continue to go long after stepping back to 3320-3315, with a target of 3350. If it rises to around 3350 without breaking, you can arrange short-term short orders, with a target of 3330.
XAUUSD Break & Retest | Buy-Side Continuation SetupGold (XAUUSD) has made a solid bullish comeback after bouncing off the demand zone at 3,317–3,319, where we saw a surge in buying interest following a quick liquidity sweep. This bounce not only confirms the demand but also lays the groundwork for a potential continuation of the upward trend.
Right now, the price action is breaking through some minor intraday structures, shifting the market sentiment back in favor of buyers. The move above 3,320 shows a clear bullish intent, aiming for the supply zone overhead around 3,325–3,328. This area represents the last major distribution before the previous sell-off, making it a key short-term resistance point.
From a structural perspective, this setup follows a classic demand-hold and supply-target strategy, backed by intraday momentum and a trendline breakout. As long as the price stays above 3,317, the bullish outlook remains intact.
The target area stretches toward 3,328 and 3,331, where we might see some profit-taking or new selling. If those levels are surpassed, we could see further gains into the 3,335–3,340 range.
🔍 Key Confluences:
Strong rejection from the previous support zone
Clear bullish structure (Higher Highs & Higher Lows on the 5-minute timeframe)
Momentum aligned with the Asia–London session overlap
Price trading above key EMAs (optional, if included)
🎯 Trade Plan Overview:
Entry: Breakout or retest at 3,319–3,320
Stop Loss: Below 3,317 (this would invalidate the demand)
Take Profit 1: 3,328
Take Profit 2: 3,331
Final Target (optional): 3,335+ (if the breakout continues)
📣 Bias:
Bullish — until demand is broken with strong volume.
