Gold Price Soars After Moody's US Downgrade: What's Next?Gold's Resurgence: A Deep Dive into the Moody's Downgrade and Market Tremors
The world of finance is a complex ecosystem, where a single event can trigger a cascade of reactions across global markets. Recently, such an event unfolded as Moody's Investors Service, one of the leading credit rating agencies, delivered a significant blow to the United States' financial standing by downgrading its sovereign credit rating. This unexpected move, occurring after a period of notable decline for gold, sent shockwaves through the financial landscape, prompting a sharp rally in the precious metal's price. In the early hours of Asian trading, gold surged by as much as 1.3%, reaching approximately $3,245 an ounce, a clear testament to its enduring appeal as a safe-haven asset in times of uncertainty.
The Catalyst: Moody's Downgrade and its Implications
Credit ratings are critical indicators of a borrower's ability to meet its debt obligations. For a sovereign nation, its credit rating influences borrowing costs, investor confidence, and its overall standing in the international financial community. Moody's decision to lower the U.S. sovereign credit rating by one notch, from the pristine Aaa to Aa1, was not taken lightly. The agency pointed to a confluence of persistent and concerning factors. Chief among these were the United States' chronic budget deficits, which have shown little sign of abatement despite various economic cycles. Moody's also highlighted a perceived erosion of political will and institutional strength to effectively address the nation's deteriorating fiscal trajectory. The growing burden of national debt and the escalating costs of servicing this debt were explicitly mentioned as significant concerns underpinning the downgrade.
This wasn't the first time the U.S. had faced a credit rating downgrade. In 2011, Standard & Poor's (S&P) stripped the U.S. of its top-tier AAA rating, a move that also sent tremors through global markets. The parallels are noteworthy, as both instances underscored deep-seated concerns about the sustainability of U.S. fiscal policy. A sovereign downgrade, particularly for an economy as pivotal as the United States, has far-reaching consequences. It can lead to higher borrowing costs for the government, potentially impacting everything from infrastructure spending to social programs. Furthermore, it can dent investor confidence, leading to capital outflows or a re-evaluation of risk associated with U.S. assets.
The immediate market reaction to Moody's announcement was a textbook flight to safety. The U.S. dollar, typically a beneficiary of global uncertainty, found itself under pressure. As the world's primary reserve currency, the dollar's value is intrinsically linked to the perceived strength and stability of the U.S. economy. A credit downgrade, by questioning that stability, naturally led to a weakening of the greenback. This weakening, in turn, provided a direct tailwind for gold. Gold is priced in U.S. dollars, so a cheaper dollar makes gold more affordable for investors holding other currencies, thereby stimulating demand.
Simultaneously, U.S. Treasury bonds, long considered one of the safest investments globally, experienced a sell-off. This might seem counterintuitive, as a flight to safety often includes government bonds. However, a credit downgrade directly impacts the perceived creditworthiness of those bonds. Investors demand a higher yield (return) to compensate for the increased perceived risk, leading to a drop in bond prices (yields and prices move inversely). The Treasury yield curve, which plots the yields of bonds with different maturities, steepened, indicating greater uncertainty about longer-term economic prospects and inflation. U.S. stock futures also registered declines, reflecting concerns that higher borrowing costs and diminished confidence could negatively impact corporate earnings and economic growth.
Gold: The Evergreen Safe Haven
Amidst this turmoil, gold shone brightly. Its rally was a classic demonstration of its role as a premier safe-haven asset. Throughout history, gold has been a store of value, a tangible asset that retains its worth when paper currencies or other financial instruments falter. Its appeal transcends economic cycles and geopolitical shifts. Unlike fiat currencies, which can be devalued by inflation or government policy, gold's supply is finite, giving it an intrinsic scarcity value.
In times of economic stress, such as those signaled by a sovereign credit downgrade, investors flock to gold for several reasons. Firstly, it acts as a hedge against currency depreciation. If the U.S. dollar weakens significantly, holding gold can preserve purchasing power. Secondly, gold is often seen as a hedge against inflation. If a government resorts to inflationary policies to manage its debt burden, the real value of money erodes, while gold tends to hold or increase its value. Thirdly, in periods of heightened geopolitical risk or systemic financial instability, gold provides a sense of security that other assets may not offer. It is a universally accepted medium of exchange and store of wealth, independent of any single government or financial institution.
The downgrade by Moody's amplified concerns about the U.S.'s fiscal health, a narrative that has been building for some time. Commentators pointed to over a decade of what they termed "fiscal profligacy," where successive administrations and Congresses have struggled to implement sustainable long-term solutions to the nation's growing debt. The phrase "ticking debt timebomb" resurfaced in financial commentary, underscoring the anxieties surrounding the long-term implications of current fiscal policies for the world's largest economy. These anxieties naturally fueled demand for gold as a protective measure. Adding another layer to these concerns were reports of a U.S. House panel approving proposed tax cuts, which, according to some economic analyses, could add trillions more to the national debt, further exacerbating the fiscal imbalance.
The Preceding Slump: A Market Breather
The vigorous rally in gold prices was particularly striking given its performance in the preceding week. The metal had been on a downward trajectory, poised for what was described as its steepest weekly decline in six months. This earlier weakness was primarily attributed to a strengthening U.S. dollar and an apparent easing of trade tensions between the United States and China. When geopolitical risks appear to subside and economic optimism grows, investors often rotate out of safe-haven assets like gold and into riskier assets, such as equities, in pursuit of higher returns. This is often referred to as a "risk-on" environment.
The announcement of a 90-day pause on tariffs between the U.S. and China had injected a dose of optimism into the markets. This temporary truce in the protracted trade war improved investor sentiment, reducing the perceived need for the kind of insurance that gold provides. Consequently, capital flowed towards assets perceived to benefit more directly from improved global trade and economic growth, leading to a pullback in gold prices. However, the Moody's downgrade swiftly reversed this trend, highlighting how quickly market sentiment can pivot in response to unexpected news.
Navigating a Complex Web of Global Influences
Gold's price is rarely determined by a single factor. It is subject to a complex interplay of global economic data, geopolitical developments, central bank policies, and investor sentiment. While the Moody's downgrade was the immediate catalyst for the recent rally, other elements continue to shape the landscape.
Ongoing geopolitical tensions in various parts of the world provide a persistent undercurrent of support for gold. Any escalation of conflicts or emergence of new geopolitical flashpoints can quickly send investors seeking refuge in the yellow metal. Furthermore, mixed economic data from major economies contributes to market volatility. For instance, softer-than-expected economic indicators from China, the world's second-largest economy, can dampen global growth expectations and influence risk appetite, which in turn affects gold.
Statements from key policymakers also carry significant weight. Comments from U.S. Treasury Secretary Scott Bessent regarding the potential reimposition of "Liberation Day" tariffs if trade negotiations with certain partners were not conducted in "good faith" served as a reminder that trade uncertainties remain. Such pronouncements can easily reignite concerns and support gold prices.
The Long-Term Horizon: Bullish Undertones Persist
Despite the short-term volatility, many analysts maintain a constructive long-term outlook for gold. Several underlying factors are expected to provide structural support for the precious metal in the coming years. One such factor is the potential for ongoing U.S. dollar weakness, driven by the country's twin deficits (budget and current account) and a gradual shift by some central banks to diversify their foreign exchange reserves away from an overwhelming reliance on the dollar. This diversification trend, if it continues, could provide a sustained tailwind for gold.
Moreover, the policies of major governments and central banks can also influence gold's trajectory. For example, periods of expansionary monetary policy, characterized by low interest rates and quantitative easing, can reduce the opportunity cost of holding gold (which yields no income) and potentially lead to inflationary pressures, both of which are typically gold-positive.
It's important to note that gold had already demonstrated strong performance in 2025, even before this latest surge. Year-to-date, the metal had appreciated significantly, reportedly by around 23%, and had even briefly surpassed the $3,500 an ounce mark for the first time in history during April. This underlying strength suggests that broader market forces were already favoring gold.
Major financial institutions have also echoed this optimistic long-term view. JPMorgan, for instance, has projected that gold could average $3,675 an ounce by the end of the year, with a potential to reach $4,000 before the close of 2026. Similarly, Goldman Sachs maintained its forecast of $3,700 by year-end and a $4,000 target by mid-2026. These forecasts often consider a range of scenarios, including the path of Federal Reserve interest rate policy and the likelihood of a U.S. recession. Even with expectations of delayed Fed rate cuts and a potentially lower U.S. recession risk, these institutions see considerable upside for gold.
Investor Strategy in a Shifting Landscape
For investors, the recent events serve as a potent reminder of gold's role in a diversified portfolio. While gold can be volatile in the short term, its ability to act as a hedge against various risks makes it a valuable component for long-term wealth preservation. The Moody's downgrade and the subsequent market reaction underscore the importance of not being complacent about sovereign risk, even in developed economies.
Retail investors might consider gold through various avenues, including physical bullion (coins and bars), gold exchange-traded funds (ETFs) that track the gold price, or shares in gold mining companies. Institutional investors, such as pension funds and endowments, often allocate a portion of their portfolios to gold as a strategic hedge and a diversifier.
The key is to view gold not as a speculative tool for quick profits, but as a long-term strategic holding that can provide stability and protection during periods of economic or geopolitical stress. The optimal allocation to gold will vary depending on an individual's risk tolerance, investment goals, and overall market outlook.
Conclusion: Gold's Enduring Relevance
The sharp rebound in gold prices following Moody's downgrade of the U.S. credit rating is a multifaceted event with significant implications. It highlights gold's unwavering status as a safe-haven asset, its sensitivity to shifts in U.S. dollar valuation, and the profound impact of sovereign creditworthiness on global financial markets. The downgrade served as a stark reminder of the underlying fiscal challenges confronting the United States and their potential to create ripples of uncertainty that benefit traditional stores of value.
Looking ahead, investors and market observers will be keenly focused on upcoming U.S. economic data, pronouncements from the Federal Reserve regarding monetary policy, and the evolving geopolitical landscape. While short-term fluctuations are inevitable, the fundamental factors that have historically supported gold – its role as an inflation hedge, a currency hedge, and a crisis commodity – remain firmly in place. As the global economic and political environment continues to navigate complex challenges, gold is likely to retain its allure as a critical component of a well-diversified investment strategy, a timeless guardian of wealth in an ever-changing world. The recent bounce may be more than just a fleeting reaction; it could be a reaffirmation of gold's enduring value proposition in an era of increasing uncertainty.
Goldlong
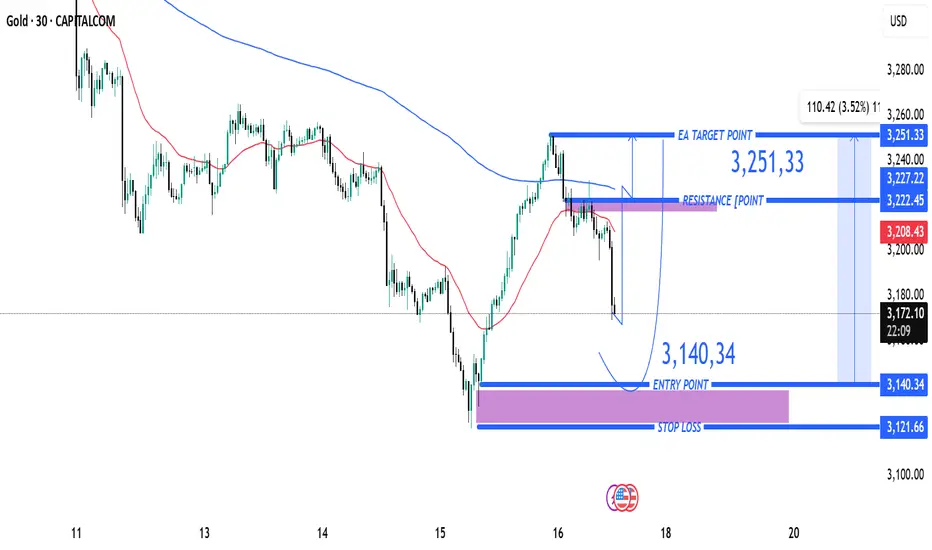
(XAU/USD) Buy Trade Setup – Entry, Target & Risk Management PlaEntry Point:
3,140.34 USD
This is the suggested level to enter a long (buy) trade.
Stop Loss (SL):
3,121.66 USD
A protective level to limit losses if the trade goes against the setup.
Target Point (Take Profit - TP):
3,251.33 USD
This is the EA target point — where profits are expected to be taken.
---
3. Risk/Reward Ratio:
Risk: From 3,140.34 to 3,121.66 = 18.68 points
Reward: From 3,140.34 to 3,251.33 = 110.99 points
Risk/Reward Ratio ≈ 1:6, which is very favorable.
4. Resistance Point:
Around 3,222.45 - 3,227.27
This area might act as a challenge for price movement, potentially leading to temporary retracements.
5. Indicators:
Moving Averages: Red (shorter period) and Blue (longer period) lines help indicate trends.
The price is moving above the short-term MA but currently under the long-term MA, which might suggest a short-term bullish move within a broader downtrend or sideways range.
Conclusion:
This is a bullish setup, anticipating a reversal or continuation to the upside after a pullback:
Buy Zone: 3,140.34
Stop Loss: 3,121.66
Take Profit: 3,251.33
If the price drops to the entry point zone
3235 line becomes short-term resistance? Golden layout at night!🗞News side:
1. Trump's dialogue with Russia and Ukraine on ceasefire
2. The seriousness of the situation in Israel
📈Technical aspects:
In the short term, the three key factors affecting the gold market are the certainty of tariff policies, geopolitical risks, and the pace of the Fed's interest rate cuts. The Russian-Ukrainian conflict is a tail risk that deserves attention. Its impact on the global order far exceeds other geopolitical conflicts. It is expected that the conflict may see a key turning point in May and June, and the Fed's interest rate cut is likely to be implemented in the third quarter. At that time, the gold and silver markets may face greater negative pressure, and prices may fall back to 3000-2800 or even lower. Technically, the double top pattern at the daily level has been established. Although there is a certain resistance at the 3235 line of gold in the short term, considering the tail risk, the possibility of evolving into a triple top cannot be ruled out, and we need to be vigilant against the inducement of multi-money rises and washes.
🎁BUY 3220-3215
🎁TP 3230-3240
🎁SELL 3250-3255
🎁TP 3235-3225
If you agree with this view, or have a better idea, please leave a message in the comment area. I look forward to hearing different voices.
OANDA:XAUUSD FX:XAUUSD TVC:GOLD FXOPEN:XAUUSD FOREXCOM:XAUUSD

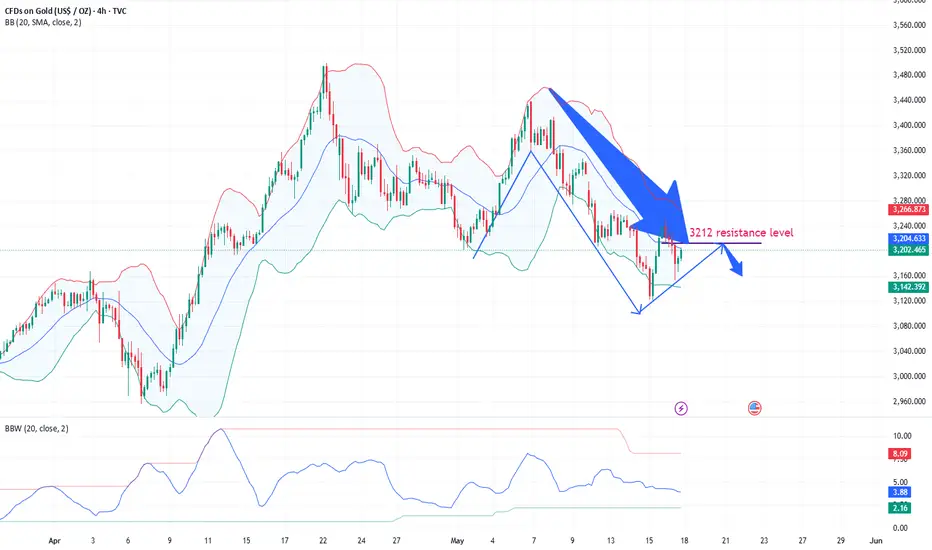
Beware of a sharp surge at the beginning of the week!🗞News side:
1. The India-Pakistan conflict has been eased, but India has increased its troops in Kashmir
2. The situation between Russia and Ukraine has escalated again
3. Trump has asked Walmart to absorb the impact of tariffs on its own
📈Technical aspects:
Gold jumped higher in the Asian session in the morning and once tested the 3250 resistance line. In the short term, the upward space is limited and there is a certain suppression. At present, gold is testing the 3210-3200 support level again. Judging from the 4H chart, if the gold price breaks through this short-term support level, it is likely to go to the 3170 level next, or even test the strong support level of 3150. If it gets effective support at 3210-3200, gold may test the resistance area again. Therefore, in the short-term trading in the Asia and Europe sessions, maintain the high-level short-selling and low-level long-selling cycle to participate. On the upside, focus on the 3250-3260 resistance area. If it breaks through, it is expected to look towards the 3300 line. On the downside, focus on the 3210-3200 support line. If it breaks through this support, look to the 3170-3150 important support.
If you agree with this view, or have a better idea, please leave a message in the comment area. I look forward to hearing different voices.
FOREXCOM:XAUUSD FXOPEN:XAUUSD TVC:GOLD FX:XAUUSD OANDA:XAUUSD

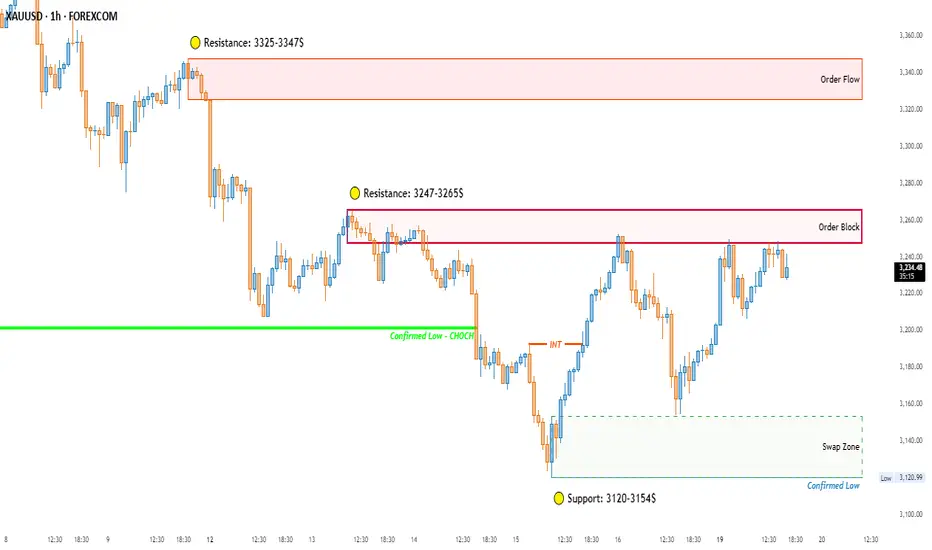
GOLD(1H)📌 Gold Analysis (XAU/USD) - Key 1H Levels
🔍 Critical Zones:
▫️ Resistance: $3265
▫️ Support: $3120
▫️ Trend: Short-term bullish above $3120
⚡️ Trading Plan:
• Entry Zone: $3120-$3155
• Target: $3325 | SL: $3120
• Risk: Max 1% capital
💬 Engagement:
"Which scenario do you think is more likely?
1) Break above $3348
2) Rejection from $3320
Comment your answer! ↓"
It’s the right time to shortUS President Trump recently criticized Fed Chairman Powell again, calling him "slow to act" and emphasizing that the Fed should cut interest rates as soon as possible to support the economy. Trump believes that delaying interest rate cuts may lead to the risk of recession in the US economy, but the Fed still takes inflation and employment data as the core of decision-making, and the two sides have obvious differences in policy positions.
At present, the Fed's interest rate cut expectations have been postponed and the magnitude has been reduced. Coupled with the expectation of rising US bond yields, the gold market sentiment has weakened. The world's largest gold ETF recently reduced its holdings by 8.98 tons to 918.73 tons, reflecting the cooling of institutions' short-term bullish enthusiasm for gold. Technically, gold prices continued to weaken after breaking through key support last week, and the weekly closing was negative, suggesting that shorts were dominant; the daily level was constrained by the 20-day moving average, and the volatile downward trend may continue in the short term. Focus on the 3250-3265 line resistance during the day. If it cannot break through, the $3,200 mark below may face a test.
Gold recommendation: short sell when it rebounds to 3245-3252 range. Target 3230-3220.

The current price of gold is 3230, so go short directly!
Gold began to fluctuate in a large range. Don't chase long positions easily at high levels. Gold opened under pressure and fell back at 2350. Then the double top of gold rebounded in 4 hours and continued to fall, and then fluctuated in a large range. The current price of gold is 3230 and it is directly short!
Gold did not form an upward breakthrough in 4 hours, so it is likely to be a volatile market. Since gold is fluctuating, if gold falls below 3200 again, it may weaken further. Then gold will start to fluctuate in a large range in 4 hours. Gold rebounded under pressure and went short first.
The market is changing rapidly, and gold is now experiencing great ups and downs. In the short term, we still need to pay attention to continued highs and falls. Gold should focus on the gains and losses of the 3200 line. If gold does not break 3200 for a long time, then gold may form support, and then gold bulls will have upward momentum.
European trading operation ideas:
Gold short at 3230, stop loss at 3240, target 3200-3180;

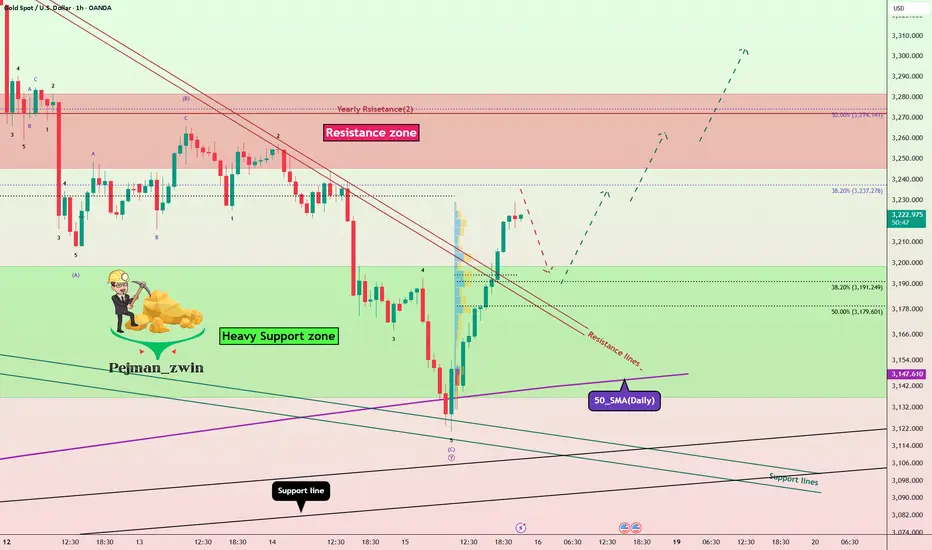
Bullish Inflation Data Fuels Gold Rebound — Impulsive Waves!?Gold ( OANDA:XAUUSD ) started to fall from the Resistance zone($3,280-$3,245) as I expected in the previous idea , but 50_SMA(Daily) and Support lines were able to hold Gold .
----------------------------------
Today, key U.S. economic data was released:
Core PPI m/m: -0.4% (vs. 0.3% forecast)
Core Retail Sales m/m: 0.1% (vs. 0.3% expected)
PPI m/m: -0.5% (vs. 0.2% forecast)
Retail Sales m/m: 0.1% (in line)
Unemployment Claims: 229K (as expected)
Outlook :
The weaker-than-expected inflation data, especially the PPI figures, indicate easing inflationary pressures. This may increase expectations for potential Fed rate cuts, which generally supports gold as a non-yielding asset.
Conclusion :
Today’s data is overall bullish for gold. Watch for continued upside if sentiment shifts further toward dovish Fed expectations. However, keep an eye on upcoming Fed commentary for confirmation.
----------------------------------
Gold is moving above the Heavy Support zone($3,200-$3,136) and has managed to break the Resistance lines .
In terms of Elliott Wave theory , Gold seems to have completed the corrective waves , and we can expect the start of an impulsive wave . Breaking the Resistance zone($3,280-$3,245) can be a good sign for the start of an impulsive wave and a gold pump .
I expect Gold to start rising again after a pullback to the Resistance lines(broken) , probably from the Fibonacci Levels inside the chart , and attack the Resistance zone($3,280-$3,245) .
Note: If Gold touches $3,154 , we can expect more dumps.
Gold Analyze ( XAUUSD ), 1-hour time frame.
Be sure to follow the updated ideas.
Do not forget to put a Stop loss for your positions (For every position you want to open).
Please follow your strategy; this is just my idea, and I will gladly see your ideas in this post.
Please do not forget the ✅' like '✅ button 🙏😊 & Share it with your friends; thanks, and Trade safe.
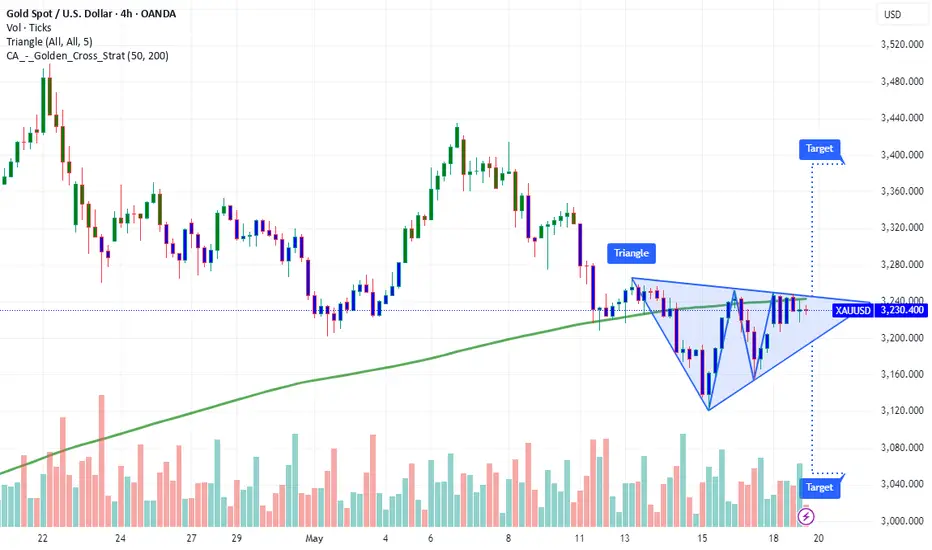
XAU/USD 4H Chart Analysis – Wave 5 Setup in PlayHey traders! Just wanted to share this clean Elliott Wave setup I’m tracking on Gold (XAU/USD).
We’ve just completed what looks like a textbook Wave (4) correction, finding support right at the lower boundary of this long-term ascending channel. Price also respected the 38.2% Fibonacci retracement perfectly, lining up around the $3,090 level. That level is acting as a key demand zone right now.
🌀 According to the wave count:
Wave (3) topped out near $3,500
Wave (4) retraced sharply into the channel base
We are now potentially at the launch point for Wave (5) — the final impulse leg
💹 Wave (5) Projection:
Targeting the upper channel boundary, which aligns closely with $3,740–$3,750
This area also completes the measured move and matches key structural confluence
📈 Technical Confluence Supporting the Bullish Bias:
RSI bounced cleanly from oversold territory
Bullish EMA crossover (20/50) is happening right near the bounce zone
We’re also seeing a break of the corrective trend line, suggesting momentum is shifting back in favor of the bulls
📍 Key Levels to Watch:
$3,149: minor pullback area / possible retest
$3,283: Fib 23.6% resistance — needs to be cleared for confirmation
$3,500: Major resistance & previous high — breakout zone
$3,747: Wave 5 target
⚠️ Invalidation Zone:
If price breaks below $3,090, and especially $3,041, I’ll be reassessing the wave count. That would suggest a deeper Wave 4 or a breakdown in bullish structure.
📌 Conclusion:
I’m watching this setup closely. Gold looks poised for a strong upside leg if current levels hold. The structure is clean, momentum is turning, and we’ve got multiple confirmations in place. I’ll be scaling in with proper risk management and looking to ride this potential Wave 5 to new highs.
Drop your thoughts below — are you long on Gold? Let’s talk setups 👇
@WrightWayInvestments
@WrightWayInvestments
@WrightWayInvestments

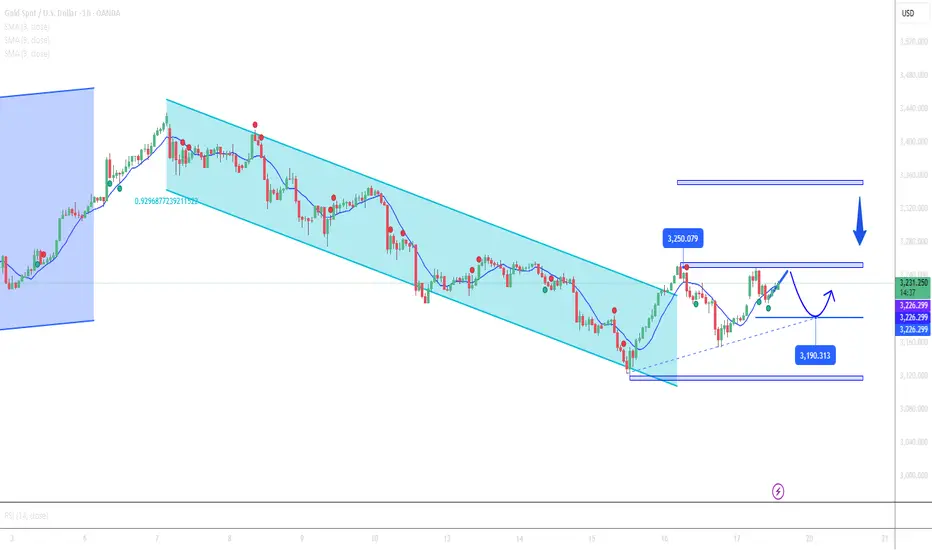
Gold price outlook: short term increase📝 NEWS
Gold Prices Rise as Moody’s Downgrades U.S. Credit Rating
- Moody’s downgraded the U.S. credit rating from Aaa to Aa1, citing concerns over high public debt and unsustainable fiscal spending.
- The move boosted demand for safe-haven assets, leading to a weaker U.S. dollar and rising U.S. Treasury yields.
- Spot gold prices rose 0.5% to $3,217.49/oz, while June gold futures gained 1% to $3,220.17/oz.
- Other precious metals also saw modest gains:
- Silver +0.5% to $32.530/oz
- Platinum +0.1% to $991.50/oz
Market Outlook
- In the coming week, the market will closely watch a busy U.S. economic calendar, including:
- Speeches from Federal Reserve officials
- Preliminary PMI data
- Key housing indicators
- These events are expected to influence short-term monetary policy expectations.
Technical View: Gold Poised to Continue Rising
⚠️ Gold is expected to continue its upward trend amid rising trade tensions between the U.S. and China, with little progress in ongoing tariff negotiations.
💡 Short-Term Trade Scenarios:
🚨 SELL XAU : zone 3247-3250
SL: 3255
TP: 50 - 100 - 300pips
🚨 BUY XAU : zone 3188-3191
SL: 3183
TP: 50 - 100 - 300pips
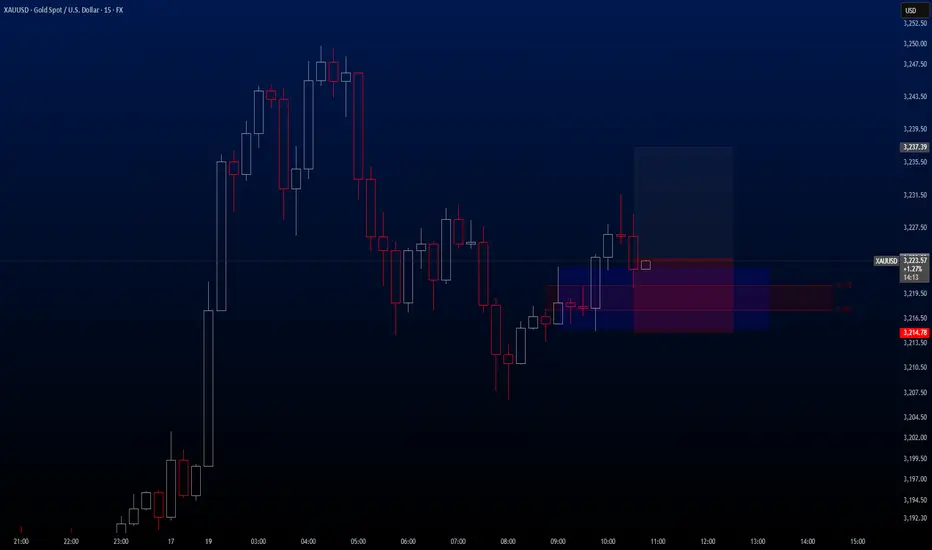
XAUUSDHello traders!
I’m sharing what may be your first trade of the week. This setup comes from the XAUUSD pair. I currently see a Buy opportunity in Gold, and the trade is already active on my side.
🔍 Trade Details:
✔️ Timeframe: 15-Minute
✔️ Risk-to-Reward Ratio: 1:1.50
✔️ Trade Direction: Buy
✔️ Entry Price: 3223.82
✔️ Take Profit: 3237.39
✔️ Stop Loss: 3214.78
🔔 Disclaimer: This is not financial advice. I’m simply sharing a trade I’m personally taking, based on my own methodology. It is intended purely for educational purposes.
📌 If you're interested in a more systematic and data-driven approach to trading:
💡 Follow the page and turn on notifications to stay updated with future trade ideas and market breakdowns.
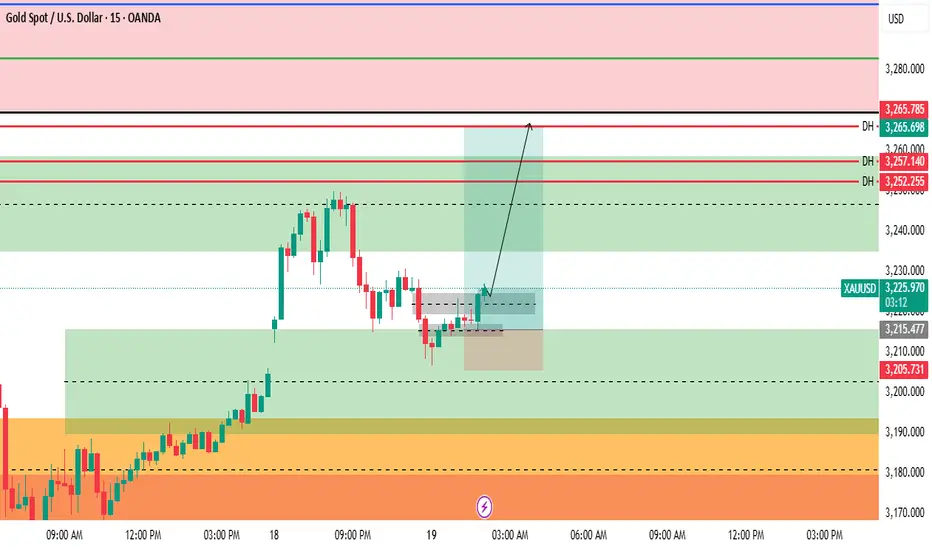
Gold Urgent Update.Gold Urgent Update
Gold has recently touched its 4-hour bullish Fair Value Gap (FVG) and is now moving upward. Additionally, there is existing liquidity from previous days positioned above the current price level, which further increases the probability of a continued bullish move.
There is a high likelihood that the market could rise towards the price levels of 3250, 3260, and possibly even 3265. These levels should be closely monitored, as they represent potential short-term targets based on the current price action and market structure.
At this stage, it is advised to avoid entering any selling (short) positions unless a clear and confirmed bearish signal is observed. The market sentiment remains decisively bullish, and until any bearish reversal patterns are confirmed, the upward trend should be respected.
Please conduct your own research (DYOR) and practice proper risk management when trading towards the mentioned target levels.
How to layout in the battle between long and short positionsGold surged directly at the opening, which is in line with our analysis expectations. We gave a short position near 3240-45. As expected, gold fell to the 3230 line for profit. There is great pressure from above and limited space above. Up to now, it has been fluctuating near 3220. For gold, we are now focusing on the short-term support of 3200-06. If it breaks through this position, it is very likely to go to the 3175-90 line.
From the current trend analysis, today's support continues to focus on 3170-80, strong support 3150, and upper pressure 3253-60. Relying on this range as a whole, the main tone of high-altitude low-multiple cycle participation remains unchanged. In the middle position, you must watch more and move less, be cautious in chasing orders, and wait patiently for key points to enter the market. I will notify you of the specific operation strategy in time and pay attention to it in time.
Gold operation strategy: short gold rebound near 3240-50, target 3230-3220. Pay attention to the support of 3202 and 3175 below, and go long according to the strength of the decline!
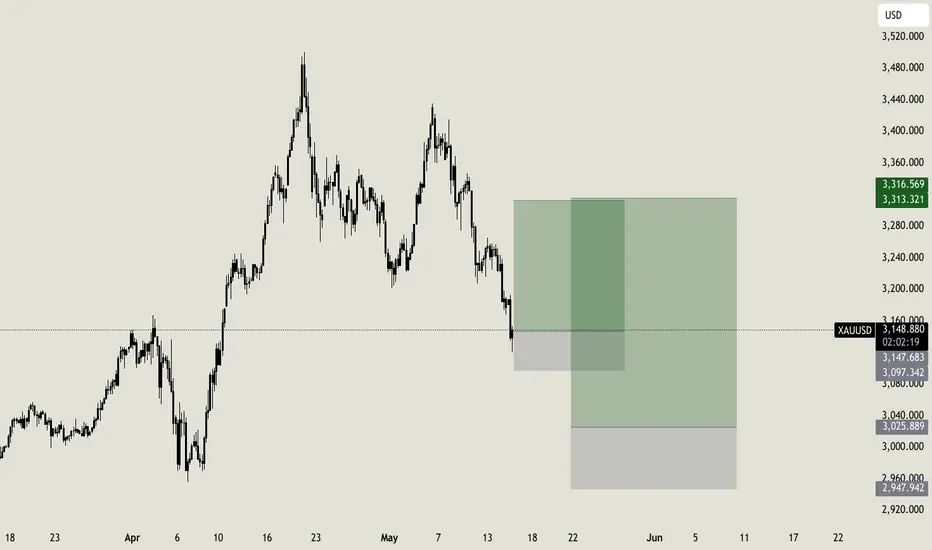
GOLD: Action Level!Gold is actually approaching an interesting action level. We can expect a bounce here, targeting 3310, otherwise i have placed a long limit order in a second support level (3027), with the same target.
This are mid term trades that i expect to hold for few days. My main trades are scalps on 5 minutes timeframe, that can't be posted here.
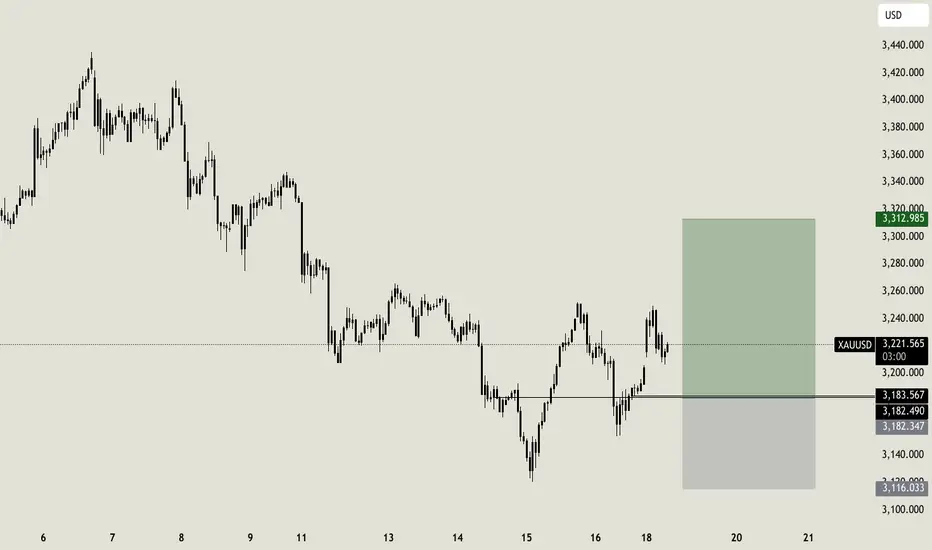
GOLD Weekly OutlookGood Morning Guys, here we are with XAU again. My previous long trade reached a good amount of profits so i closed it last Friday before market close, and i am now looking for a good re entry. I identified a good bounce level at $3185.00. I placed here a long limit order, that i hope will be triggered before Wednesday. My stoploss is easy here, just below local bottom, targeting $3310.00
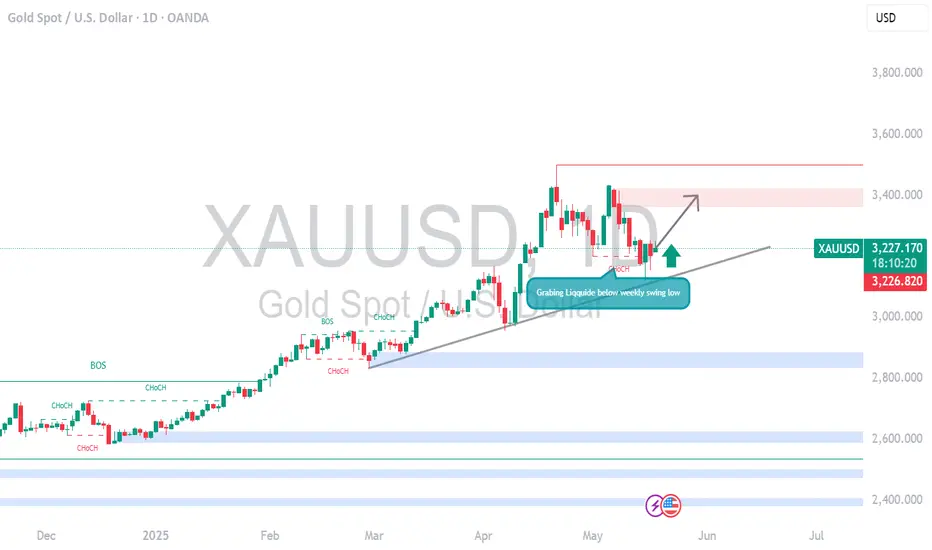
XAUUSD GOLD Just Grabbed liquidity Below a key low analysis Full Guide: How to Use COT Data for Trading XAUUSD (Gold)
1. What is COT Data?
The Commitment of Traders (COT) report is a weekly publication by the Commodity Futures Trading Commission (CFTC). It shows the aggregate positioning of different types of traders in the futures markets.
For XAUUSD (Gold), you’ll look at the Gold futures (COMEX) section.
2. Key Trader Categories in COT Report
1. Commercials (Hedgers):
Typically big institutions or producers like mining companies.
They use futures to hedge exposure, not speculate.
Usually short during rallies and long when price is low.
2. Non-Commercials (Large Speculators):
Hedge funds, money managers.
Considered the "smart money." Full Guide: How to Use COT Data for Trading XAUUSD (Gold)
1. What is COT Data?
The Commitment of Traders (COT) report is a weekly publication by the Commodity Futures Trading Commission (CFTC). It shows the aggregate positioning of different types of traders in the futures markets.
For XAUUSD (Gold), you’ll look at the Gold futures (COMEX) section.
---
2. Key Trader Categories in COT Report
1. Commercials (Hedgers):
Typically big institutions or producers like mining companies.
They use futures to hedge exposure, not speculate.
Usually short during rallies and long when price is low.
2. Non-Commercials (Large Speculators):
Hedge funds, money managers.
Considered the "smart money."
Follow trends and often drive major moves.
3. Nonreportables (Retail/Small Traders):
Smaller traders, often contrarian indicators.
Not always consistent with price direction.
---
3. Where to Find COT Data
CFTC Website
Tools like:
Tradingster.com
BarChart.com
COTbase.com
Look for "Legacy" or "Disaggregated" COT reports for Gold - COMEX.
---
4. How to Read the COT Data for Gold
Key Metrics:
Longs/Shorts: Number of contracts held.
Net Positions: Longs minus Shorts.Changes WoW: Increase/decrease in positions compared to the prior week.
Example Insight:
If Non-Commercials are heavily net long, and reaching historical highs, market may be overbought.
If Commercials increase shorts significantly, they may be preparing for a price decline.
A divergence between price action and COT data often signals potential reversal.
---
5. Using COT for Gold Trading (XAUUSD)A. Trend Confirmation
Rising net long positions by non-commercials = bullish confirmation.
Decreasing net long or rising shorts = weakening trend or reversal.
B. Reversal Spotting
Extremes in positioning (e.g., record longs by speculators) often precede reversals.
Look for non-commercials reducing longs while commercials increase shorts—potential top.
C. Liquidity Grabs and COT
If gold grabs liquidity (stop hunts) and COT shows heavy speculative positioning, that could be a smart money trap.
A strong bullish reversal after liquidity grab with increasing net longs confirms a momentum shift.
---
6. How to Combine COT with Technical Analysis
Use COT to validate or question what you see on the chart.
Example Setup:
Chart: Gold drops below key support (liquidity grab).
COT: Non-commercials increase longs that week.
Conclusion: Smart money bought the dip — potential for bullish reversal.
Combine with:
Market structure
Volume
Sentiment tools
Price action (e.g., bullish engulfing, break of structure)
---
7. Limitations and Tips
Lagging Data: COT is released every Friday for data on Tuesday.
Use it for context and macro positioning, not for intraday trades.
Look at weekly or monthly trends, not daily.
Best used alongside price action and other confirmation signals.
---
Conclusion
COT data is a powerful tool for understanding who is behind the move in gold. By tracking the positioning of major players, you can:
Confirm trends
Spot early signs of reversal
Align your trades with institutional momentum
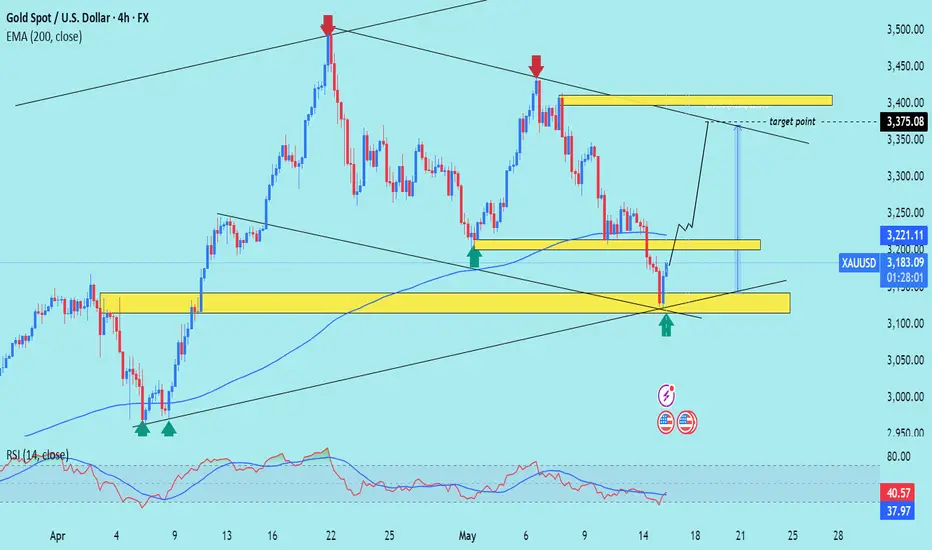
XAU/USD) back up Trand analysis Read The ChaptianSMC Trading point update
Technical analysis for XAU/USD (Gold vs. US Dollar) on the 4-hour timeframe suggests a bullish reversal setup from a key support zone. Here's a breakdown of the idea:
Key Observations:
1. Support Zone (Yellow Box at ~3,100–3,140):
The price recently touched a significant support area marked by multiple previous bounces (green arrows).
The latest green arrow shows a bullish reaction from this zone, indicating potential for an upward move.
2. Resistance Zone (~3,220–3,250):
This intermediate zone is expected to be the first area of interest for bulls.
The analysis suggests a brief pullback or consolidation before continuation.
3. Target Point (~3,375):
The chart outlines a projected move to around 3,375, aligning with a previous supply zone and the upper channel line.
This is likely the main target for a swing trade.
4. EMA 200 (Blue Line - ~3,221):
Price is hovering around the 200 EMA, acting as a dynamic resistance.
A breakout above this would add bullish confirmation.
5. RSI Indicator (~41):
RSI is recovering from an oversold region (~38), indicating potential momentum building for a reversal.
Mr SMC Trading point
---
Conclusion:
This is a bullish reversal setup with:
Entry zone: Around 3,120–3,140
Short-term resistance: ~3,220–3,250
Final target: ~3,375
Invalidation: A clear break and close below the yellow support box (~3,100)
Pales support boost 🚀 analysis follow)
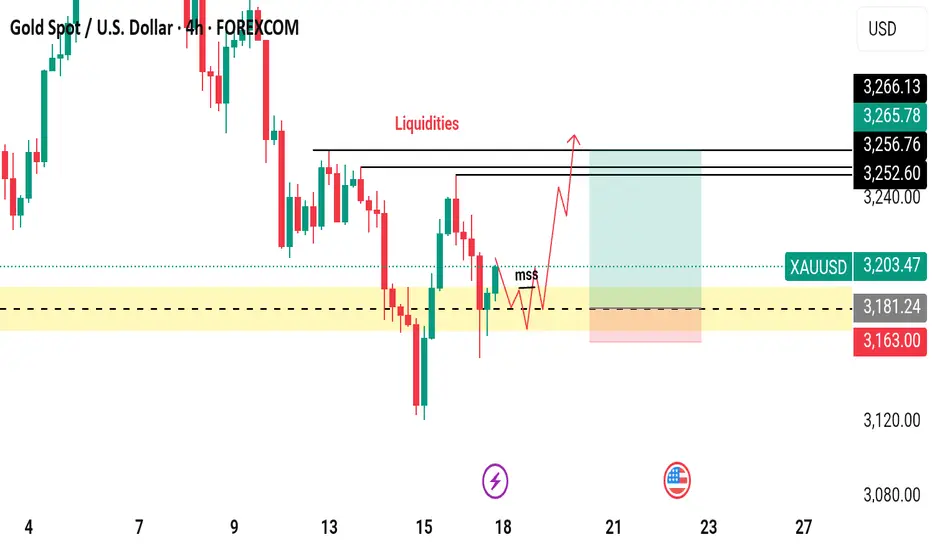
GOLD Has Shown A Significant Bullish Move!!Gold Market Analysis
Over the past week, gold has shown a significant bullish move by touching its weekly bullish Fair Value Gap (FVG) and closing a candle above it. This price action serves as a strong indication that the market is currently exhibiting bullish momentum. However, it is important to note that the sustainability of this bullish trend will be confirmed only through future market developments and price behavior.
As of now, our analysis suggests that gold, after revisiting and respecting the weekly bullish FVG, is trending upward. Looking ahead, we anticipate a minor retracement in the short term. This pullback could provide a healthy opportunity for the market to gather momentum before making another move upward. Ideally, we expect the price to retrace slightly and re-enter the highlighted yellow zone. Within this zone, we will be watching for a Market Structure Shift (MSS), which would act as our confirmation signal to consider entering a long position.
Once confirmation is received through MSS or similar price action cues, our strategy would be to target the liquidity zones situated above the current price level. It is also worth mentioning that the market has already cleared liquidity on the sell-side, which further strengthens the bullish case. Based on current technical indications and liquidity structure, there is a high probability that gold could reach as high as $3,250 in the upcoming sessions.
That said, market conditions can evolve rapidly, and it is essential to monitor price action closely. Traders and investors are strongly advised to conduct their own research (DYOR) and await clear confirmations before making any trading decisions. Staying vigilant and informed will be key to capitalizing on potential bullish movements in the gold market.
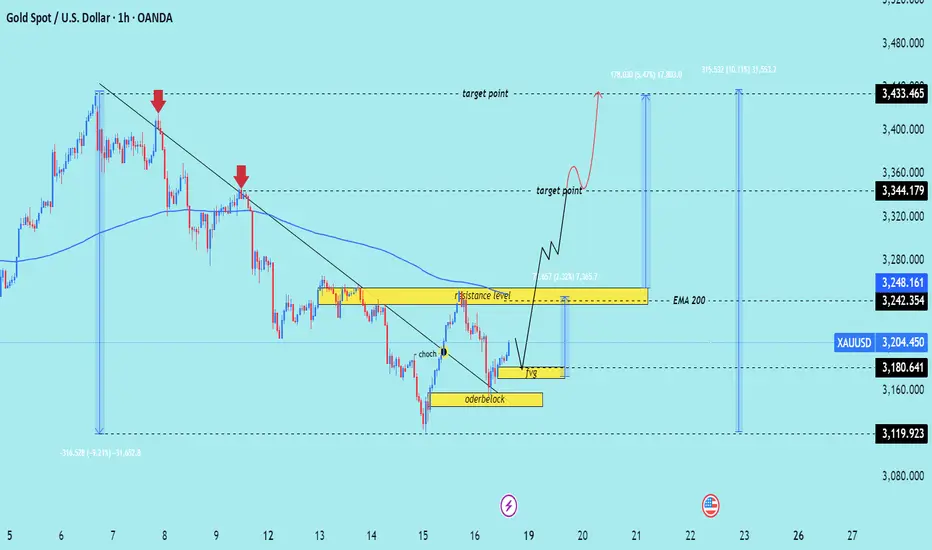
XAU/USD) bullish trend analysis Read The ChaptianSMC trading point update
Technical analysis of XAU/USD (Gold Spot price against USD) on a 1-hour timeframe, featuring a Smart Money Concept (SMC) approach. Here's a breakdown of the key ideas presented:
---
1. Downtrend & Trendline Break
The chart initially shows a downtrend with two red arrows marking lower highs.
A trendline is broken, indicating a potential shift in market structure.
CHOCH (Change of Character) is labeled — a key SMC concept signaling a reversal from bearish to bullish structure.
---
2. Orderblock & FVG (Fair Value Gap)
A bullish orderblock is highlighted, indicating an area where institutional buying may have occurred.
A Fair Value Gap (FVG) is shown, which often acts as a magnet for price to fill inefficiencies before continuing in the intended direction.
---
3. Resistance & Target Zones
A resistance level is marked near 3248–3250, which price may revisit and possibly break.
Two target points are identified:
First target: ~3344
Final target: ~3433
---
4. EMA 200
The EMA 200 is acting as dynamic resistance; a break above it adds confluence to the bullish bias.
---
5. Expected Move
The analysis anticipates:
1. A pullback into the FVG or orderblock.
2. A bullish continuation after mitigating those zones.
3. Price aiming for the resistance and eventually the upper targets.
Mr SMC Trading point
---
Conclusion
This is a bullish outlook based on a structural break (CHOCH), institutional demand (orderblock), and gap-filling logic (FVG). The price is expected to pull back slightly and then rally toward the 3344 and 3433 levels if it holds the orderblock zone.
Pales support boost 🚀 analysis follow)
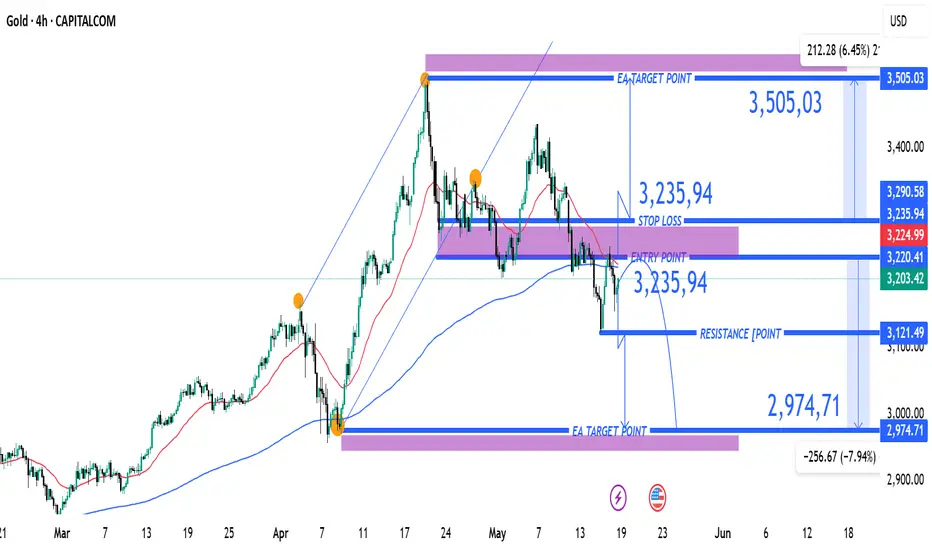
XAUUSD Bearish Setup with Key Entry, Stop Loss & Target LevelsEA GOLD MAN XAUUSD
Entry Point: $3,235.94
Stop Loss: $3,235.94 (above current price, suggesting a SELL trade)
Target Points:
EA Target Point (Downside): $2,974.71 (Short target)
EA Target Point (Upside): $3,505.03 (Long target — likely alternate scenario)
Resistance Level: $3,121.49
Nearby Support Zone: Around $3,000–$2,975
📉 Trade Strategy Implied
This appears to be a short position setup:
Sell at: ~$3,220–$3,235
Stop Loss: $3,235.94
Take Profit: $2,974.71
Risk/Reward Ratio: ~1:3 (very favorable setup if thesis holds)
The upside target ($3,505.03) might be for a different scenario — if price reverses and breaks above resistance.
🧠 Market Structure Observations
Trend: A bearish break from a previous ascending channel.
Momentum: Price has bounced slightly after hitting support, but the moving averages suggest bearish momentum may persist.
Key Risk: If price breaks above $3,236 convincingly, it could invalidate the short setup and trigger a bullish run.
📌 Summary
Bias: Bearish (based on current setup)
Setup: Short with tight stop above resistance
Confirmation Needed: Watch for rejection at the $3,220–$3,236 zone and a breakdown below $3,200 for follow-through.
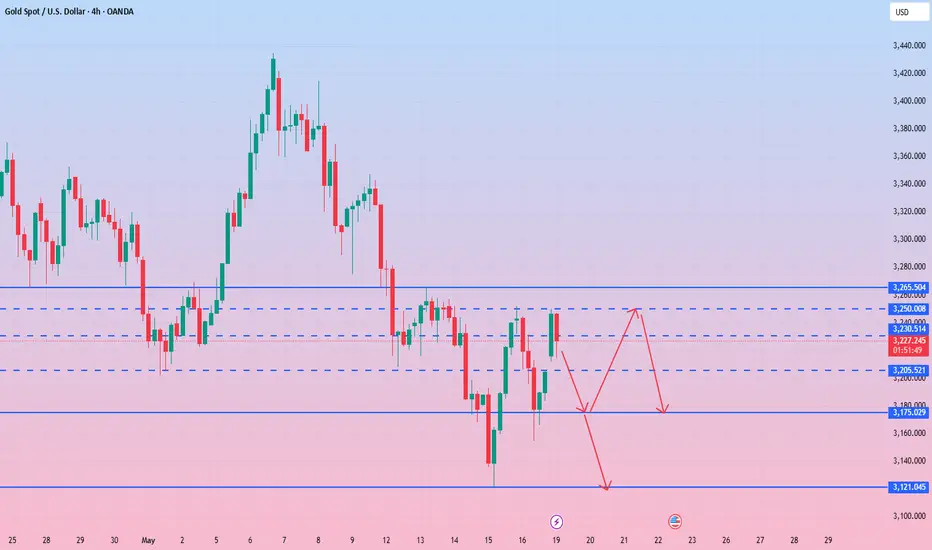
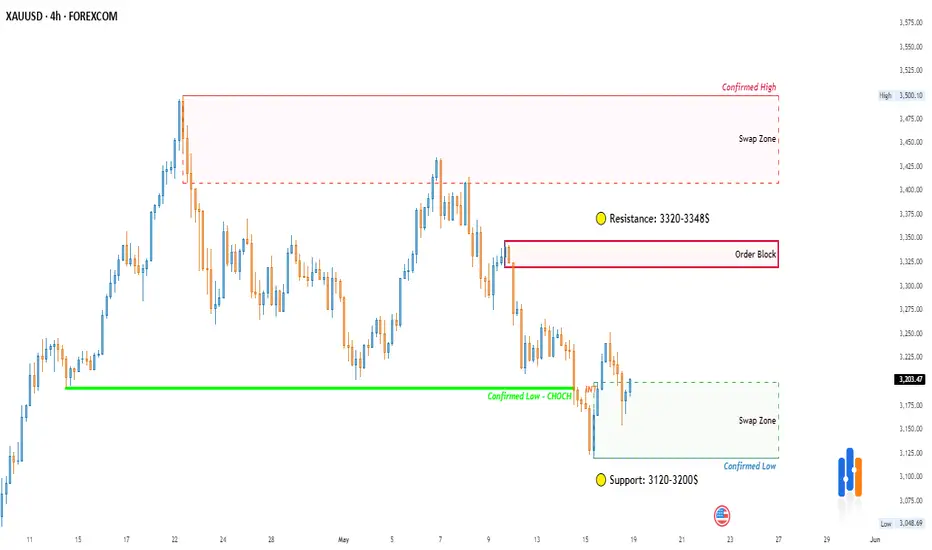
gold(4H)📌 Gold (XAU/USD) - Key 4H Levels
🔍 Critical Zones:
▫️ Resistance: 3320-3348$
▫️ Support: 3120$
▫️ Trend: Bullish above 3120$
⚡️ Trade Plan:
• Entry: 3120-3200$
• Target: 3320$ | SL: 3120$
• Risk: ≤1% capital
💬 Poll:
"Which scenario is likely?
1) Break 3348$
2) Reject at 3320$
Reply ↓"
Swing analysis on Gold of target achieving storyHow far accuracy goes in your analysis ??
swing analysis in Gold.
Follow for more simple and accurate analysis of INDEX |COMMODITIES| CURRENCY

Gold layout summary and forecast for next week
Before the fishermen went out to sea, they didn't know where the fish were? But they still chose to go because they believed they would return with a full load. When you invest, you don't know whether you can make a profit, but you still need to try. Success is not something that will happen in the future, but from the moment you choose and decide to do it, you will gain something if you insist on believing. The same is true for gold investment. You may still be losing money at the moment, but as long as you find me, all losses will be solved!
Views on the trend of gold next week!
Gold continued its downward trend on Friday. In the morning, there was another long-short wash and returned to the 3200 mark. The daily line closed with a small negative line. Then we have to consider a problem now, that is, whether the daily line will form a continuous decline. In the daily rhythm, we can see that the position of the high point has been declining, which means that after the top resistance level of the three-point line is blocked, it is easy to form a secondary turning point of the trend downward, which means that next week we still have to look at the retracement.
As for the future market direction, the short-term bearish trend will continue to be the theme! On the whole, the gold price rebounded in 4 hours and made a backtest. If the rebound does not break the resistance, it will continue to fall, and the direction of the decline will continue! After the short turning point turned downward from the high point, the current short trend is still extending downward, that is to say, before the short reaches the key node and the long builds a bottom, the rebound is still the main rhythm!
Gold: Enter short orders near 3212 next week, defend 22, and target 3180-60!