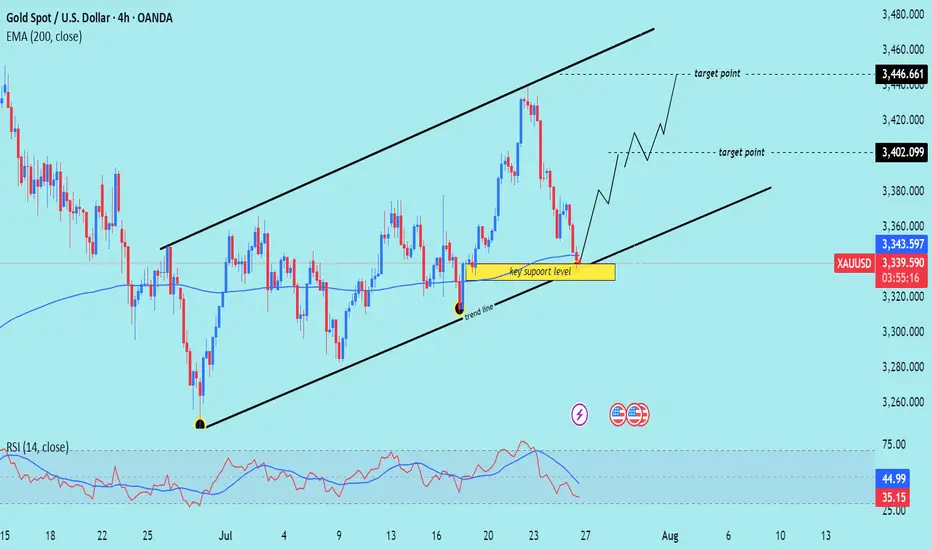
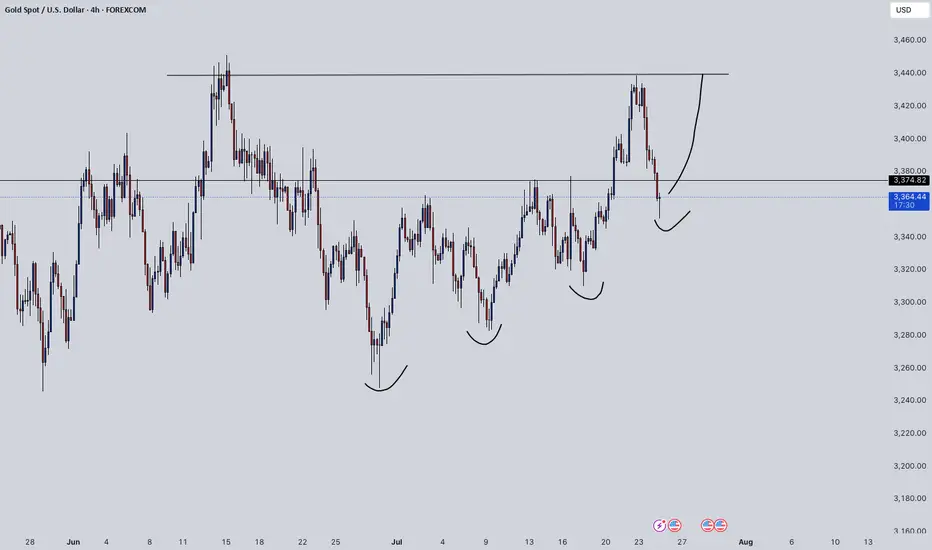
XAU/USD) bullish the support Read The captionSMC Trading point update
Technical analysis of (XAU/USD) on the 4-hour timeframe, indicating a potential bounce from a key trendline support within a rising channel.
---
Analysis Summary
Pair: XAU/USD (Gold Spot vs. USD)
Timeframe: 4H
Current Price: 3,338.715
Bias: Bullish rebound within ascending channel
---
Key Technical Elements
1. Ascending Channel:
Price has been respecting a well-defined rising channel, bouncing between support and resistance levels.
2. Key Support Zone:
The yellow highlighted area marks a critical support level and lower boundary of the channel.
Also intersects with the trendline, strengthening the potential for a bounce.
3. 200 EMA (Dynamic Support):
The 200 EMA at 3,343.616 lies just below current price, acting as a dynamic support level.
4. RSI (14):
RSI is around 34.93, nearing the oversold zone, suggesting a buying opportunity may be near.
---
Target Points
First Target: 3,402.099
Second Target: 3,446.661
---
Trade Idea
Direction Entry Zone Stop-Loss Target Zones
Buy 3,330–3,345 Below 3,320 3,402 / 3,446
Mr SMC Trading point
---
Summary
Gold is currently testing a key support level and ascending trendline. If price holds above this area, we can expect a bullish rebound toward 3,400–3,446 levels, aligning with the upper channel resistance.
Please support boost 🚀 this analysis)
Goldlong
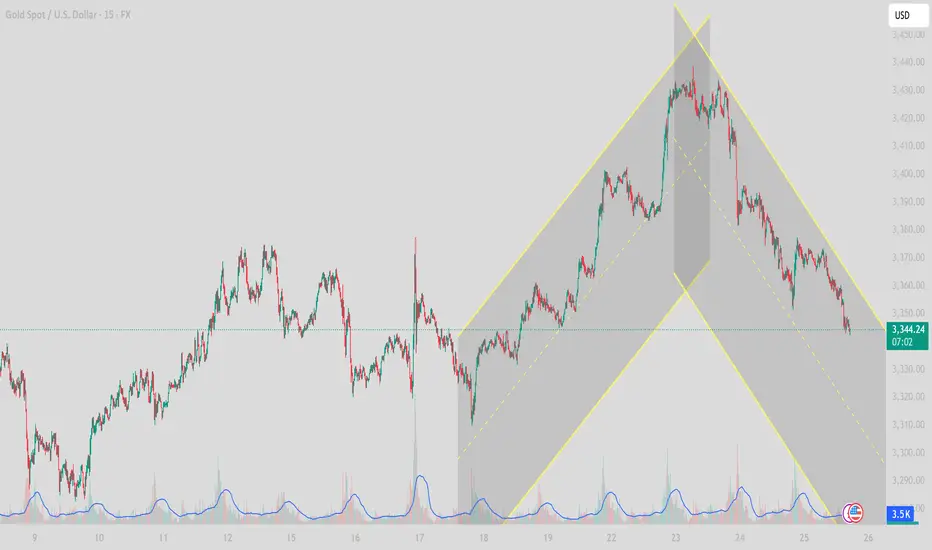
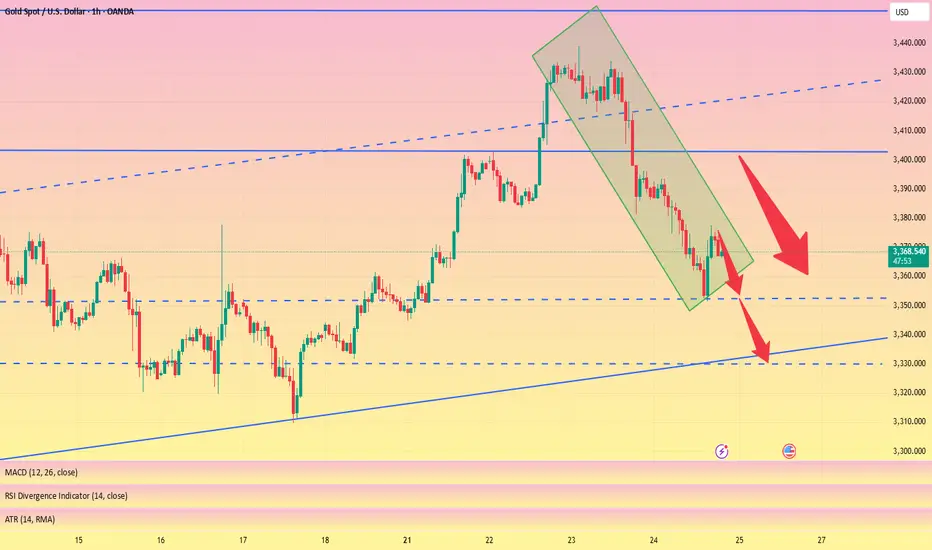
Bearish Channel Development and Key Support Zone Test1. Technical Overview (15m timeframe):
Gold (XAUUSD) is currently trading around 3,342.80, showing signs of continued downward momentum after forming a bearish reversal pattern from the 3,404–3,410 USD resistance area. The price action has now developed into a clear descending channel, with lower highs and lower lows forming in a structured manner.
2. Key Price Levels to Watch:
Immediate Support Zone:
🔹 3,335 – 3,330 USD – This zone aligns with previous structure and the lower bound of the descending channel. A break below this area could accelerate selling pressure toward deeper Fibonacci zones.
Next Major Support (Medium-term):
🔹 3,310 USD – A critical zone where price reacted strongly during the last pullback. A breakdown here would shift sentiment fully bearish in the short-term.
Resistance Levels:
🔹 3,358 – 3,360 USD: Minor intraday resistance near the upper bound of the descending channel.
🔹 3,375 USD: EMA21 and previous structure level.
🔹 3,404 – 3,410 USD: Major confluence resistance from recent highs.
3. Price Action and Indicators:
Descending Channel: Price is respecting the upper and lower trendlines of the bearish channel. No bullish breakout signal confirmed.
Volume: Decreasing on the bounce, rising on the decline – a bearish volume structure.
RSI: Near oversold (not shown, but implied from price exhaustion), could suggest a bounce, but no divergence confirmation yet.
EMA Trend: EMA21 and EMA50 (not shown but assumed from price slope) are likely crossing downward on higher timeframes, reinforcing bearish pressure.
4. Strategy Suggestion – Scenarios for Intraday Traders:
🔻 Scenario A – Continuation Short (Sell on Retracement)
Entry: Around 3,358–3,360 (upper bound of descending channel).
SL: Above 3,365.
TP1: 3,335
TP2: 3,310
Confirmation: Look for bearish engulfing or pin bar rejections on the 5m–15m timeframe.
🔺 Scenario B – Countertrend Long (Bounce from Channel Base)
Entry: Near 3,330–3,335 (support zone).
SL: Below 3,325.
TP1: 3,350
TP2: 3,360
Note: This is a riskier trade and should only be taken with bullish reversal confirmation (hammer, bullish divergence on RSI, or break of structure on LTF).
5. Summary:
Gold is currently in a short-term bearish correction, respecting a well-defined descending channel. Price is approaching a critical support zone (3,330–3,335), where a potential intraday bounce may occur, but trend remains bearish unless a clear break
GOLD BUYI will be looking for buys as shown on the chart. If you agree, please show some love, and if you disagree, also show some love and let me know why you are not. Happy Trading, Happy Friday.

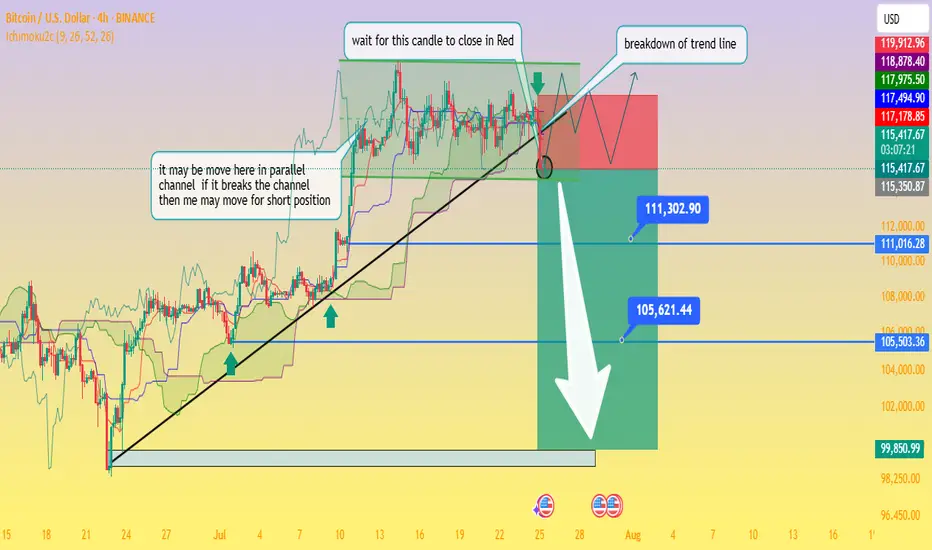
Critical Breakdown: BTC/USD Poised to Fall — Waiting on H4 CloseAnalysis of the BTC/USD 4‑Hour Chart
From the chart you provided, here's how the technical situation looks:
Ascending trendline support has been tested multiple times and was recently breached this afternoon, signaling a possible shift from the bullish setup to a bearish continuation.
The price is now trapped within a descending triangle formation beneath a well‑defined swing high resistance zone. This reflects indecision in the market, with neither buyers nor sellers in clear control
Business Insider
+15
Fxglory Ltd
+15
Bitcoin News
+15
.
Key levels to monitor:
Support zone: ~$115,500, extending down to ~$111,300 and ~$105,600 as deeper targets if bearish momentum strengthens.
Resistance zone: ~$119,000–120,000 area, forming strong overhead supply
Economies.com
DailyForex
Bitcoin News
.
The chart’s annotations align with a classic breakout strategy—with the caveat: wait for a confirmed close below the trendline before considering short positions (as noted in your “wait for this candle to close in red” comment).
Breakout confirmation would likely pave the way toward your indicated profit zones near ~$111k and ~$105k, with a larger potential down to ~$99.8k if further downside pressure builds.
🔍 What the Broader Market Signals
Technical sentiment from sources covering today’s analysis shows BTC/USD hovering just under $120,000, stuck within the defined range of $115.5k support to $120k resistance
Economies.com
.
While there’s still neutral momentum in indicators like RSI and MACD, the short-term direction leans bearish if the breakdown is confirmed on the H4 timeframe
Fxglory Ltd
.
Analysts emphasize that sustained movement above $116.5k could retarget resistance near $119–120k. A failure there and a move below $115.5k may thrust price deeper toward your downside zones
DailyForex
.
✅ Trading Strategy Overview
Scenario Trigger Target Levels
Bearish Breakdown H4 candle closes below trendline ~$115.5k $111.3k → $105.6k → possible $99.8k zone
Bullish Rejection Bounce back above ~$116.5k and trending above resistance $119k–120k retest, potential breakout if sustained
Neutral / Wait-and-see No decisive candle close yet Hold for confirmation
⛳ Final Thoughts
chart highlights a critical point: don’t act prematurely. Wait for a decisive H4 candle close below the trendline before committing to shorts. Confirmed bearish action around the breakout could open the path to the lower targets you identified. However, if price rebounds above support and climbs above $116.5k, a short-term retest of $119k–120k is still in range.
Traders should maintain prudent risk management—watching the unfolding price action around these pivot points without overreaching. Let me know if you'd like help crafting entry/exit zones or risk profiles for this setup!
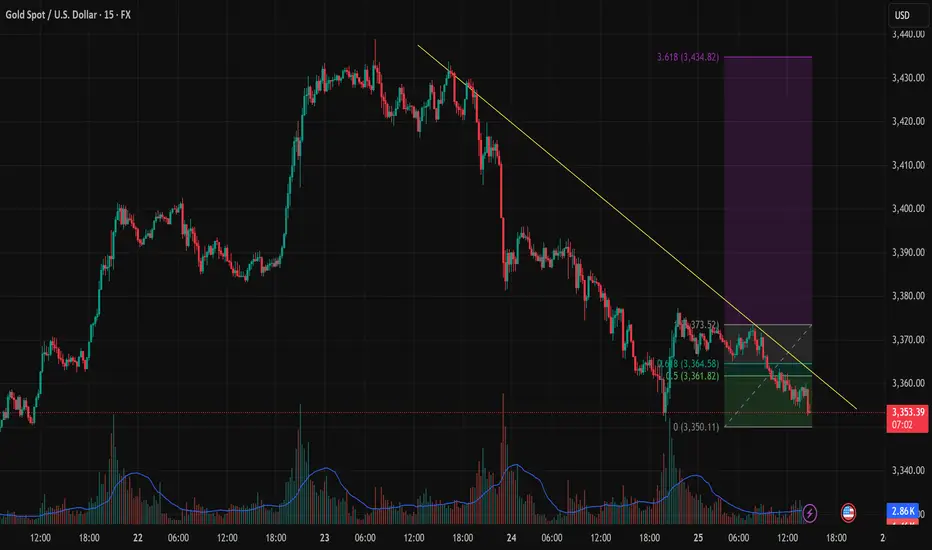
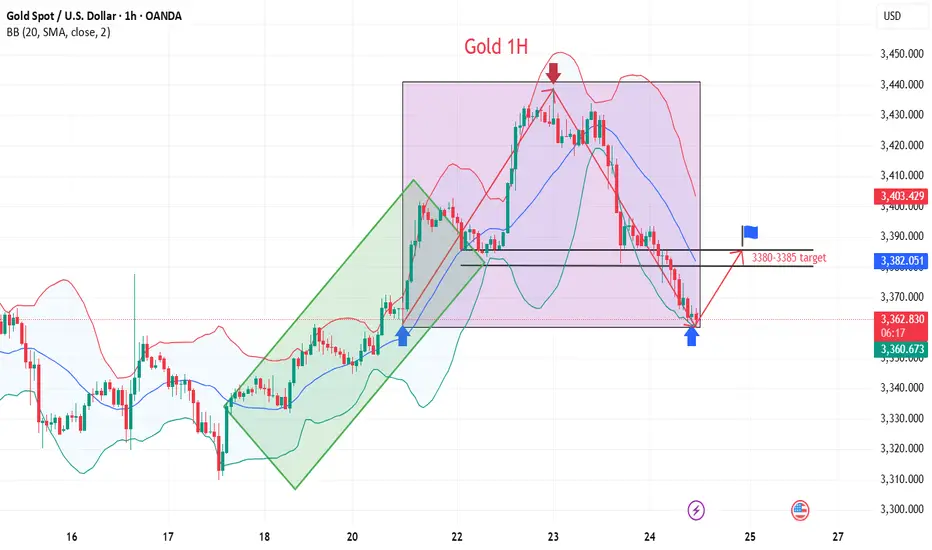
BULLISH REVERSAL SIGNAL FROM 3,350 SUPPORTOn the 15-minute chart (M15), XAUUSD is showing early signs of recovery after a sharp decline that found support around the key 3,350 USD level. This area has been tested multiple times with increasing volume, suggesting potential buyer accumulation.
Technical Analysis: Downtrend Line: A descending trendline (yellow) from the July 23 high has acted as dynamic resistance. Price is now approaching this line again.
Fibonacci Retracement: The recent rebound from 3,350.11 to 3,373.52 shows key resistance zones at the 0.5 (3,361.82) and 0.618 (3,364.58) Fibonacci levels.
Volume Spike: Notable volume surges at the bottom suggest increased buyer interest near support.
Key Price Levels for Today: Technical Zone Role 3,350 – 3,353
Strong short-term support 3,361 – 3,365
Fibonacci 0.5–0.618 resistance 3,373.5
Previous swing high 3,400 – 3,434
Fibonacci 3.618 extension target
Trading Strategies: Scenario 1: Bullish Breakout Above Trendline Entry: Buy stop above 3,366 with increasing volume.
TP1: 3,373.5
TP2: 3,400
TP3: 3,434 (Fibonacci 3.618 extension)
SL: 3,348 (below recent low)
Scenario 2: Trendline Rejection – Bearish Continuation Entry: Sell limit at 3,364–3,366 if bearish pin bar / engulfing pattern appears
TP1: 3,350
TP2: 3,338
SL: 3,375
Additional Confirmation Signals: Closely watch price action near the trendline and Fibonacci zone (3,361–3,364).
RSI is not yet oversold, so a short-term technical rebound remains possible.
Conclusion: Gold is currently testing a significant support zone around 3,350 USD. If price successfully breaks above the descending trendline and holds, we may see a bullish impulse targeting as high as 3,434 USD. However, failure at this resistance may trigger another leg down.
GOLD XAUUSD BUY We shall be looking to scalp a bit on the gold as it has been selling for a while now and can expect a reversal as nothing sells forever in the market, so can buy a dip and expect it to push a fair amount
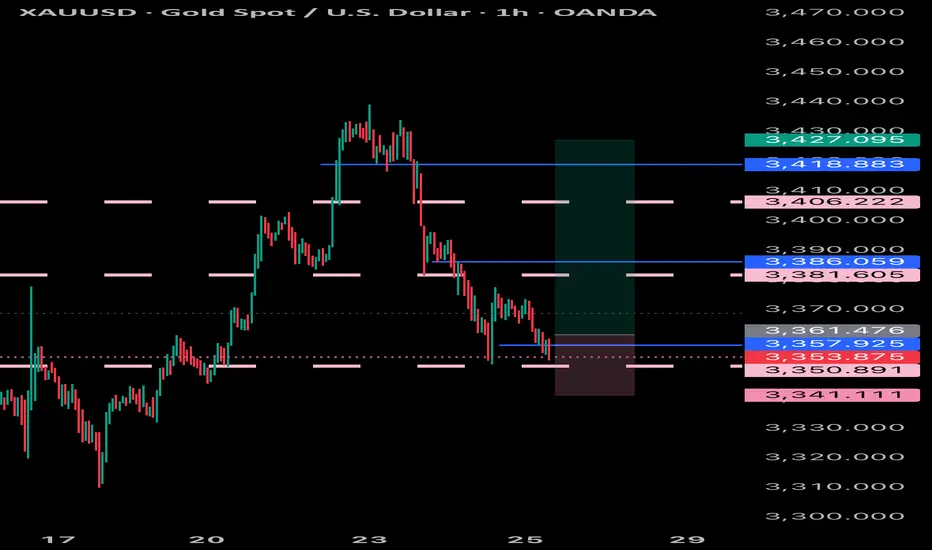
Trend corrected, long funds reduced, sellers returned#XAUUSD
The current moving average is still spreading downward, and the 4-hour chart closed with a large negative line. The market has not yet given a clear feedback on the current trend. However, after a large amount of buying funds intervened, the gold price hit a high of around 3377 and then stagnated. The short-term bullish momentum has weakened, and there is a certain risk of a correction and decline. Sellers are beginning to return📉.
Currently, you can consider participating in short selling at 3370-3377💡. If it rebounds directly to 3400-3405, you can still short if it does not break🔍. The target is 3360 below, and 3350 or even 3330 if it breaks🎯.
🚀 SELL 3370-3377
🚀 TP 3360-3350
Gold is going to $4,000Gold just made a Weekly Cycle low and it's going to $4,000 which is a 20% increase from the current levels

The callback is coming to an end, don't chase the short easily#XAUUSD
The long positions held last night have already left the market at a loss😔. After the Asian session opened, I continued to watch the trend of gold, but it did not effectively rebound to the ideal target area. After repeatedly testing around 3393, I chose to manually exit the market📀.
Gold is currently somewhat overcorrected, with the hourly line falling into severe oversold territory📉. But the market will eventually return to the bullish trend🐂. Why do I say that? First, there are less than 8 days left before the final deadline for tariffs. Second, the Federal Reserve’s interest rate cut is also approaching. In the medium and long term, there is definitely no problem with being bullish. There will be initial jobless claims data later, which will affect the trend of gold today. We need to pay some attention to it👀.
From the daily line, the current Bollinger Band middle track is near the 3343 line, and the SMA60 moving average is near the 3330 below. In the short term, the downward momentum of gold is released, and it is expected to test the 3343 mid-line support below💪.
📊Therefore, we can consider going long again at 3360-3343 below and look towards 3375-3385. Short-term losses don’t mean anything. With the recent frequent news fluctuations, we still have a good chance to turn losses into profits🚀.
🚀BUY 3360-3350
🚀TP 3375-3385
Gold failed to break through three times, short-term bearish?
💡Message Strategy
Gold's decline today means the second consecutive day of decline as investors turn their attention to more positive trade developments since yesterday.
However, gold still received buying support earlier this week and briefly broke through $3,400. This round of gains tested key resistance levels on the gold daily chart, but ultimately the bears held their ground.
This is the third time in nearly three months that gold has tried to break through the $3,430 to $3,435 resistance area, but all failed.
📊Technical aspects
Gold’s latest decline this week has brought the price back into a range-bound trading state between key hourly moving averages. This means that the short-term trend has become more neutral.
This shows that the upward momentum has clearly weakened and buyers need to regain short-term dominance before they can hope to challenge the key resistance area mentioned earlier again.
Currently, the 200 hourly moving average near $3,365 provides support to the downside. If the price can hold this level, it will indicate that buyers are still holding on and waiting for the next upside opportunity.
Combined with the current 1H chart trend analysis, there is still a great chance of a bullish pullback in gold in the short term.
💰Strategy Package
Long Position:3360-3365,SL:3340,Target: 3380-3400
xauusdupdate on gold ,right now on the daily we are still looking forward on a break so waiting carefully for that monster push above the 3440 areas
Gold’s Wild Ride: A Trader’s Take on What’s NextHey Fellow Traders! 👋
Gold’s been an absolute beast this week, smashing through both buyers and sellers like it’s playing a high-stakes game of market whack-a-mole! 😅 After Wednesday’s wild moves and today’s follow-up, Gold’s keeping us all guessing.
Right now, I’m not locking in a long-term bias—Gold’s too unpredictable for that. But here’s the exciting part: I’m eyeing a short-term long opportunity. Why? The price just dipped into a 4H Fair Value Gap (FVG) and tagged a Breaker, setting up a potential bounce. 📈
My plan? I’m expecting Gold to sweep up the highlighted liquidity and charge toward the 4H Inversion Fair Value Gap (IFVG). Once it hits that zone, I’ll be glued to the charts, watching for its reaction to decide the next move. 🧐
As always, trade smart! Set your stops, size your positions wisely, and don’t let Gold’s volatility catch you off guard. Protect your capital first—always! 💡
What’s your take on Gold right now? Are you jumping on this setup or waiting for more confirmation? Drop your thoughts in the comments below, give this post a like, and follow for more updates! 👇 Let’s keep the trading convo going! 🔥
BULLISH ON GOLDPrice is in Daily FVG and bearish momentum starts slowing down on 1H Timeframe. Entry off London Low sweep with rejection.

Xau/Usd - Gold turn to Bull runGold time to Long..
buy 3364
SL 3361
TP 3377
Xau/Usd Bull Run started
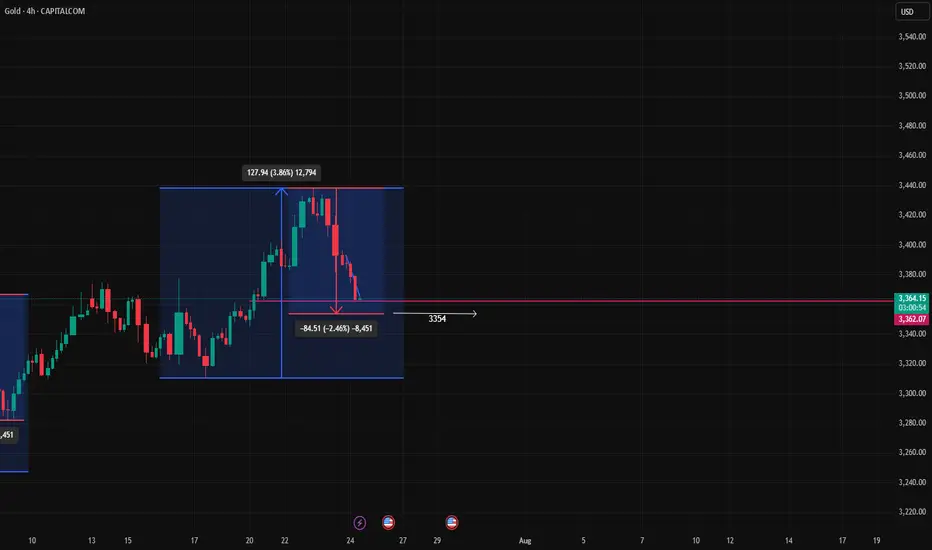
"Gold's Repeat Pattern: Two Impulses, Two Pullbacks – What's NexThis **4-hour Gold (XAU/USD)** chart shows a classic **price action structure** with two major impulsive waves followed by corrective pullbacks. Here's a breakdown using **price action principles**:
🔹 **1. Impulsive Rally #1 (Left Box)**
* **Price surged** by approx. **119.55 points (+3.68%)**, forming strong bullish candles with little to no wick on top — a sign of **buyer dominance**.
* The move was sharp, indicating **strong momentum** and **break of previous lower highs**, suggesting a possible **market structure shift** to bullish.
🔻 **2. Correction #1**
* The rally was followed by a **retracement of -84.51 points (-2.51%)**.
* Price made **lower highs and lower lows** within this box — indicating a **corrective pullback**, not a reversal.
* It respected previous support zones, which shows **buyers still in control**.
### 🔹 **3. Impulsive Rally #2 (Right Box)**
* Price then made a **new higher high**, rising **127.94 points (+3.86%)**.
* Strong bullish candles again appeared with follow-through — confirming **bullish order flow**.
* The **break of the previous swing high** confirms a **bullish structure continuation**.
### 🔻 **4. Correction #2 (Ongoing)**
* Current price is in a **retracement phase** of around **-84.51 points (-2.46%)** — nearly identical in size to the first correction.
* The correction is forming **lower highs and lower lows**, with potential for **bullish reaction near the previous support or demand zone**.
* The **market is testing previous structure** (support level near \$3360–\$3370) — a key area for **bullish reversal confirmation** (watch for pin bars or bullish engulfing patterns).
📌 **Price Action Summary
* **Structure**: Higher highs, higher lows — confirms **uptrend**.
* **Corrections**: Controlled and proportional — shows **healthy trend**.
* **Current Zone**: Price is testing **potential support**, watch for **bullish reversal signals** to catch next wave.
* **Bias**: Still **bullish**, unless structure breaks below recent swing low (\~\$3340).
---
✅ Traders’ Tip**: If bullish candles form at current support, it may present a **buy opportunity** with targets toward recent highs. Use proper risk management and watch for confirmation!
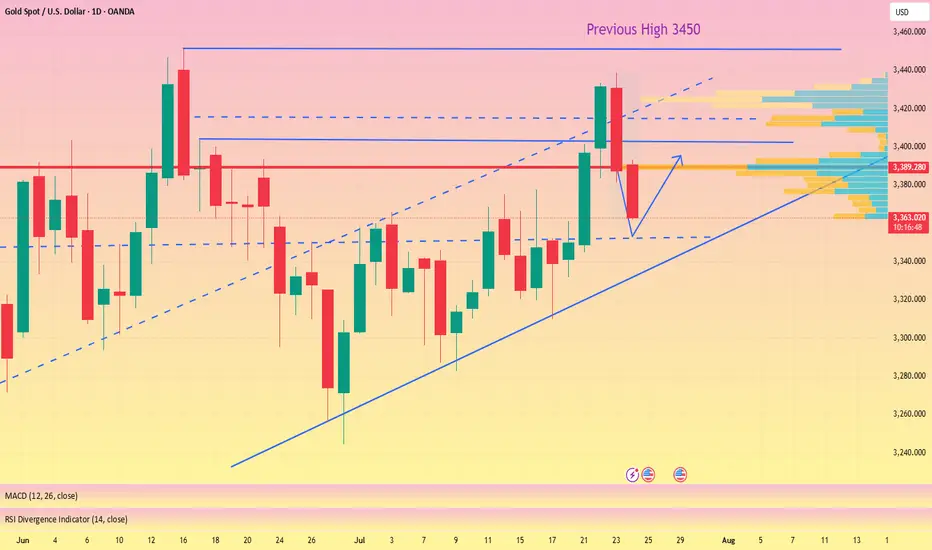
Correction is not bearish, buy on rebound at low levelToday is critical. Yesterday, gold fell under the pressure of 3396. The next 3396 area is very critical, and it will be relatively weak below it. If it goes up, the market rebound will expand. Pay attention to 3405 or 3420 area, with the focus on 3420. As long as it is below here, it will be mainly bearish. Breaking through 3420, the market is expected to continue to rise and break yesterday's high to test the 3450 area, and then seek to fall again. On the downside, pay proper attention to the 3380 area, which is short-term support; the focus is on the 3370~3365 area, which is the next bull-bear watershed.
The daily line fell yesterday and included the previous day's big positive rise, which represents the current high-level fluctuation of the price. At present, we need to pay attention to the lower moving average support corresponding to SMA10 at 3367, while the moving average SMA30 is around 3351-53, the middle track is at 3344, and the moving average SMA60 is at 3330.
From the daily level: today's decline will not fall below 3351-53, and it is likely to be around 3367-70. We have the opportunity to participate in long orders near 3370.
Therefore, if the price touches 3370-3365 for the first time during the day, you can consider going long, with the target at 3390-3400; if the downward trend of gold continues during the day, you can go long again at 3355-3353, defend 3345, and exit the market after earning a difference of $10-20.
OANDA:XAUUSD
Gold-----Buy around 3400-3410, target 3430-3450Gold market analysis:
The current highest gold buying has reached around 3438, which is the daily pressure level. This position is the high ground position that has touched the top many times before. The time to buy at these positions will not be long. There have been many dives before. However, as far as the current trend is concerned, the general trend is still buying, and short-term operations still have to buy. The daily buying is still not enough and closed positive again. The daily moving average began to diverge. Today's idea is to follow the buying first. I estimate that gold will enter a large game structure repair below 3451. In theory, short-term buying can be done, but the difficulty of intercepting on both sides will be more. You can keep buying at a low price in the short term. If it breaks 3400, it will turn weak.
Our idea is to find buying opportunities above 3400-3410. The previous pattern was near 3405, and the daily moving average position was near 3390. The time and space for repair will be very large. If it breaks 3400, we need to think about whether it will enter a large technical adjustment.
Support 3400-3405, small support 3409, suppression 3438, 3445, 3451, the strength and weakness dividing line 3402.
Fundamental analysis:
Recently, it is all regular data, there is no big fundamentals and new news that can affect the market.
Operation suggestion:
Gold-----Buy around 3400-3410, target 3430-3450

XAUUSD I Potential Pullback and More GrowthWelcome back! Let me know your thoughts in the comments!
** XAUUSD Analysis - Listen to video!
We recommend that you keep this on your watchlist and enter when the entry criteria of your strategy is met.
Please support this idea with a LIKE and COMMENT if you find it useful and Click "Follow" on our profile if you'd like these trade ideas delivered straight to your email in the future.
Thanks for your continued support!

Gold surges! Gold prices soar!Market news:
In the early Asian session on Wednesday (July 23), spot gold fell slightly and is currently trading around $3,422/oz. Supported by the increasing uncertainty in global trade, the downward trend in U.S. Treasury yields and the weakening of the U.S. dollar, spot gold rose strongly, hitting a five-week high. The market's tension over the August 1 deadline for the implementation of U.S. President Trump's tariffs has intensified, driving safe-haven funds to continue to flow into the international gold market. Investors are focusing on the progress of the U.S. multilateral trade negotiations and the new round of tariffs that the Trump administration is about to launch: while the demand for safe-haven assets has increased, the U.S. 10-year Treasury yield has fallen to a two-week low, further enhancing the attractiveness of non-interest-bearing gold. The global economic slowdown, expectations of loose monetary policy and geopolitical risks will continue to support gold's status as a safe-haven asset. Looking ahead to the market this week, the market focuses on: the Fed's FOMC policy meeting will be held next week. Although the meeting is expected to keep interest rates unchanged, investors have begun to bet on the possibility of a rate cut in October; Fed Vice Chairman Bowman reiterated on Tuesday that the central bank should maintain policy independence, and Powell's upcoming policy meeting may release further signals; in terms of inflation, as signs of tariff costs being transmitted to consumer goods emerge, Powell has previously warned that inflation may accelerate again in the summer.
Technical Review:
Gold maintained its expected bulls and hit a new high yesterday. The daily line maintained a long-term structure of consecutive positive bulls. The MA10/7-day moving average opened upward, and the RSI indicator ran above the central axis. The Bollinger Bands of the hourly and four-hour charts opened upward, the price maintained the middle and upper track channel, and the moving average system opened upward. The idea of gold trading remains unchanged, and the layout is mainly based on buying at a low price and selling at a high price. After a sharp rise last night, gold began to fluctuate at a high level in the second half of the night, and the adjustment was very small, which means that the market is still the strong market. The recent pattern of gold price fluctuations and rises remains. Since it is fluctuating upward, the overall trend of gold today is still biased towards buying, but we need to be alert to the risk of short-term corrections. It is recommended to arrange buy orders based on technical support levels, and pay attention to trade policies and the Fed's trends!
Today's analysis:
Gold buying has been as strong as a rainbow in the past two days, and it is also a buying carnival. Gold is now buying strongly and the momentum is winning. Once the trend is formed, it is necessary to follow the trend. Now the trend of gold buying is very obvious, constantly refreshing the recent highs, so continue to buy gold to the end, and continue to buy if it rises. Continue to buy if it falls during the day!
The gold 1-hour moving average continues to form a golden cross upward buying arrangement. The gold buying power is still there, and gold continues to exert its strength. Gold has risen step by step in the past two days. As long as there is no sharp decline, it is accumulating momentum to attack. The gold support continues to move up. Now it has broken through and stabilized at the 3400 line. If gold falls back to 3400, it can still be bought at low prices.
Operation ideas:
Short-term gold 3400-3403 buy, stop loss 3392, target 3420-3440;
Short-term gold 3438-3441 sell, stop loss 3450, target 3400-3380;
Key points:
First support level: 3412, second support level: 3403, third support level: 3390
First resistance level: 3438, second resistance level: 3450, third resistance level: 3468

XAU/USD(20250723) Today's AnalysisMarket news:
White House officials plan to visit the Federal Reserve headquarters on Thursday local time.
Technical analysis:
Today's buying and selling boundaries:
3416.02
Support and resistance levels:
3465.76
3447.17
3435.12
3396.94
3384.89
3360.33
Trading strategy:
If the price breaks through 3435.12, consider buying, the first target price is 3447.17
If the price breaks through 3416.02, consider selling, the first target price is 3396.94

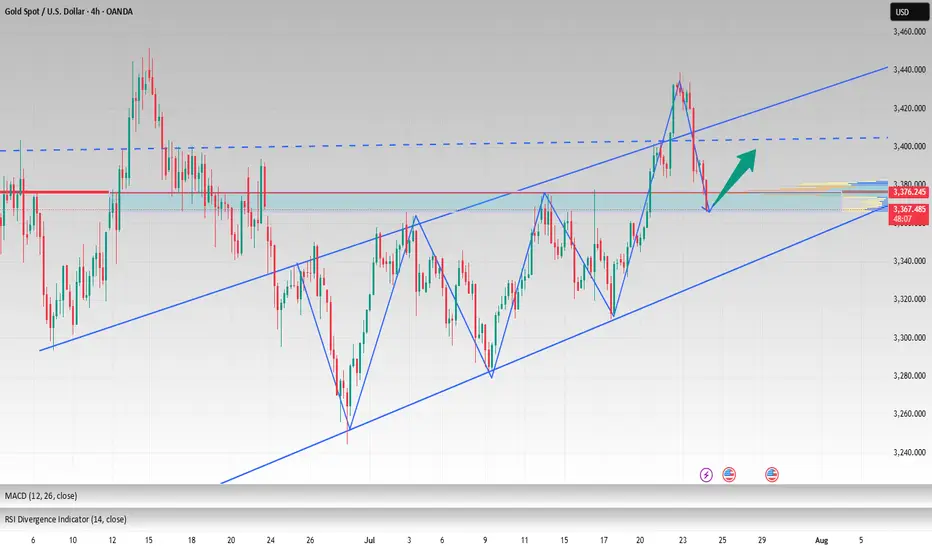
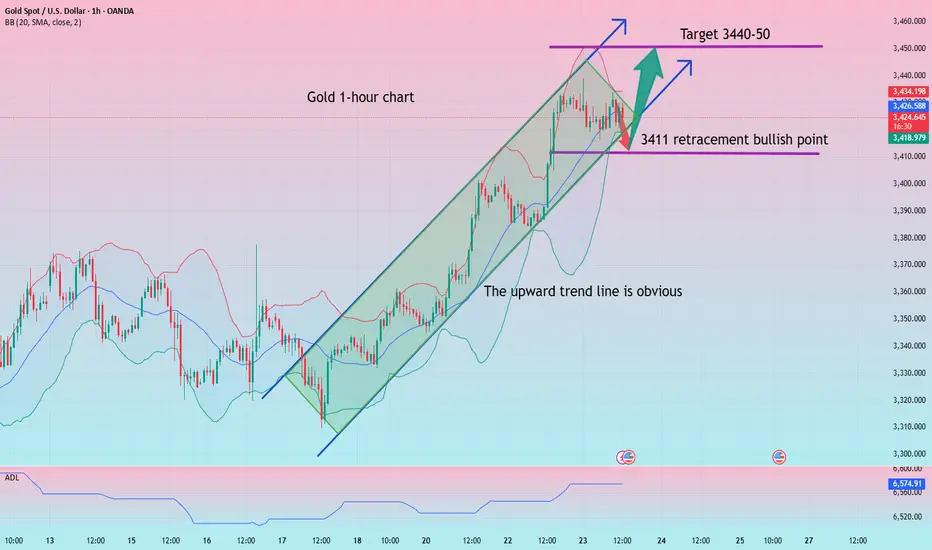
Gold is often bullish and bearish, with a focus on the 3411 wate
Gold prices hit a five-week high of $3,439 an ounce on Wednesday before turning lower on profit-taking and a rebound in the dollar. However, from a technical perspective, the path of least resistance for gold prices still appears to be to the upside. Looking ahead, trade and political developments will continue to play a key role in gold price movements, while traders will also be keeping a close eye on the feud between Trump and Fed Chairman Powell.
Why did gold return to $3,400? Reasons explained!
1 As investors continue to focus on U.S. President Trump's August 1 tariff deadline, trade uncertainty and weaker U.S. Treasury yields have pushed gold prices to a five-week high. At the same time, trade uncertainty is also triggering some safe-haven demand.
2 Meanwhile, investors are also preparing for the Fed meeting next week. Although the Fed is expected to keep interest rates unchanged, the market expects that the Fed may cut interest rates in October. Gold is traditionally seen as a hedge in uncertain times and tends to perform well in a low-interest rate environment.
What do you think of today's gold trend!
Today, gold rose to 3439 and then continued to fluctuate sideways. At present, gold has been fluctuating and weakening near 3420. Relatively speaking, the trend is still strong, but the trend has not continued to break through the high point. In this trend, it is actually unwise to chase the rise. At present, we still have to wait for the market sentiment to be fully mobilized before continuing to operate!
The hourly line is still the view of the previous post. Near 3411 is the key position for the second bullish today. Unfortunately, the fluctuation has been fluctuating around 15 points today, and the amplitude of the fluctuation has slowed down. It is still necessary to wait quietly. After all, under the current situation of large repetitiveness, it is not easy to enter the market at a good point and there is a high probability that there will be no good profit margin. If there are other changes later, I will give them in real-time guidance!
Gold: More near 3411, defend below 3403, and the target is 3440-50!
Gold Likely to Rise as USD Weakens📊 Market Overview
Spot gold (XAU/USD) is trading around $3,423–$3,427/oz, down ~0.2% after news of a US–Japan trade deal boosted risk sentiment. However, a weaker USD and lower US bond yields continue to support safe-haven demand.
📉 Technical Analysis
• Resistance: $3,447 – $3,464 – $3,496
• Support: $3,399 – $3,367
• EMA9: Price is below EMA9 → short-term bearish; medium-term outlook remains bullish if price reclaims EMA20.
• Momentum indicators: RSI ~69; MACD & ADX favor buyers.
📌 Outlook
Gold may move sideways or edge higher if USD weakness persists. A rise in risk appetite (e.g. from trade deals) could pressure prices short term.
💡 Suggested Trading Strategy
🔻 SELL XAU/USD: $3,442–$3,445
🎯 TP: 40/80/200 pips | ❌ SL: $3,449
🔺 BUY XAU/USD: $3,402–$3,405
🎯 TP: 40/80/200 pips | ❌ SL: $3,399

XAUUSD Support & Resistance Levels🚀 Here are some key zones I've identified on the H1/M15/M5 timeframe.
These zones are based on real-time data analysis performed by a custom software I personally developed.
The tool is designed to scan the market continuously and highlight potential areas of interest based on price action behavior and volume dynamics.
Your feedback is welcome!
