XAU/USD) breakout analysis Read The captionSMC Trading point update
Technical analysis of (XAU/USD) on the 4-hour timeframe, highlighting a move toward the $3,450 target. Here's the full technical breakdown
---
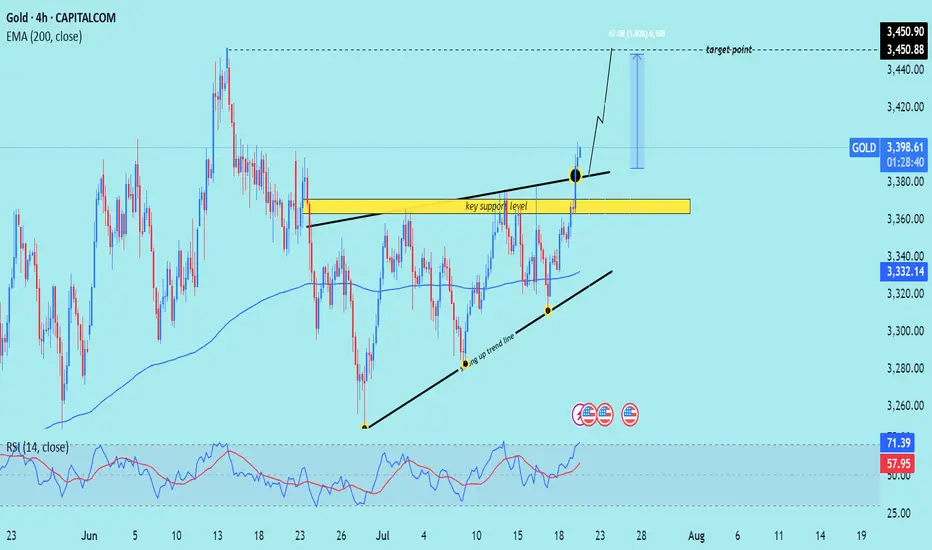
Technical Analysis – Gold (4H)
1. Breakout from Resistance Zone
Price has broken above a key horizontal resistance level (now turned support, marked in yellow).
The breakout is confirmed by a strong bullish candle with momentum, suggesting buyers are in control.
2. Ascending Triangle Formation
Price formed an ascending triangle, a classic bullish continuation pattern.
The breakout above the upper boundary confirms the pattern, projecting a potential measured move.
3. Trendline Support & Higher Lows
The structure shows a rising trendline (black), where price bounced multiple times — confirming a higher low sequence.
The confluence of trendline support + breakout level adds strength to the bullish case.
4. 200 EMA Confluence
The 200-period EMA (3,332.13) has been acting as a dynamic support throughout.
Price retested it earlier in the move, then surged upward — validating trend continuation.
5. RSI Indicator
RSI is at 71.13, entering overbought territory.
This implies strong bullish momentum, but a short-term pullback to retest the breakout level is possible.
6. Target Projection
Target Point: $3,450.90, calculated from the height of the triangle (~61 pts or 1.80%) added above the breakout zone.
A retest of the breakout area (yellow zone) around $3,370–$3,380 could offer a better entry before continuation.
Mr SMC Trading point
---
Summary
Bias: Bullish
Current Price: $3,397.62
Support: $3,370–$3,380 zone (previous resistance turned support)
Trend: Higher lows + breakout above resistance
EMA Support: 200 EMA at $3,332.13
Target: $3,450.90
RSI: 71.13 – bullish but near overbought
Please support boost 🚀 this analysis)
Goldlong
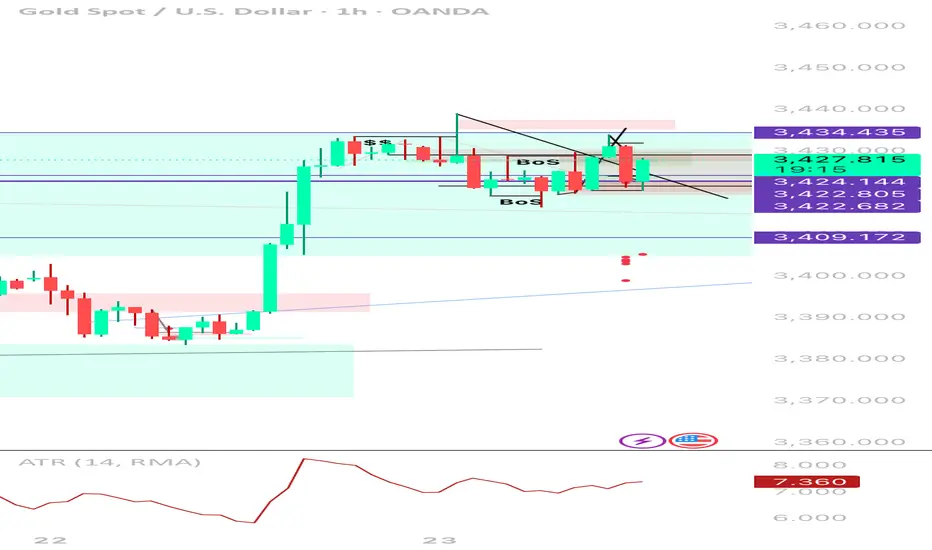
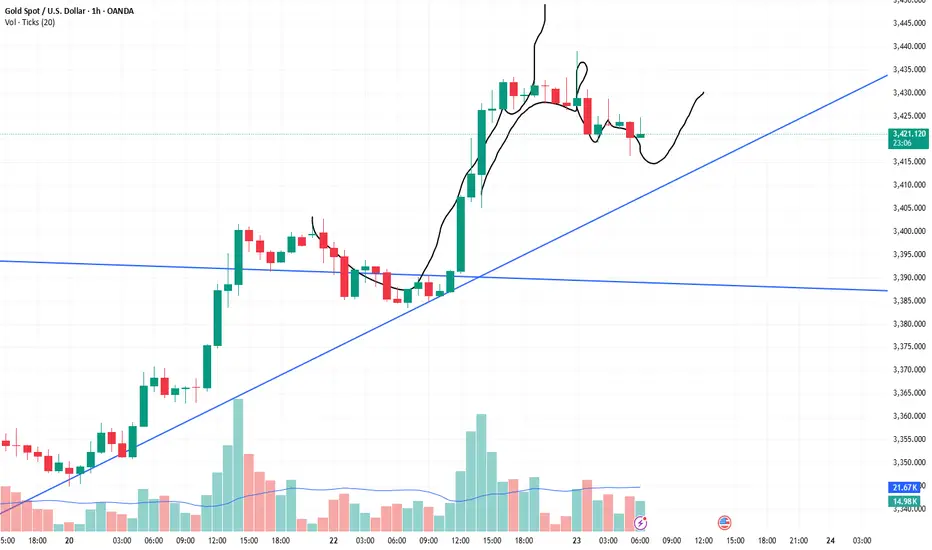
XAUUSD 1H | Sell TP Hit → Now Flipping Long After Liquidity SweeSmart Money Buy Setup | 1H Execution | Reversal from Demand Zone
Just hit full TP (396 pts) on a clean short from 3,434. Now flipping bias to long after price tapped into a key 4H OB and demand zone near 3,422. Price swept downside liquidity, mitigated the imbalance, and is now showing bullish intent.
⸻
🔄 Trade Narrative:
• ✅ Sell-side liquidity swept below previous HLs
• 🧱 Price tapped into 4H Order Block + FVG zone
• 💧 Internal liquidity vacuum filled (3,422–3,409)
• 🔁 Potential 1H BOS to the upside forming
• 🕯️ Bullish wick reaction from demand = early entry signal
• 📉 ATR low + building pressure = potential expansion incoming (likely NY)
Buy plan:
Entry Zone
3,422–3,424 (with confirmation on BOS)
Stop Loss
Below 3,409
TP1
3,434.435 (prior supply tap)
TP2
3,439.210 (range high)
TP3
3,455–3,460 (weekly extension target)
📌 Why I’m Flipping:
Price didn’t just reject randomly — it reacted exactly where smart money would’ve wanted to rebalance after the previous long impulse. This is the textbook scenario where you don’t marry a bias — just follow liquidity and structure.
🧠 Key Lessons:
• Don’t force continuation when the market is clearly absorbing
• Liquidity grabs often lead to strong reversals — watch BOS to confirm
• Same zone that gave you your TP? Can give you your next entry 💡
🔖 Tags:
#XAUUSD #SmartMoney #LiquiditySweep #OrderBlock #BreakOfStructure #BuySetup #PriceAction #1HChart #GoldTrading
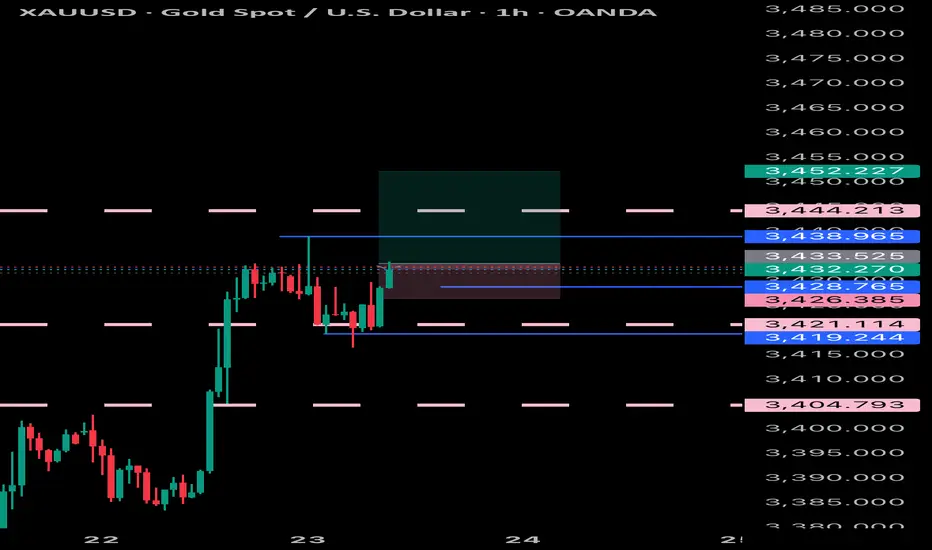
Bullish Channel in Play Key Trading Zones and Strategy for JulyOn the 1-hour chart, XAUUSD is clearly moving inside a well-defined ascending price channel, with price respecting both the channel boundaries and the midline as dynamic support/resistance. The pair continues to print higher highs and higher lows, confirming short-term bullish structure.
Trend Channel: Since July 18, gold has been steadily climbing within an ascending channel, bouncing off the lower boundary and riding above the midline.
EMA Support: The 10-period EMA (purple) has been acting as a dynamic support. Price has yet to close below it during this bullish swing.
Candle Behavior: Recent bullish candles with strong bodies show that buyers still have control, although price is stalling near the upper boundary of the channel.
Technical Level
3,459 USD. Major Resistance. Top of the channel – potential reversal or take-profit zone
3,423 USD.Immediate Support. EMA10 and current consolidation area
3,400 USD. Mid-Channel Support. Key pullback zone if price rejects near highs
3,360 – 3,365 USD. Major Support. Bottom of the ascending channel – break may invalidate bullish setup
Scenario 1 – Buy the Dip (trend continuation):
Wait for price to retest the 3,400 – 3,410 USD area or EMA10.
Look for bullish confirmation (e.g., pin bar, bullish engulfing).
Target: 3,445 – 3,459 USD
Stop loss: below 3,395 USD
Scenario 2 – Short at Channel Top (mean-reversion setup):
Monitor price behavior near 3,455 – 3,459 USD resistance.
If bearish reversal candles appear (e.g., shooting star, bearish engulfing), consider shorting.
Target: 3,420 – 3,410 USD
Stop loss: above 3,465 USD
As long as price remains inside the rising channel, buying pullbacks is the preferred strategy.
Stay alert to macroeconomic catalysts (Fed comments, PMI data, labor market releases) that could increase volatility.
Gold remains in a strong short-term uptrend on the 1H chart. Trading in the direction of the trend with proper risk management continues to offer the best opportunities for intraday traders.
If you found this analysis useful, don’t forget to follow for more trading strategies and ideas!

XAUUSD: Fluctuation of $30/ounce. Do you want to know?Yesterday, I frantically notified followers to buy around 3366-3375, and the market finally rose to 3430. This is a huge profit. I will continue to update it in the Band Trading Center Research Institute later. If you don’t want to miss it, follow me. If you see it but are still not sure how to trade. Then you can leave me a message at the Swing Trading Center Research Institute. I will reply to you one by one when I see it.
This week, some followers have achieved weekly profits of 50%-268%. If your profit is not ideal. Or don’t know how to trade. Remember to like and follow. I will lead everyone to victory.
Buy around 3400-3410. When will it close? I will post the results on the Swing Trading Center. Stay tuned.
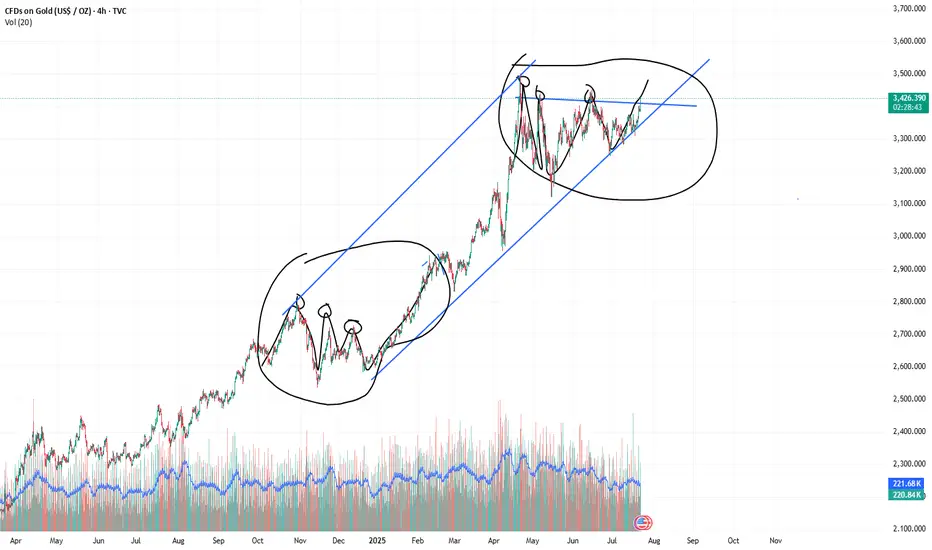
XAUUSD:3450-3500The probability of the same direction of the two histories is 95% similar. This shows one thing. The market may repeat history again.
So buy with me. The next target is 3450-3500
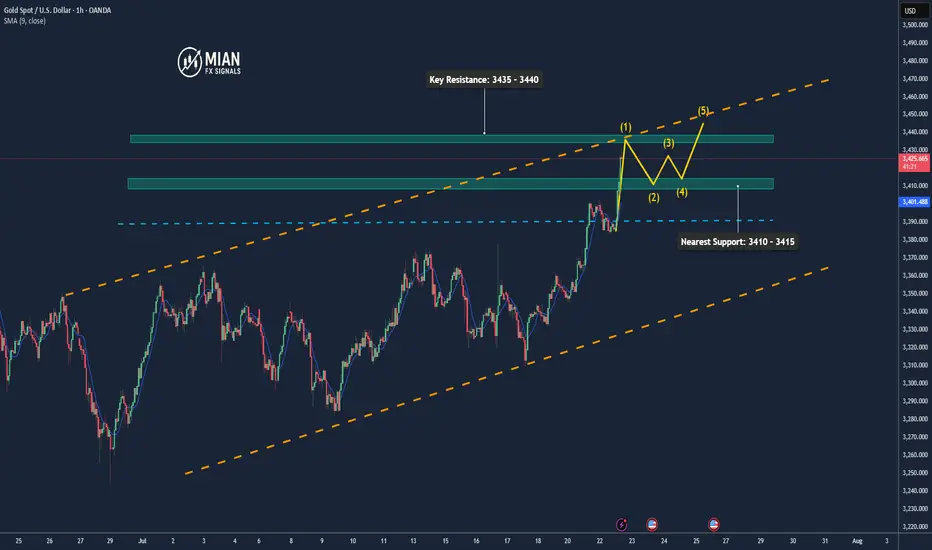
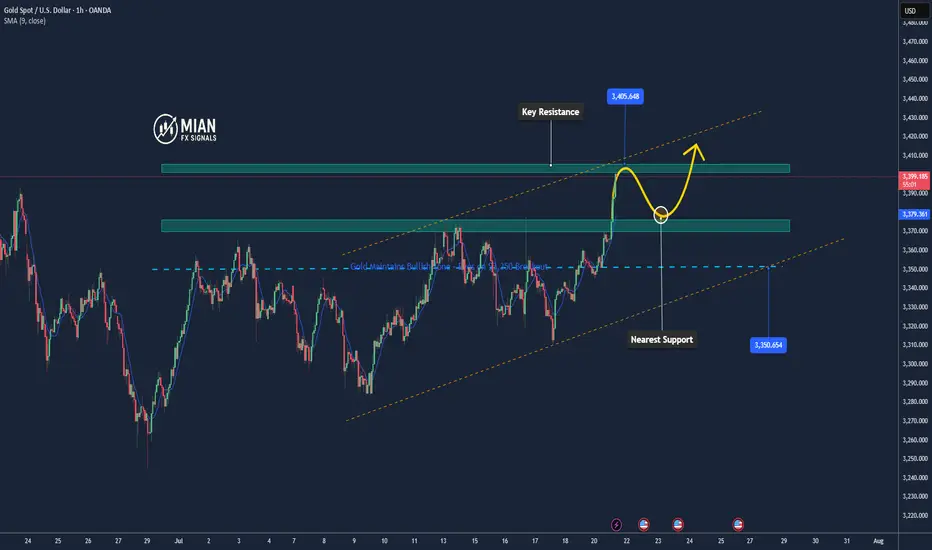
Gold Maintains Strong Momentum, Eyes 3435+📊 Market Drivers:
• Gold prices surged as the USD weakened further and U.S. bond yields dropped.
• Investors are increasingly betting that the Fed may cut interest rates in 2025, boosting demand for gold.
• Ongoing trade tensions and expectations of comments from Fed officials are adding to bullish momentum.
📉 Technical Analysis:
• Key Resistance: 3435 – 3440
• Nearest Support: 3410 – 3415
• EMA09: Price is above the EMA09 → confirms short-term uptrend
• Pattern & Momentum: Clean breakout from the 3383–3390 range with strong volume, bullish momentum continues
📌 Outlook:
Gold may continue rising in the short term if it holds above 3415. A pullback could offer a chance to re-enter long positions near new support levels.
________________________________________
💡 Suggested Trade Setup:
🔺 BUY XAU/USD: 3415 – 3418 (on pullback)
🎯 TP: 40/80/200 pips
❌ SL: 3412
🔻 SELL XAU/USD: 3435 – 3438 (key resistance)
🎯 TP: 40/80/200 pips
❌ SL: 3442
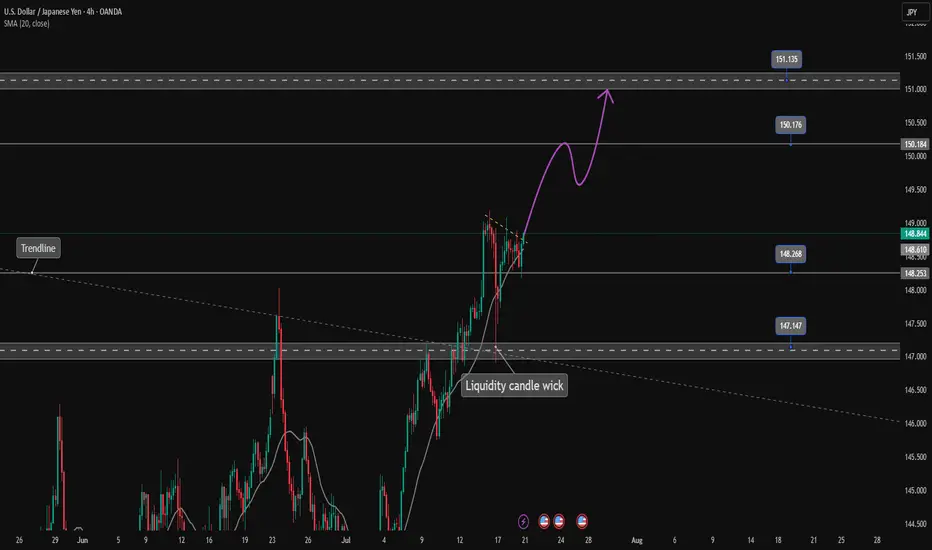
USDJPY is continuing its uptrend, let's BUY✏️ OANDA:USDJPY broke the price channel and continued its uptrend at 151,000. The previous h4 candle wick had a liquidity sweep to 147,000, showing that the buyers are dominating the market. The USDJPY trading strategy will mainly BUY to the old peak around 151,000. When the price breaks 147,000, a corrective downtrend will begin to form.
📉 Key Levels
Support: 148.200 - 147.200
Resistance: 150.100 - 151.100
Buy trigger: Breakout above 148,800
BUY 147,200 (buyer liquidity zone)
Target: 145,000
Leave your comments on the idea. I am happy to read your views.
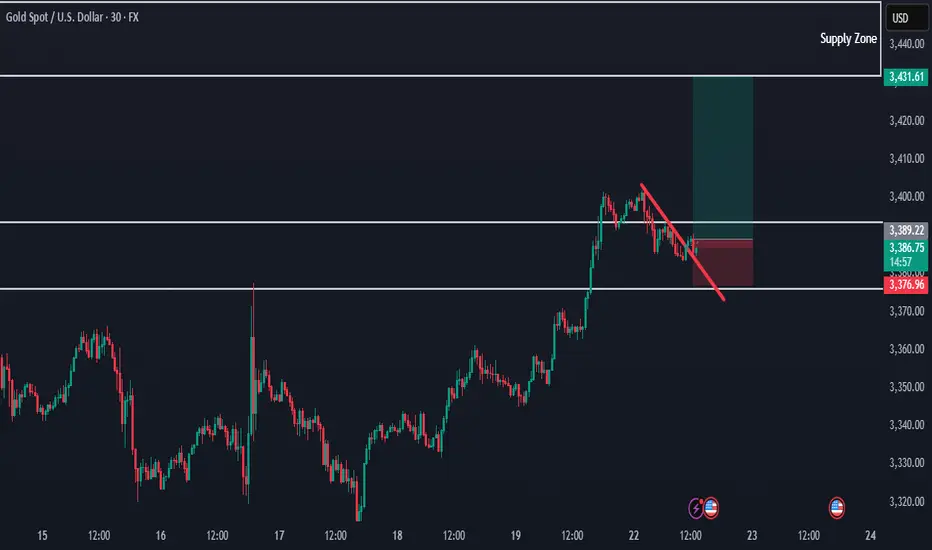
XAUUSD scenario for 7/22/25 This is what I'm looking at today.
Market is overextended after the sharp run—I'm expecting a range or retrace before another strong push.

GOLD: Price Made A New HHLooking to buy gold, market structure is bullish on the H1 and H4. I went over 2 different scenarios in the video...
1. Pullback Entry (Preferred)
🟢Entry Zone: 3365–3380
TP1: 3432
TP2: 3450
TP3: 3475–3500 (extended target if momentum holds)
2. Breakout Buy (Aggressive)
Trigger: M15 breaks and closes above 3405–3410 with strong displacement.
Entry: Retest of breakout zone at 3402–3405
Same Targets
Don't forget to set those price alerts!

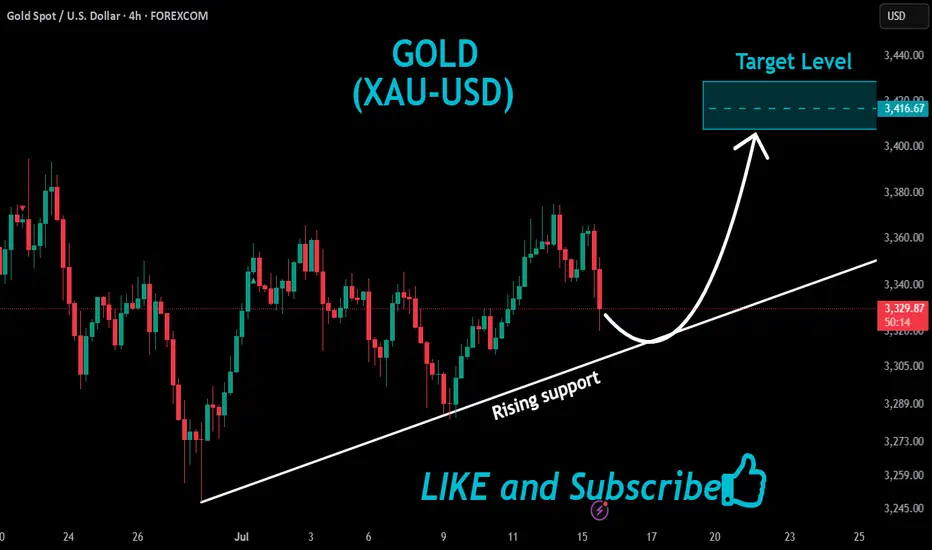
GOLD Will Keep Growing!
HI,Traders !
#GOLD keep trading in
An uptrend along the rising support
So as the pair is approaching
A the support we will be
Expecting a bullish rebound !
Comment and subscribe to help us grow !
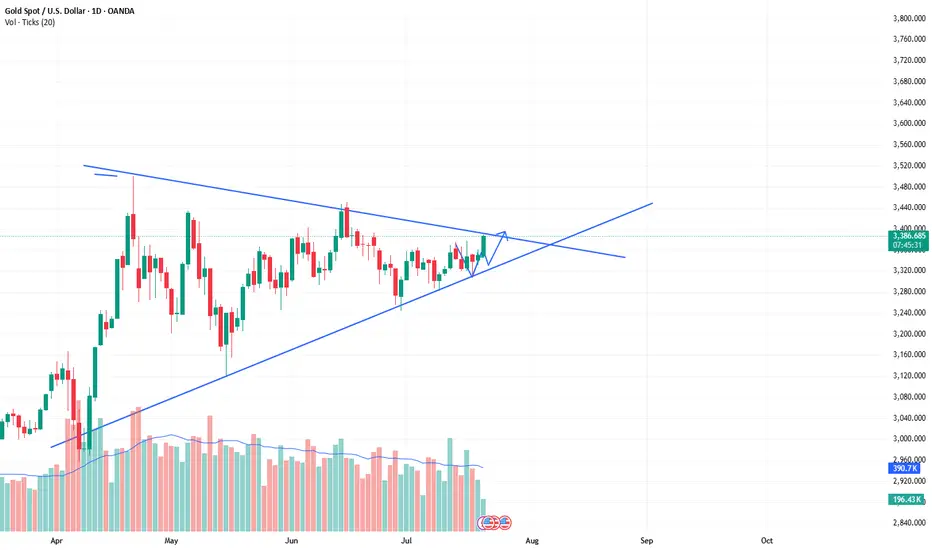
The bull market of xauusd continues, buy and wait for the rise.As predicted in the band trading center in advance over the weekend. The daily level trend is still very stable, and the breakthrough trend has been perfectly carried out. The current quotation is 3388. It is only a matter of time before it rises wildly to the position of 3430. The short-term will definitely break through. The current bull market is clear and has huge potential. The limit of the triangle consolidation phase is about to be broken. Then the bulls will continue to rise. Therefore, buying is the key operation plan.
XAUUSD:Retracement is a buying opportunityAfter the Asian market hit the highest position of 3403, there was some decline. The current gold price is 3386. From the short-term trend of the hourly level. It is still fluctuating at a high level. Combined with the trend of the daily level, there are signs of retracement and counterattack. There is no news dominance. It is purely a technical repair after hitting the high. This retracement can pay attention to the support near 3382-3378. The London and New York markets are still based on buying and profit.
Gold Breaking Previous Highs — Bullish Trend ContinuesHello everybody!
Price is continuing its bullish trend and has broken some significant resistance.
According to the market structure, we’re looking for it to go higher, up to the 3430 area.
The break of the downward trendline is a confirmation for a buy position.
Manage your risk and trade safe!
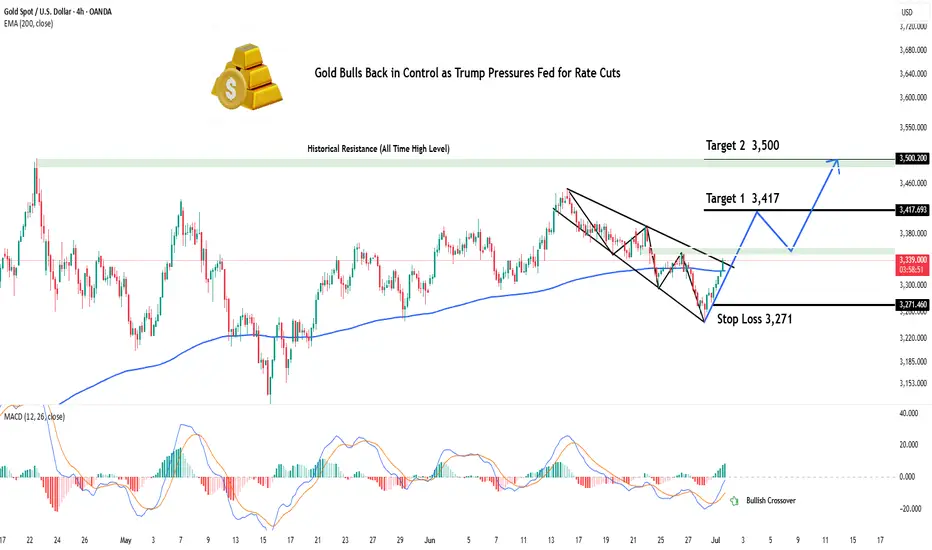
Gold Bulls Back in Control as Trump Pressures Fed for Rate CutsHey Realistic Traders!
President Trump is ramping up pressure on the Fed to cut interest rates , saying the U.S. is falling behind countries with looser policies. As several Fed officials begin to shift their stance, expectations for rate cuts are growing. That’s putting pressure on the dollar and giving gold a fresh boost.
We’ll take a closer look at what this means for OANDA:XAUUSD (Gold) through technical analysis and explore its upside potential.
Technical Analysis
On the 4-hour chart, Gold has moved above the EMA-200, signaling a shift in momentum to the upside. Price has also broken out of a Descending Broadening Wedge (DBW) pattern, which often indicates the start of a bullish trend.
The breakout was confirmed by a Bullish Marubozu candle, reflecting strong buying pressure. To add further confirmation, the MACD has formed a bullish crossover, reinforcing the upward momentum.
Looking ahead, the first target is seen at 3417. If reached, a minor pullback toward the historical resistance zone (green area) may occur, with a potential continuation toward the second target at 3500.
This bullish outlook remains valid as long as the price stays above the stop-loss level at 3271 . A break below this level would invalidate the setup and shift the outlook back to neutral.
Support the channel by engaging with the content, using the rocket button, and sharing your opinions in the comments below.
Disclaimer: "Please note that this analysis is solely for educational purposes and should not be considered a recommendation to take a long or short position on XAUUSD.
Gold Bulls Loading Up – Our Short Squeeze Trigger is Set!🚨 Gold Bulls Loading Up – Our Short Squeeze Trigger is Set!
We’re flipping the script on COMEX_MINI:MGC1! After a prolonged downtrend and textbook wedge compression, our breakout long is LIVE – but not without trapping the late shorts first.
💥 Entry: $3,312.1
🛑 Stop: $3,288.4
🎯 Target: $3,458.9
🧮 Risk/Reward: 6.19
Price just bounced at the retest of the wedge apex, and volume is confirming the move. If this holds, we’re riding momentum all the way up – and letting short pressure fuel the breakout.
📈 Trendline breached.
⏳ Time compression converging.
⚠️ If you’re still short, watch your stops!

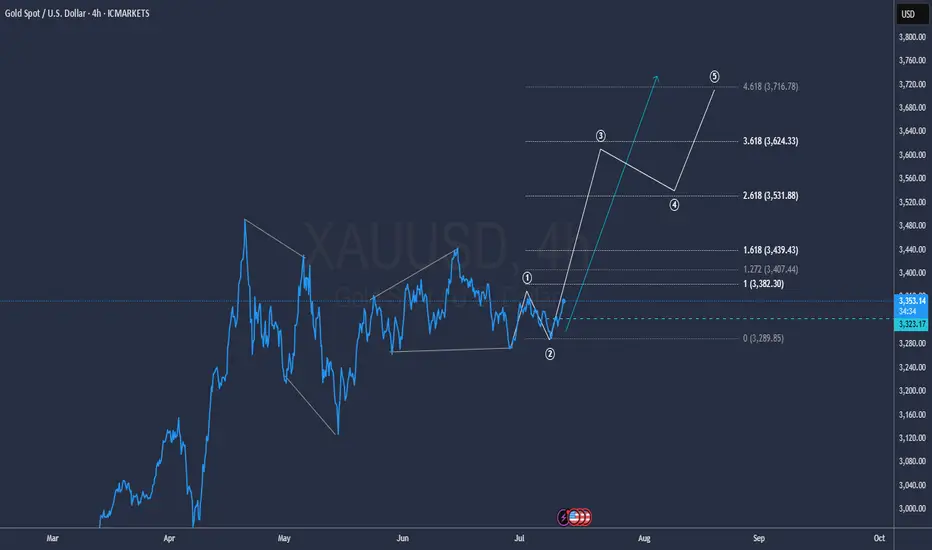
GOLD to the MoonHiper Clear Structure and the beginning of a new impulse towards 3.600 and 3.700
Hope everybody had a chance to got in
gg
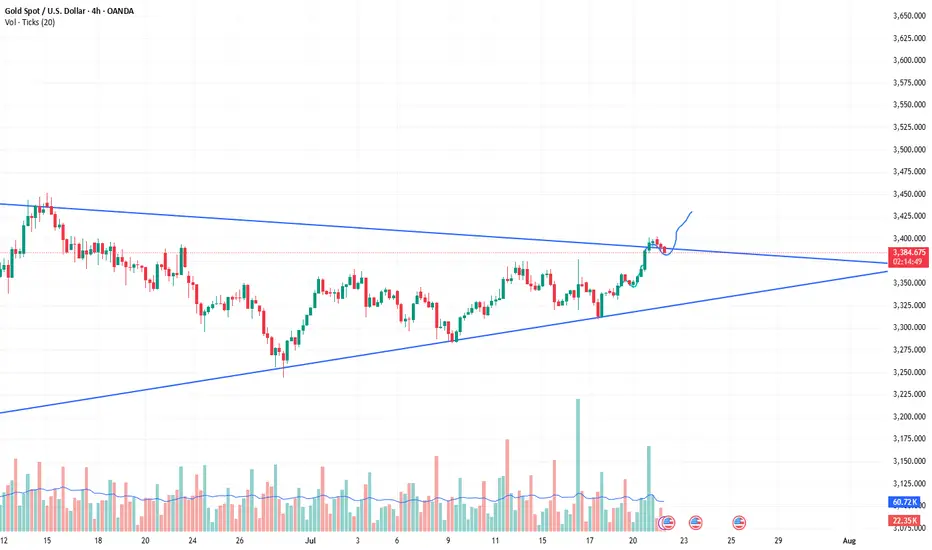
XAUUSD Technical Analysis – Triangle Breakout Ahead?Gold is currently consolidating in a symmetrical triangle pattern around $3,389. If it breaks above $3,402, we can expect a bullish continuation toward $3,420 and beyond. Key support lies at $3,367; a breakdown below this level would turn the trend bearish. The overall trend is still bullish, but a breakout is needed for confirmation.
📈 Potential Scenarios:
✅ Bullish Breakout Scenario:
- Break above $3,392–$3,402 zone.
- Targets: $3,420 > $3,450 > $3,480
- Supported by strong upward BOS (Break of Structure) and higher lows.
❌ Bearish Breakdown Scenario:
- Breakdown below $3,373–$3,367 zone.
- Targets: $3,355 > $3,345
- Would invalidate current bullish structure and form a lower low.
🔮 Trend Bias:
Bullish Bias remains intact as long as price stays above $3,367 and maintains higher lows. However, consolidation suggests waiting for breakout confirmation from the triangle before entering new trades.
🧭 Trend Outlook:
Gold is currently consolidating in a symmetrical triangle pattern, which typically precedes a breakout — either upward or downward. The price is holding above the key Fibonacci support levels and the overall market structure is bullish, suggesting an upward continuation is more likely if buyers maintain momentum.
Note
Please risk management in trading is a Key so use your money accordingly. If you like the idea then please like and boost. Thank you and Good Luck!

Gold prices soared! Gold hit a five-week high!Market news:
On Tuesday (July 22) in the early Asian session, spot gold rose and fell, and is currently trading around $3,390/ounce. Driven by the weakening of the US dollar, the decline in US bond yields and the increasing uncertainty in trade policies, the gold market broke out again, breaking through the $3,400/ounce mark, hitting a five-week high. As the deadline for the United States to impose new tariffs on global trading partners on August 1 approaches, market uncertainty provides strong support for international gold.In addition to the trade situation, the Federal Reserve's monetary policy trends have also added momentum to the rise in gold prices. The market expects that the probability of the Federal Reserve cutting interest rates in September has risen to 59%. The Federal Reserve's July meeting is expected to keep interest rates unchanged, but the market's expectations for an October rate cut have been fully digested. These policy uncertainties have further enhanced the attractiveness of gold as a safe-haven asset.This week, the London gold price ushered in a "critical node" market. Trade policy, US dollar fluctuations, central bank trends and safe-haven fund flows will become the core driving force of the long-short game in the gold market. On this trading day, Federal Reserve Chairman Powell delivered a welcome speech at a regulatory meeting. Pay attention to whether Powell involves remarks related to monetary policy. In addition, continue to pay attention to news related to the international trade situation and geopolitical situation.
Technical Review:
The gold daily chart is strong and oscillating upward. The MA10/7-day moving average maintains a golden cross and opens upward. The hourly chart and the four-hour chart Bollinger band open upward, the moving average system maintains an upward opening, and the price fluctuates upward along the MA10-day moving average. Yesterday, the Asian session fell slightly to 3346 and stabilized. The bottoming out and pulling up again broke through and stood on the hourly line middle track, which means short-term stabilization!
So yesterday's Asian session rose, the European session continued to break high, and the US session still had a second pull-up; but because it is in a period of oscillation, wait patiently for a wave of stabilization before taking action. The reference point selected should pay attention to the 382 split support, that is, 3370, which happens to be the top and bottom conversion support point, followed by the 3356-3358 split support and the middle track.
Today's analysis:
Gold rose strongly yesterday, breaking the highest level in the past month. After the price of gold rose yesterday, it did not rise and fall like before. Instead, it broke through multiple resistances and came to the 3400 mark. From the one-hour market, the direction of the market is very clear, but it is still not recommended to buy directly. Waiting for a fall before getting on the train is the safest strategy!The Asian session gold price was blocked near 3400, and the one-hour market showed a small double top structure, which means that the market will still adjust in a short time. Therefore, do not buy in the Asian session, wait for the adjustment to continue to buy, and the support below is the top and bottom conversion position of 3370. After the Asian session gold price adjusted to 3370 and walked out of the bottom structure, continue to buy. The general direction of this round is to look at the 3450 line!
Operation ideas:
Buy short-term gold at 3375-3378, stop loss at 3366, target at 3400-3420;
Sell short-term gold at 3425-3428, stop loss at 3436, target at 3390-3370;
Key points:
First support level: 3383, second support level: 3370, third support level: 3358
First resistance level: 3403, second resistance level: 3416, third resistance level: 3428

Gold----Buy near 3374, target 3399-3420Gold market analysis:
Yesterday, Monday, gold rose strongly, reaching a high of around 3402. This range is still relatively rare at the beginning of the week. Let's not worry about whether it is caused by fundamentals. Judging from the market's morphological indicators, we can be very sure that it is a buying trend. Yesterday's buying has broken the 3377 position. The breaking position of this position has determined the new buying position. In addition, the daily moving average has also begun to diverge. The morphological support is around 3370 and 3374. Today, relying on this position, the moving average is bullish. Yesterday, it rose too much. I estimate that there will be a need for repair today. The retracement during the repair is our opportunity to get on the train again. On the weekly line, 3400 is a hurdle. The previous multiple stops were only short-lived, so we need to be cautious when buying above 3400.
There is a signal of closing negative in 4H. The Asian session needs to be adjusted and repaired. It is better to buy at a low price. 3402 is a small pressure. We cannot estimate where it will be repaired. We can determine the support below and buy near the support. There can also be short-term selling opportunities above 3400 in the Asian session. It is only in the Asian session, and the buy order is the main target.
Fundamental analysis:
There is no major news in the recent fundamentals. The situation in the Middle East is still relatively stable. There is no new rest in tariffs, and the impact on the market is limited.
Operation suggestion:
Gold----Buy near 3374, target 3399-3420

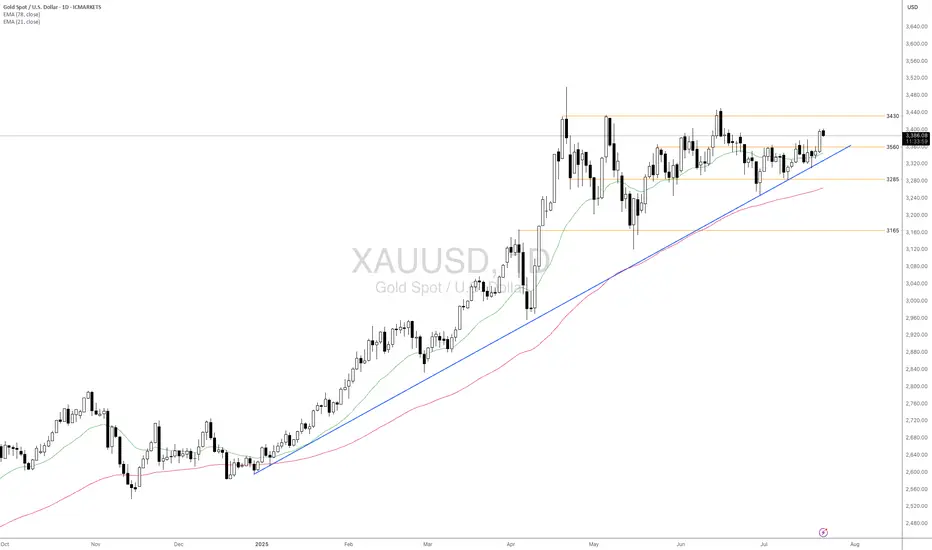
Will The Emerging Uncertainties Support Gold Ahead?Macro approach:
- XAUUSD advanced this week, supported by broad-based US dollar weakness and reviving safe-haven demand amid rising global trade tensions. The yellow metal briefly reached a five-week high as investors sought safety following headlines of escalating US tariffs and uncertainty over the Fed’s policy direction.
- Gold may remain well-supported if risk aversion persists, with upcoming global PMIs and further US trade developments set to guide market direction. Additional Fed commentary and central bank actions could trigger new volatility for XAUUSD throughout the week.
Technical approach:
- XAUUSD remains above both the EMA21 and EMA78, reflecting ongoing bullish momentum. The recent price action shows consolidation below the resistance at 3430 after rejecting the swing high. In contrast, higher lows have formed above the ascending trendline and the support at 3285.
- If XAUUSD stays above the support at 3560, it may extend towards the previous swing high at around 3430 and open for another record high.
- On the contrary, if the price drops below the support at 3560 and the ascending trendline, it may retreat toward the following support at 3165.
Analysis by: Dat Tong, Senior Financial Markets Strategist at Exness
Gold Could Extend Rally if Breaks 3,400📊 Market Overview
Gold is currently trading around 3,400 USD/oz, up approximately +1.41% over the past 24 hours.
The upward momentum is supported by a weakening US Dollar following dovish-leaning remarks from the Fed, along with growing demand for safe-haven assets amid trade uncertainties.
📉 Technical Analysis
• Key Resistance: ~3,400–3,405 USD (psychological zone; a break above could open the path for further gains).
• Nearest Support: ~3,370–3,375 USD, followed by 3,345–3,350 USD, which marks today’s low.
• EMA 09/20: Price is currently trading above both EMA 9 and EMA 20, confirming a short-term uptrend.
• Momentum / Oscillators: RSI is in the overbought zone; MACD and ADX still show a “buy” signal → bullish trend continues, but watch for possible technical pullbacks.
📌 Opinion
The price may continue to rise if it breaks above the 3,400 USD/oz level, especially if the USD remains weak and safe-haven flows continue to support gold. However, if there’s short-term selling pressure or a USD rebound, gold may pull back toward the 3,370–3,375 USD support zone.
💡 Trade Setup
SELL XAU/USD at: 3,400–3,405 USD
🎯 TP: 3,380 USD
❌ SL: 3,410 USD
BUY XAU/USD at: 3,370–3,375 USD
🎯 TP: 3,390–3,395 USD
❌ SL: 3,360 USD
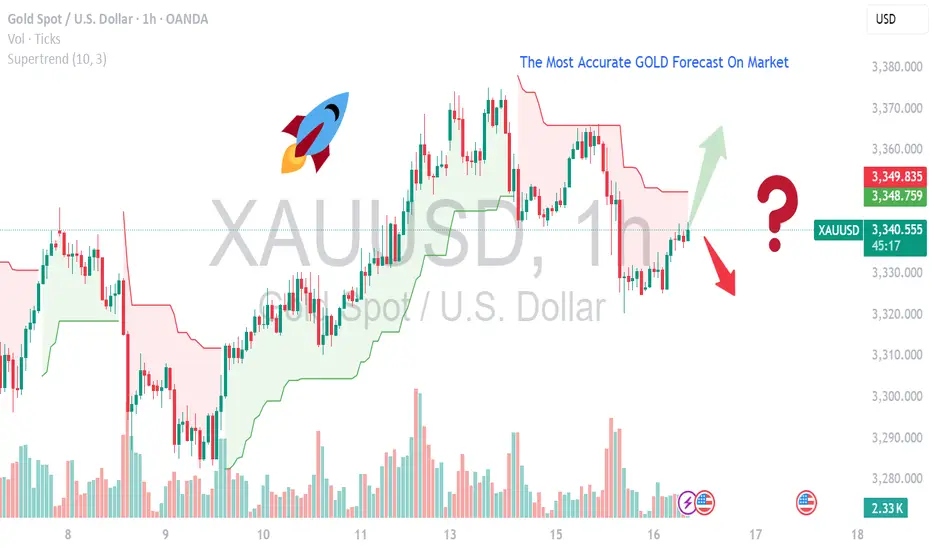
MOST ACCURATE XAUUSD GOLD FORECAST ANALYSIS MARKETCurrent Setup & Technical Outlook
Consolidation & Pennant Formation: Gold is building a bullish pennant and trading above its 50‑day MA — a classic continuation pattern suggesting a breakout toward new highs if momentum resumes .
Key Levels:
Support: $3,330–3,340 — confirmed by multiple technical sources .
Resistance/Breakout Zone: $3,360–3,375 — clearing this could trigger a rally toward $3,400+ .
Upside Targets: $3,390, then possibly $3,500–$3,535 per weekly forecast .
Alternate Bearish Scenario: A failure around the 0.618 Fibonacci resistance (~$3,374) and overbought RSI could spark a pullback to $3,356 or lower .
---
🧠 Fundamental Drivers
Inflation & U.S. Macro Data: Market awaits June CPI/PPI and Fed commentary — cooler inflation could boost gold via dovish expectations, while hotter data may strengthen the USD and weigh on bullion .
Geopolitical & Safe-Haven Demand: Trade tensions (e.g., tariffs) are keeping gold elevated near $3,350–$3,360 .
Central Bank & Real Yields Watch: Continued gold purchases and lower real rates are supportive, although mid-term easing in risks (like global trade) could curb momentum .