Gold Trade Setup Eyes on 15M Demand ZonePrice is coming close to 3338, where we have a 15-Minute Order Block (OB) 📍. This is a fresh demand zone and can give a bullish reaction when price taps into it 🟢.
📌 Plan:
We will wait for price to tap the OB ✅
If we see bullish signs like rejection wicks or bullish candles, we will enter a buy 📈
Our target will be near 3366, just below the bearish FVG 🎯
Goldlong

xauusd:Going long can lead to making money.
This week and last week, we have been continuously recommending a bullish position. There is no doubt that you love trading. Welcome!

Falling correction, shorting in European session📰 News information:
1. Beige Book of Federal Reserve's economic situation
2. European and American tariff trade negotiations
📈 Technical Analysis:
Currently, gold continues to consolidate around 3340, and the daily MACD indicator is stuck to the zero axis. Two consecutive days of negative bars also indicate that the overall trend of gold is weak and volatile. The hourly Bollinger Bands are closing, with the upper band located near 3352. The corresponding positions of the upper pressure middle band and SMA60 are basically at 3335-3350, but it is expected to gradually decline over time. On the whole, there are no particularly clear trading signals at present. Both bulls and bears have certain opportunities. It is recommended to wait and see for the time being. Pay attention to the 3342-3352 area above. If the bearish trend is confirmed in the future, you can consider shorting when it rebounds here, with the target at 3330-3325. If gold retreats directly to 3325-3320 and gains effective support again, you can consider going long.
🎯 Trading Points:
SELL 3342-3352
TP 3330-3325
BUY 3325-3320
TP 3340-3350
In addition to investment, life also includes poetry, distant places, and Allen. Facing the market is actually facing yourself, correcting your shortcomings, facing your mistakes, and exercising strict self-discipline. I share free trading strategies and analysis ideas every day for reference by brothers. I hope my analysis can help you.
FXOPEN:XAUUSD TVC:GOLD FX:XAUUSD FOREXCOM:XAUUSD PEPPERSTONE:XAUUSD OANDA:XAUUSD
Pay attention to 3320, if it falls below, go long at 3310-3300The short order has been completed and profit has been realized. Now the 1H technical indicators show that there is still room for decline in the short term. Focus on the 3320 support. If it falls below 3320, the gold price is expected to reach the 3310-3300 area, which is also an ideal trading area for intraday long positions. There is nothing much to say. Follow the wolves and you will get meat. Currently, the brothers who follow me to trade have all made good gains.
OANDA:XAUUSD
The rebound is not a reversal, continue to shortGold showed a trend of rising and falling back and closing low on Tuesday. The highest intraday rise was 3366, and the lowest fell to 3320. The daily line recorded a medium-sized Yin line with a long upper shadow. The K-line was negative, and the closing line broke the resonance support of the middle track and the short-term moving average, suggesting that the bullish momentum has slowed down and the bears are ready to move. Today, we need to pay attention to the further downward performance of gold. From the 4H level, the price stood firm at the four-hour resistance position last Thursday, and then rebounded upward in the short term. Yesterday, the price fell below the daily support level. Currently, the short-term market is bearish, and attention is paid to the resistance in the 3340-3345 range above. In the one-hour period, the price is in short-term shock adjustment. On the whole, it will be treated as a shock decline before breaking yesterday's low, and the lower side pays attention to the 3225-3320 area support. In the short term, you can consider shorting at 3340-3350 in the European session, and look towards 3330-3320
OANDA:XAUUSD
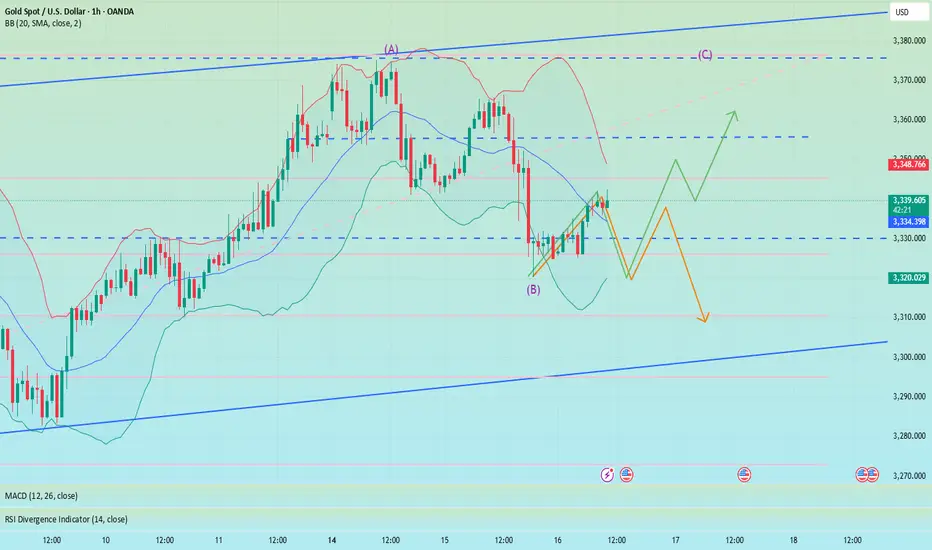
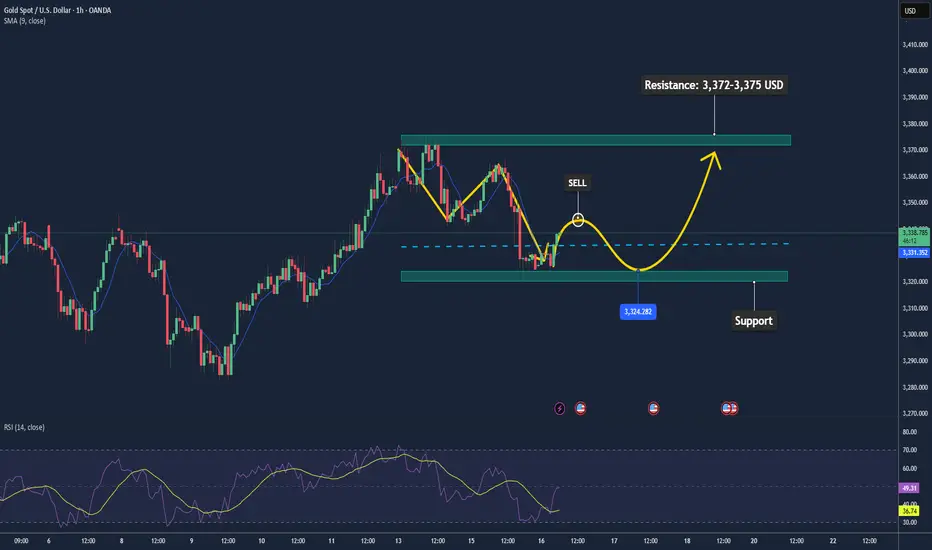
Gold Holds Key Support Zone📊 Market Summary
– Gold is currently trading at $3,338/oz, hovering near a key technical support level.
– US Treasury yields remain elevated and the USD is strong, both pressuring gold; however, ongoing concerns over US–EU/Mexico trade tensions continue to support safe-haven demand.
– The market is awaiting the upcoming US PPI data to determine the next directional move.
📉 Technical Analysis
• Key Resistance: $3,372 – $3,375 (23.6% Fibonacci zone – short-term ceiling)
• Nearest Support: $3,338 – $3,330 (tested and bounced at 3,338 per Oanda); deeper support at $3,325 – $3,320 if broken
• EMA 9: Price is below the MA20/50/100 but above MA200 (H1); EMA9 is flat, suggesting a sideways/consolidation trend
• Momentum / Indicators:
• RSI around 44–52 – neutral to slightly bullish
• MACD slightly positive; Stochastic above 50, hinting at short-term overbought conditions
📌 Outlook
– Gold is holding above the 3,338–3,330 support zone. If this level holds and rate-cut expectations strengthen, the price may rebound toward 3,372–3,375.
– However, if the USD continues to strengthen and PPI/CPI data surprises to the upside, gold could break support and head lower toward 3,325–3,320.
💡 Trade Strategy Proposal
🟣 SELL XAU/USD at 3,372 – 3,375
🎯 TP: ~ 40 / 80 / 200 pips
❌ SL: ~ 3,378
🟢 BUY XAU/USD at 3,330 – 3,333
🎯 TP: ~ 40 / 80 / 200 pips
❌ SL: ~ 3,327
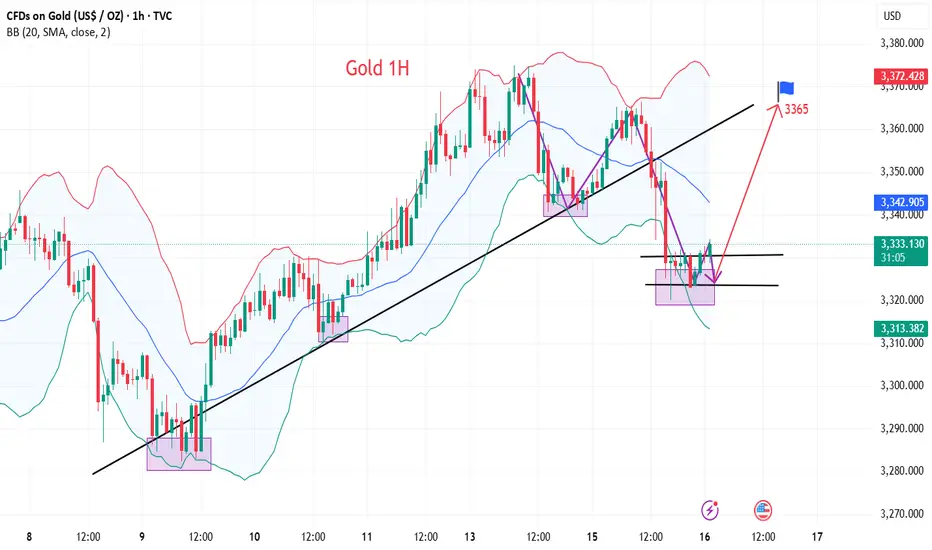
Gold Bullish Momentum
📈 XAU/USD Gold Technical Analysis – Smart Money Concept Perspective
🕒 Timeframe: 1H | Date: July 16, 2025
Overview:
This analysis follows a Smart Money Concept (SMC) framework, focusing on market structure shifts, liquidity zones, and potential high-probability setups. Gold (XAU/USD) is showing signs of a possible bullish reversal after forming a clear accumulation zone near a significant low.
Key Highlights:
🔹 BOS (Break of Structure):
A bullish break of structure confirms a shift in momentum, indicating that the prior bearish trend might be weakening.
🔹 LL (Lower Low) and LH (Lower High):
The market previously formed a Lower Low, followed by a Lower High, maintaining bearish structure until the recent BOS occurred.
🔹 Accumulation Phase:
Price is consolidating in a defined accumulation range, suggesting smart money might be absorbing liquidity before a move higher. This zone may serve as the springboard for the next bullish leg.
🔹 Inducement:
An inducement zone lies just below the trendline support and accumulation range. It’s designed to trap early sellers before a bullish continuation.
🔹 POI (Point of Interest):
A key supply or mitigation zone lies around the $3,355.75 level. We expect price to move into this POI before reacting.
🔹 Target:
If price successfully clears the POI and confirms strength, the projected target is in the $3,375–$3,380 zone based on confluence from upper channel resistance and previous structure.
🔄 Forecast Path:
Short-Term Pullback: Price may dip slightly to mitigate the inducement zone near trendline support.
Bullish Breakout: Strong impulse toward POI.
Reaction from POI: Potential minor retracement before a continuation toward the target.
🧠 Market Psychology Insight:
This setup reflects smart money accumulation and manipulation at its core — inducing retail traders into short positions before a potential bullish move. Watch for confirmations like bullish engulfing candles or break of lower highs on smaller timeframes.
📌 Conclusion:
Gold is poised for a possible bullish move after showing accumulation and breaking bearish structure. The $3,328–$3,335 range is key for entries, with the $3,355 POI and $3,375+ as targets. Manage risk and wait for confirmation before entering trades.
💬 Let me know your thoughts or drop your own chart ideas below!
📊 #XAUUSD #Gold #SmartMoney #TradingView #Forex #TechnicalAnalysis #SMC #PriceAction

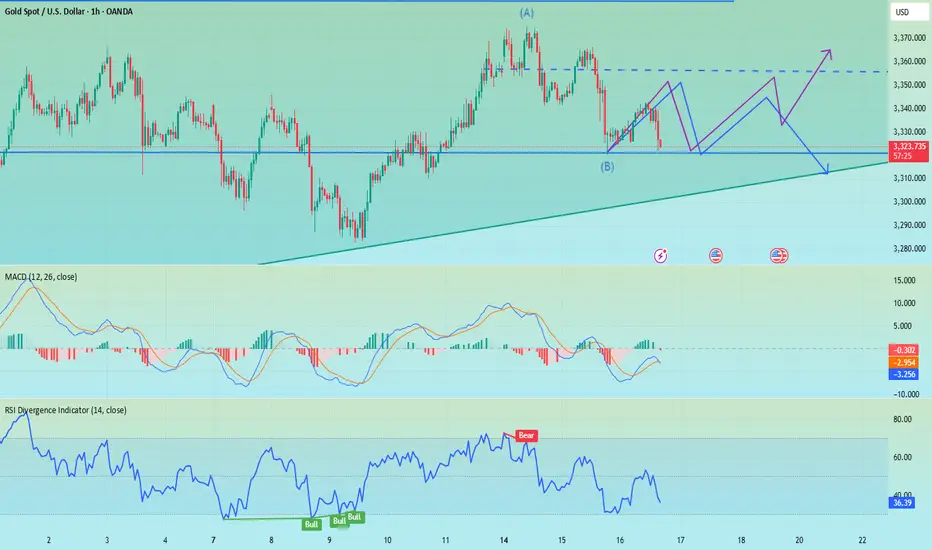
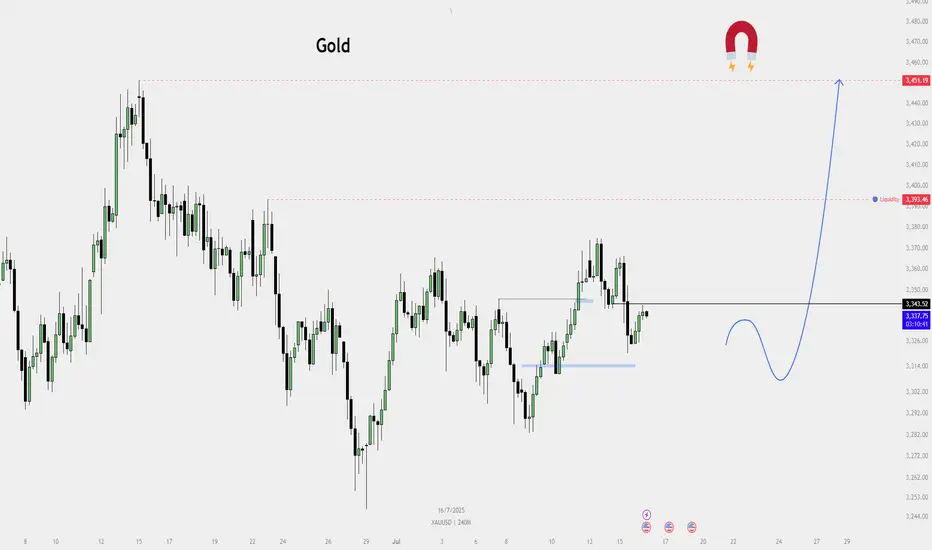
Gold Buy Plan - 16 July 2025📌 Gold Buy Plan - 16 July 2025
Timeframe: H4
Bias: Bullish
Structure: Market has formed bullish FVGs and is respecting demand zones.
🔍 Key Zones:
Demand Zone: 3,314 - 3,325 (Blue Zone)
Entry Range: Price expected to dip into demand zone before rally
Current Price: 3,343.52
Liquidity Target 1: 3,393.46
Liquidity Target 2: 3,451.19 (Final target / magnet area)
✅ Buy Setup Plan:
Wait for retracement:
Let price dip into the demand zone around 3,320–3,325.
Entry Trigger:
Look for:
Rejection candle in H1 or M30
Break of structure or bullish FVG formation
Engulfing candle from the demand zone
Buy Entry:
Around 3,320 ± few points (inside demand zone)
Stop Loss:
Below the demand zone: around 3,305
Take Profit Targets:
TP1: 3,393 (liquidity level)
TP2: 3,451 (magnet zone)
Risk to Reward:
From 3,320 to 3,451 → approx. 1:4 RRR
⚠️ Conditions to Invalidate Buy Plan:
If price closes H4 candle below 3,305, plan is invalid.
If price forms a bearish FVG after liquidity sweep, re-evaluate.
Gold (XAU/USD) Trading Analysis for July 16Support Zone: The market has found support around the 0.5 Fibonacci retracement level at 3,333.58. This could be a potential entry point for a long trade if the price bounces here.
Resistance Zone: The price action is approaching the 3,345.18 level, with a strong resistance around that zone. If the price breaks above this resistance, we could see further upward movement.
Price Action: We can observe an initial bullish movement followed by a correction. The price is currently in an uptrend, forming a series of higher lows and higher highs.
Fibonacci Levels: The 0.5 level at 3,333.58 has already acted as a support zone, and if the price retraces back here, this could be a good opportunity to enter long positions. The 0.618 level at 3,336.32 serves as a key resistance point. If price breaks above this level, it could indicate a continuation of the bullish trend.
Bullish Scenario (Long Entry): If the price retraces back to the 3,333.58 area (0.5 Fibonacci level) and shows signs of support (such as bullish candlestick patterns), consider entering long with a target at 3,345.18.
Bearish Scenario (Short Entry): If the price fails to break above 3,345.18 and forms a reversal pattern, you could consider shorting with a target near 3,320.
Risk Management:
Stop Loss: Place a stop loss just below 3,330, allowing for a small margin of error in case the price breaks through the support level.
Take Profit: Consider setting a take-profit at 3,345.18 for short-term moves or look for further price action if you're aiming for a longer-term trend.
Reminder: Always monitor the price action closely and adjust stop losses accordingly. The market is subject to volatility, especially during high-impact news events, so make sure to stay updated.

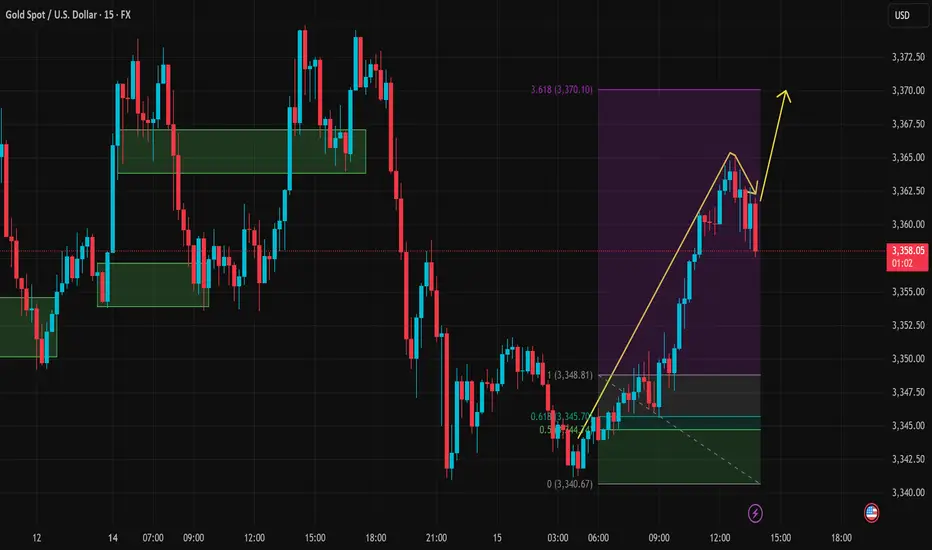
Gold XAU/USD Analysis for July 15, 2025: Trading Strategy and KeThe market is showing a strong upward trend, as indicated by the yellow trendline.
Fibonacci Retracement Levels:
38.2% Fibonacci Level: 3,344.79
50% Fibonacci Level: 3,344.47
61.8% Fibonacci Level: 3,347.91
Resistance Zone: The price is approaching a strong resistance level at 3,370 USD.
Technical Observations:
Gold is currently moving upward but is encountering resistance at 3,361. The price tested the 61.8% Fibonacci level and is now facing some resistance.
The Fibonacci levels suggest that if the price breaks above 3,362, the next target could be 3,370 USD.
Support Zone: If the price retraces, support may emerge near the 3,340 region.
Gold XAU/USD Trading Strategy:
Bullish Scenario:
If the price breaks above resistance at 3,362, the next target would be the 3,370 level. This could be a signal to enter Long positions near the 3,344 to 3,348 range, with a target around 3,370.
Bearish Scenario:
A retracement to the support level at 3,340 is possible. If the price drops below 3,340, further downside could be expected. In this case, a Short position could be considered if the price falls below 3,340, with a target near 3,330.
With the current upward trend, gold XAU/USD may continue to rise if it breaks the 3,362 resistance level, with the next target being 3,370 USD. However, if the price turns lower and drops below the 3,340 support level, the market may continue to decline.
Note: Be sure to monitor the Fibonacci levels and price behavior closely to adjust your trading strategy accordingly for today. If this analysis was helpful, don't forget to save it and follow for more trading strategies!
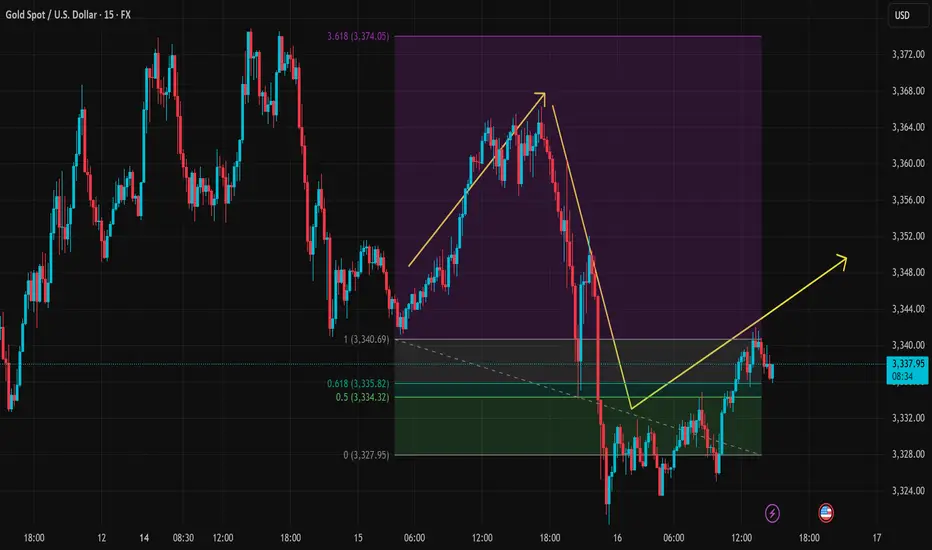
Gold Price Analysis Bullish Continuation PossibleBullish Trend Formation: We see a series of higher highs and higher lows forming on the chart, suggesting a potential continuation of the bullish trend. However, the market has recently pulled back from the previous peak at 3,340.69, which is now being tested as support.
Fibonacci Retracement Analysis:
The current pullback has reached the 0.5 level around 3,334.32, a strong support zone. This area could offer a potential long entry if the price reacts positively from here.
The 0.618 Fibonacci level at 3,335.82 is also significant, often acting as a final retracement level before the market continues its bullish move.
Support Testing: If the price holds above the 0.618 level, we could expect a price rally towards the resistance at 3,372.00, with possible extension above it.
Trend Continuation: If the price breaks below 3,335.82, consider watching for further downside potential with the next target being the 0.5 level, near 3,334.32.
Trade Strategy (Buy on Support):
Entry: Around 3,334.32 or 3,335.82 (depending on price action confirmation).
Target: 3,340.69 (next resistance zone).
Stop-Loss: Set just below the 0.5 Fibonacci level around 3,327.95 to manage risk effectively.
The current chart is showing a potential for a bullish continuation, with key support levels at 3,335.82 and 3,334.32, backed by Fibonacci retracement. Watching the price action around these levels will be crucial for entering a potential buy position.
Remember to adjust your strategy based on the actual market movements and confirm the trend with price action before making a trade.
Public short selling profit, NY short-term multiple layoutInterest rate futures data showed that the results were in line with our previous expectations, with a lower rate cut this month and a higher probability of a 25 basis point cut in September. In the short term, gold may first take profits and then rebound. NY session trading has just begun. Bros can pay attention to the 3335-3330 area below. If it falls back and stabilizes, you can consider participating in long positions, defending 3325 and targeting 3355-3365.
OANDA:XAUUSD
XAU/USD(20250716) Today's AnalysisMarket news:
Sources said that after Trump's latest trade tax threat, the European Central Bank will discuss a more negative scenario next week than expected in June. The ECB is still expected to keep interest rates unchanged at its meeting on July 24. Discussions on rate cuts are still postponed to September.
Technical analysis:
Today's buying and selling boundaries:
3353.05
Support and resistance levels:
3386.70
3374.12
3365.96
3340.13
3331.97
3319.40
Trading strategy:
If it breaks through 3353.05, consider buying in, the first target price is 3365.96
If it breaks through 3340.13, consider selling in, the first target price is 3331.97

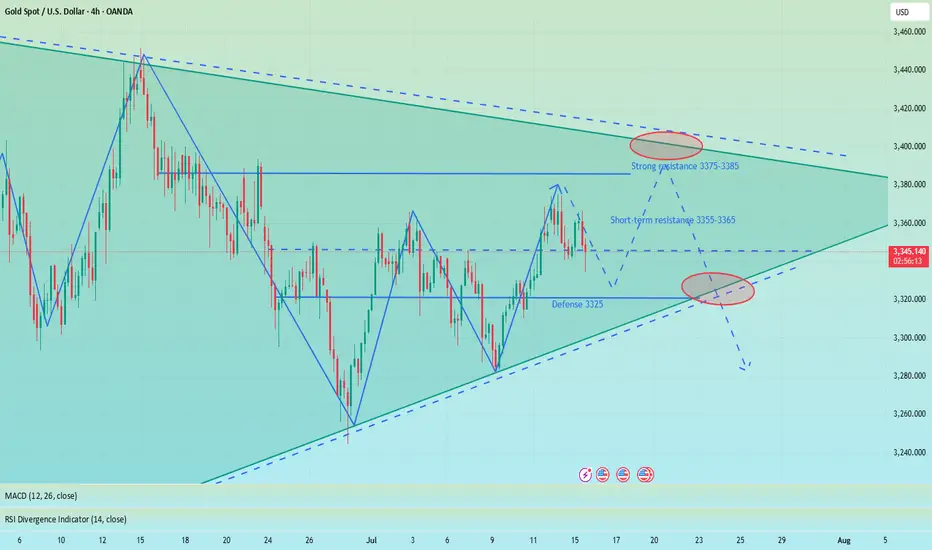
CPI triggers sell-off, 3330 can be short-term long📰 News information:
1. Focus on tomorrow's CPI data
2. Bowman's speech at the Federal Reserve
3. Tariff information outflows and countries' responses to tariff issues
📈 Technical Analysis:
The short-term trend flag pattern has been formed, and our short-selling strategy perfectly hits the TP. According to current news, Trump has once again urged the Federal Reserve to cut interest rates. While there is almost no possibility of a rate cut this month, there is a high probability that a 25 basis point rate cut will be completed in September, which is also in line with our previous prediction of market trends.
The big negative line in 4H pierced the middle Bollinger band. Although the CPI data is bullish, it has little impact based on the announced value. Market expectations have been digested in advance, so there is no room for a big drop. The upper points still focus on the short-term resistance of 3355-3365. If it rebounds to this area first in the short term, you can consider shorting again. Focus on the strong support of 3330 below. As long as the retracement entity does not fall below 3330, gold will rise again and touch the resistance line of 3375-3385.
🎯 Trading Points:
BUY 3335-3325
TP 3355-3365
In addition to investment, life also includes poetry, distant places, and Allen. Facing the market is actually facing yourself, correcting your shortcomings, facing your mistakes, and exercising strict self-discipline. I share free trading strategies and analysis ideas every day for reference by brothers. I hope my analysis can help you.
OANDA:XAUUSD PEPPERSTONE:XAUUSD FOREXCOM:XAUUSD FX:XAUUSD TVC:GOLD FXOPEN:XAUUSD
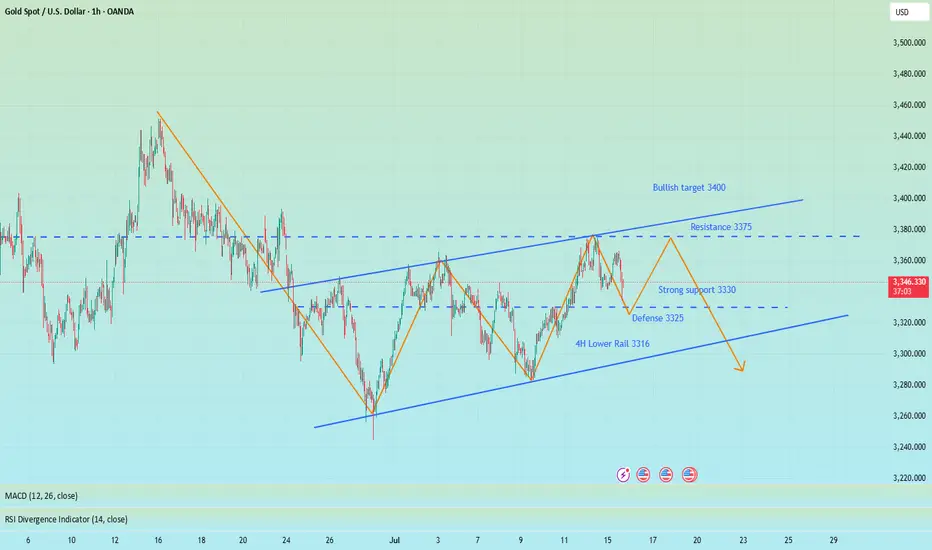
Beware of false decline and real rise of gold
💡Message Strategy
On Tuesday, the dollar index continued to rise, eventually closing at a high of 98.68, after a mild inflation report sparked speculation that the Federal Reserve might keep interest rates unchanged for the time being.
Spot gold gave up its intraday gains after the release of CPI data, once touching the $3,320 mark, falling for the second consecutive trading day.
📊Technical aspects
In the hourly chart, gold has already touched the support trend line overnight.
Therefore, at present, it may be inclined to rebound, and gold still maintains an upward trend as a whole.
However, the upper 3340-45 is a short-term suppression position. If it cannot stand firm and break through 3340-45 today, it is not ruled out that it will continue to maintain 3320-40 for consolidation.
On the contrary, as long as it can stand firm above 3345 today, then gold will really rise in the future.
It is very likely that the high point of 3375 at the beginning of this week may be refreshed.
Therefore, in terms of operation, I suggest paying more attention to 3320-30. After all, 3320 is the overnight low. As long as it is not broken again, the probability of gold rising is very high.
However, if it falls below 3320 again today, it is not ruled out that it will continue to refresh the low.
💰Strategy Package
Long Position:3320-3330,SL:3305,Target: 3365
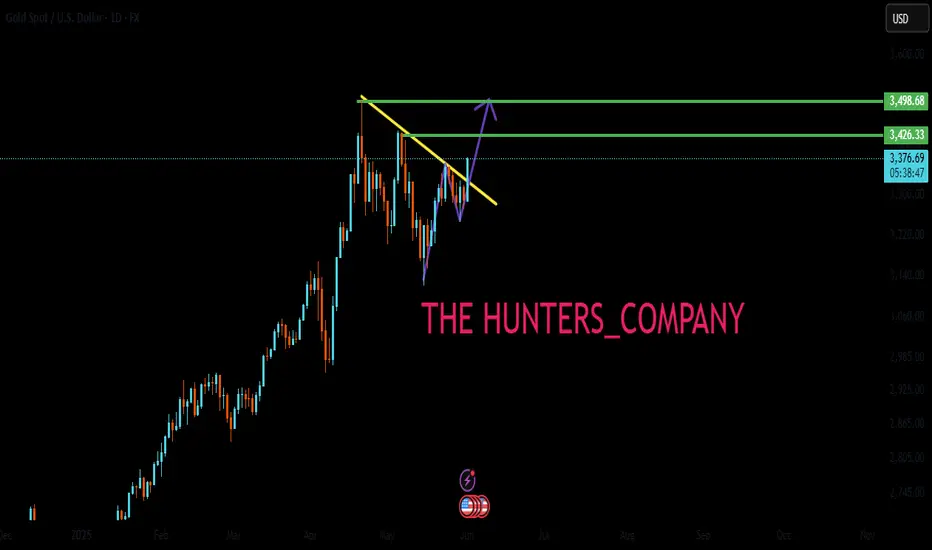
GOLD...Hello friends
Due to the entry of buyers and the strong breakdown of the indicated resistance, the price is expected to move to the indicated targets.
*Trade safely with us*
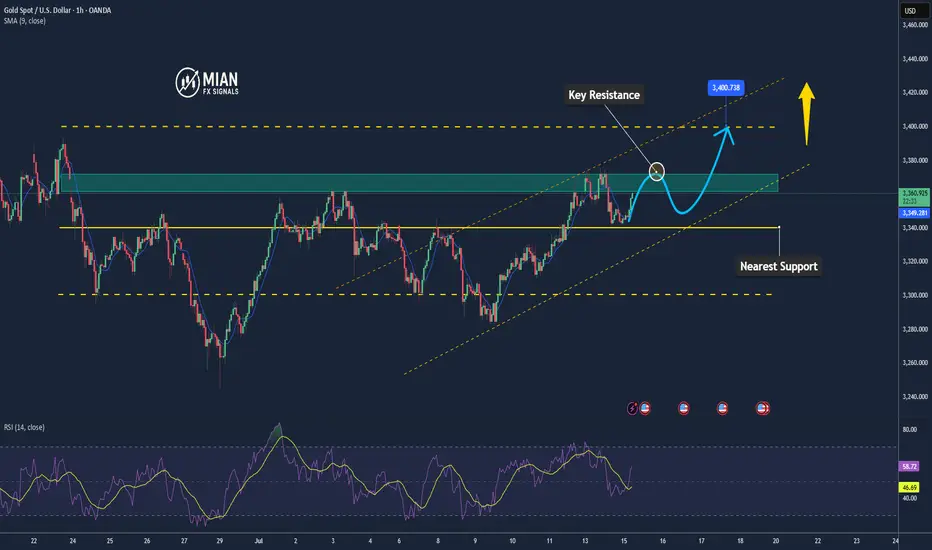
Gold Likely to Extend Gains as USD Weakens, but Faces Resistance📊 Market Move:
Gold surged to a three-week high near $3,370/oz, driven by safe-haven demand amid renewed trade tensions between the U.S. and EU/Mexico and threats of a 100% tariff on Russian imports.
Investors are now focused on upcoming U.S. CPI data, which could trigger sharp moves if inflation comes in below expectations.
📉 Technical Analysis:
• Key Resistance: ~$3,365–$3,372; a breakout could open the way to $3,400–$3,440
• Nearest Support: ~$3,340 (S1), then ~$3,326 (SMA50), and deeper at $3,300–$3,320 (Fibonacci zone)
• EMA: Price remains above short-term EMAs (20/50/100), suggesting a continuing bullish bias
• Candlesticks / Volume / Momentum:
• RSI is neutral-to-bullish around 54; MACD shows strengthening bullish momentum
• Bollinger Bands are narrowing, signaling potential for a breakout
📌 Outlook:
Gold may continue edging higher or consolidate around the $3,365–$3,372 resistance zone if no new geopolitical shocks occur. However, if U.S. CPI comes in below expectations or if USD/Yields weaken, gold could rally further toward $3,400–$3,440.
________________________________________
💡 Suggested Trading Strategy
🔻 SELL XAU/USD at: $3,370–3,373
🎯 TP: 40/80/200 pips
❌ SL: $3,376
🔺 BUY XAU/USD at: $3,340–3,337
🎯 TP: 40/80/200 pips
❌ SL: $3,334
XAUUSD:Continue to go long
The gold price has just fallen after being pressured by the 3365 level. Currently, there are no obvious signs of a bottoming out. However, the 3340-43 range is the support position from the previous several declines. Here, one can lightly participate in the bullish orders. If going further down, the 3330 level is an important support point. Both of these positions can be utilized to go long.
Then the trading strategy:
BUY@3340-43
TP:3360-65
If the price retraces to the 3330 level, increase the position of the long bet. The goal remains the same. I will keep you informed if there are any changes.
More detailed strategies and trading will be notified here ↗↗↗
Keep updated, come to "get" ↗↗↗
XAUUSD:Today's trading strategies for buying and selling
The gold price reached a peak of 3374.69 during the Asian trading session. Overall, it remains in a bullish uptrend. From the half-hour and hourly charts, the 30-day line provides support at around 3353. Therefore, when trading within this fluctuating range, it is important to note that in a situation where the bullish trend is strong, short selling should be conducted with a light position.
Trading Strategy:
BUY@3353-57
TP:3370-75
SELL@3375-80
TP:3360-63
More detailed strategies and trading will be notified here ↗↗↗
Keep updated, come to "get" ↗↗↗

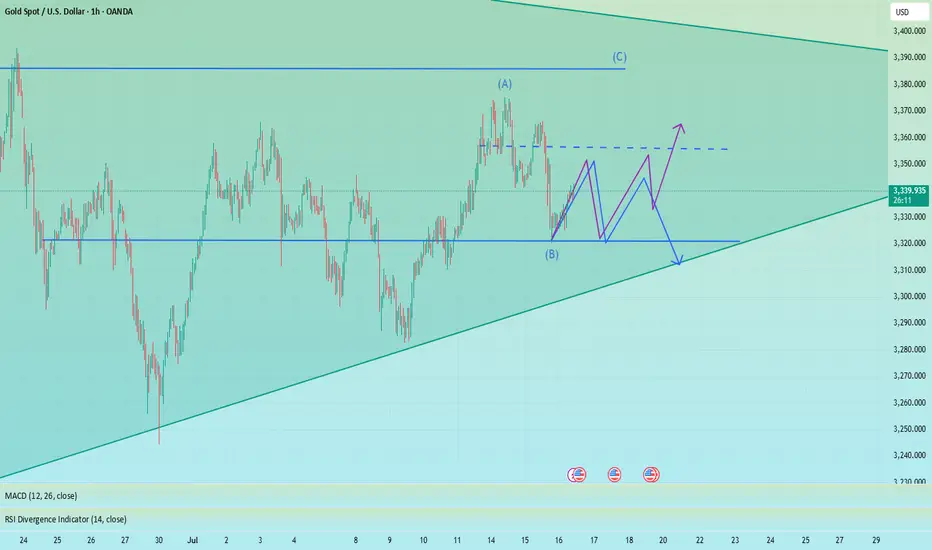
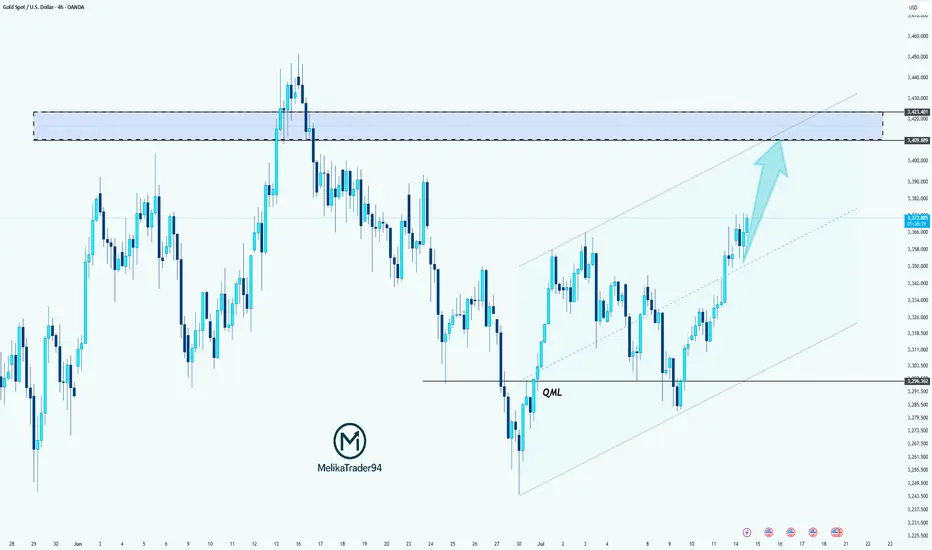
Gold Aiming Higher: Bullish Momentum Toward Key S&D ZoneHello guys!
The main bullish trend remains intact on Gold. After forming a solid base near the QML level, price has been respecting the ascending channel structure and is now pushing toward the upper boundary of that channel.
The current price action shows strength and momentum, and with the recent breakout above the midline of the channel, it signals that buyers are likely to push price toward the next key area of interest.
The target is clearly defined: the supply zone around 3409–3423, which has previously acted as a major resistance area.
Core idea:
Main trend: Bullish
Structure: Ascending channel
Support confirmed: QML zone bounce
Current behavior: Price moving along the top of the channel
Target: 3409–3423 supply zone
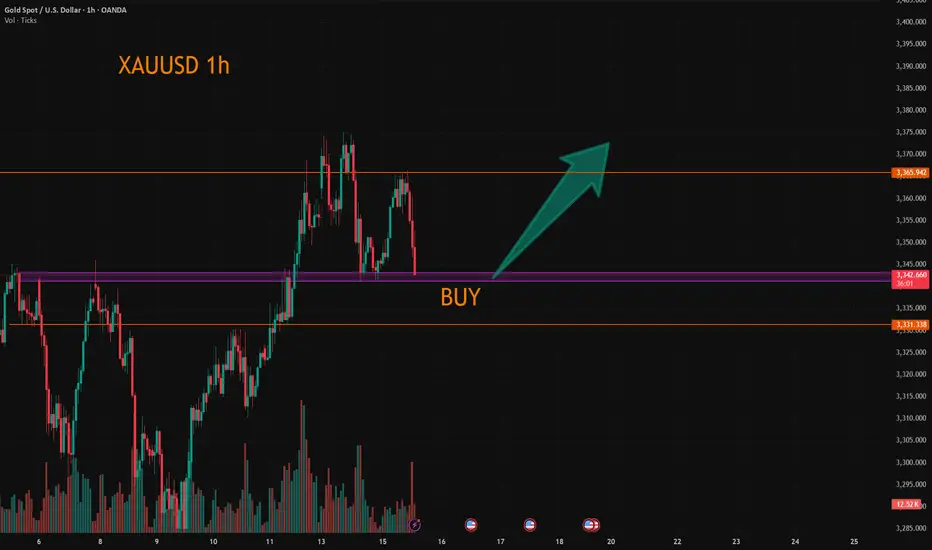
XAUUSD Trade Plan | 15 July 2025After observing the recent low breakdown and a clear liquidity grab, we saw a strong direction confirmation breakout. This suggests that the market is likely to continue its upward momentum.
🔄 Breakdown/Seller Trap triggered the reversal
🔹 Last Important Low respected
📈 Breakout confirms bullish direction
✅ Plan:
I’ll be watching for a pullback into the grey demand zone (highlighted area) for a potential long entry.
🕵️♂️ No FOMO — I’ll only enter after price shows clear bullish behavior in this zone.
🎯 Target: 3,365.89 resistance
📍 Entry Zone: Grey box (based on previous structure)
Let me know your thoughts — are you also watching this zone?
#XAUUSD #GoldAnalysis #LiquidityGrab #SmartMoneyConcepts #PriceAction #TradingPlan #TradingView

XAU/USD(20250715) Today's AnalysisMarket news:
Sources said that after Trump's latest trade tax threat, the European Central Bank will discuss a more negative scenario next week than expected in June. The ECB is still expected to keep interest rates unchanged at its meeting on July 24. Discussions on rate cuts are still postponed to September.
Technical analysis:
Today's buying and selling boundaries:
3353.05
Support and resistance levels:
3386.70
3374.12
3365.96
3340.13
3331.97
3319.40
Trading strategy:
If it breaks through 3353.05, consider buying in, the first target price is 3365.96
If it breaks through 3340.13, consider selling in, the first target price is 3331.97

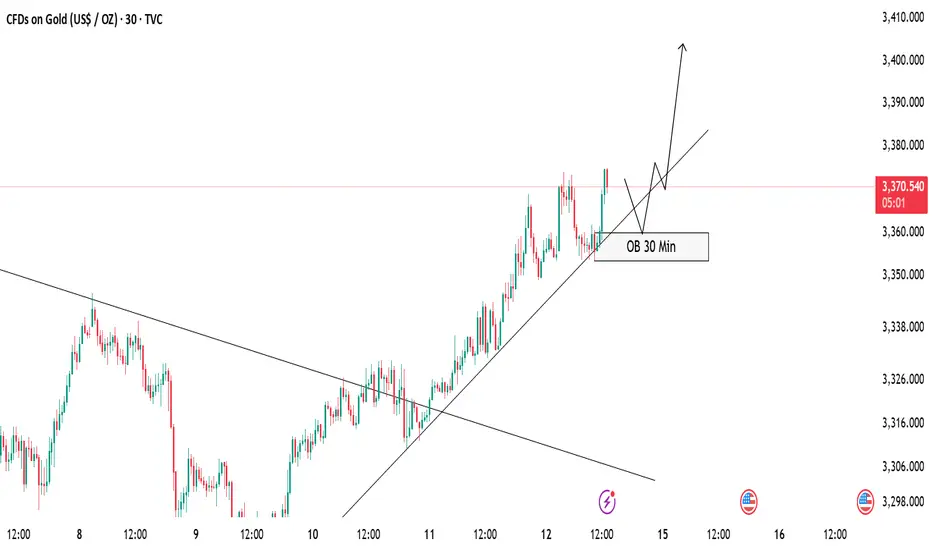
GOLD Buy Setup – OB Zone in FocusCurrently, gold is respecting the ascending trendline and maintaining a bullish structure 🟢. Price hasn’t tapped into the 30 Min Order Block (OB) yet, but we are expecting a potential pullback into this OB zone 📍.
✅ Our Plan:
We will wait patiently for price to mitigate the OB.
After the tap, we will look for bullish confirmation (rejection wick, bullish engulfing, or break of minor structure) before entering a buy position 🚀.
As long as the trendline holds, we remain bullish on gold.
📝 Invalidation:
If price breaks and closes below the trendline and OB zone, we will stay out or re-evaluate the setup ❌.
Stay disciplined and follow the plan! 💪