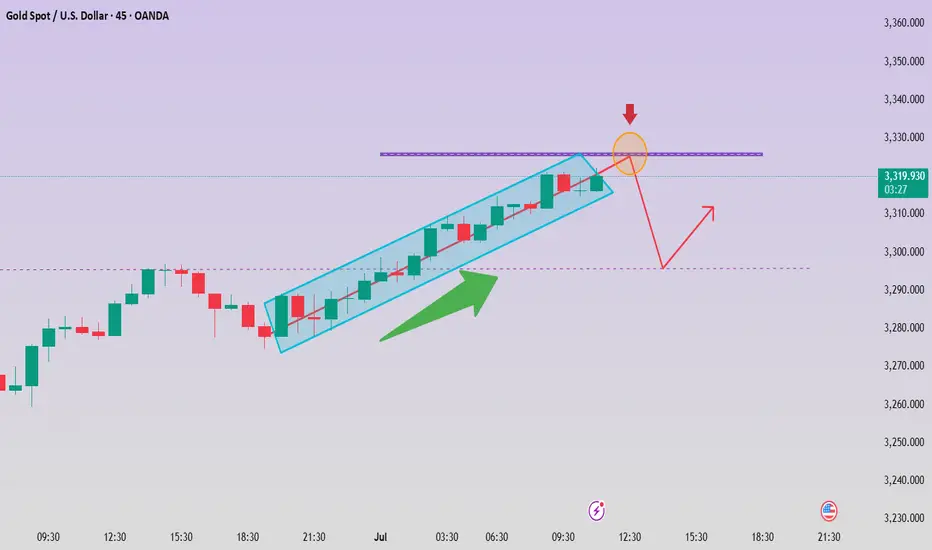
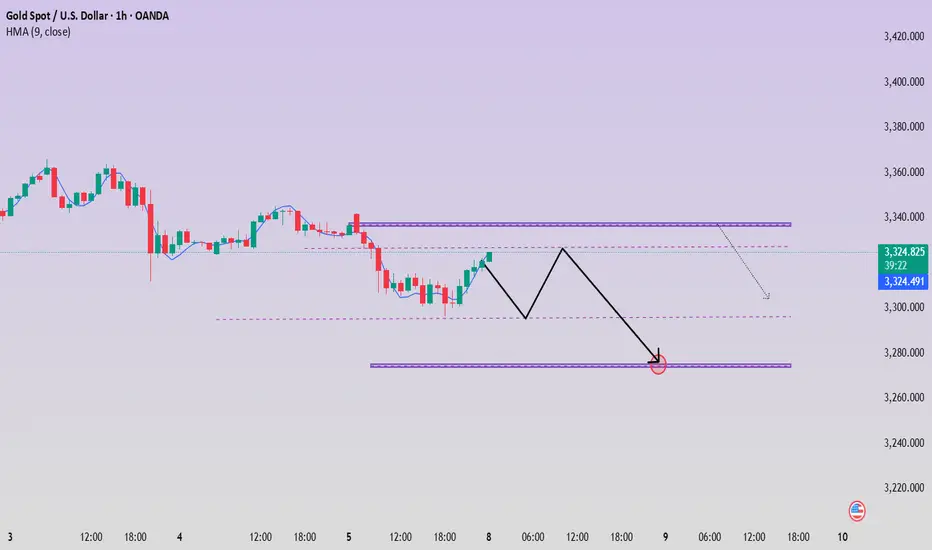
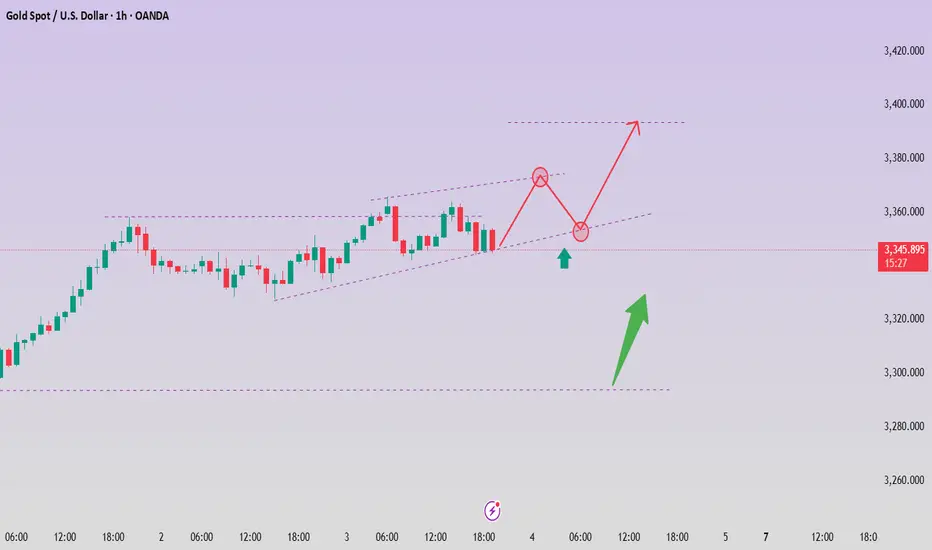
How to accurately grasp the gold trading opportunitiesGold was greatly affected by the positive non-farm payroll data, and it rose strongly, with the increase completely covering all the losses this week. The current gold trend has completely reversed the previous bull-short balance. After breaking through the 3300 level and rising to around 3355, it maintains strong upward momentum, and the possibility of further testing the 3360-3375 area cannot be ruled out. Due to the strong positive data, if everyone fails to chase the long position or set a breakout long position in time in the first wave of the market, the subsequent pullback opportunities may be relatively limited, so it is necessary to maintain an active strategy in operation. It is recommended to continue to be bullish when it retreats to the 3335-3320 area, and the upper target is the 3360-3375 pressure range.
Goldlongterm

XAUUSD: BUYThere are some good trading opportunities in the market. That's when to buy. Gold prices haven't fallen further since falling back to 3390. There's no further negative news. Therefore, there won't be a significant short-term decline. Our focus will be on tomorrow's non-farm payroll data update. This is a crucial factor that can cause gold prices to rise or fall significantly in the short term.
I'll update you with real-time buy and sell opportunities. This is based on research from the Swing Trading Center. It's highly authoritative. Don't miss out! Remember to stay tuned.
XAUUSD: BUY 3292-3282 TP 3320. SL 3265

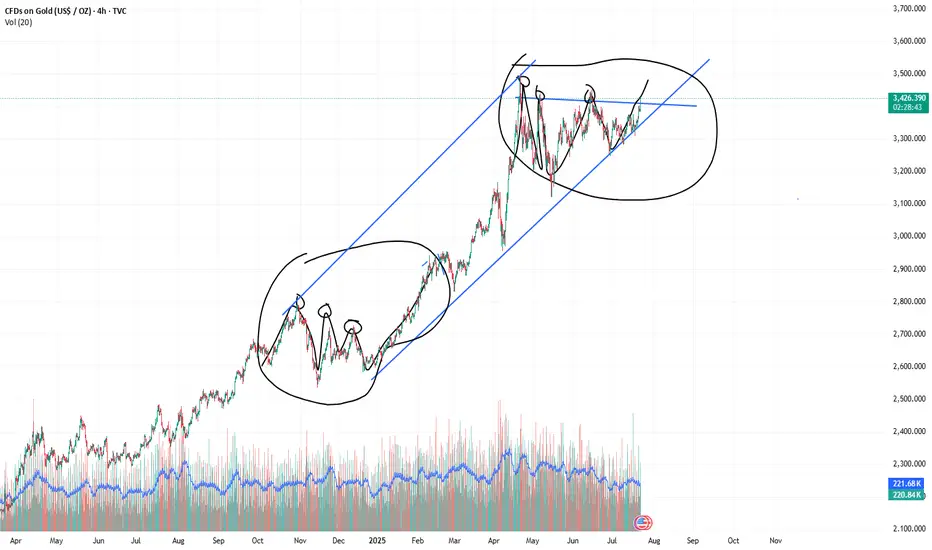
Gold - The diligent top formation!🏆Gold ( TVC:GOLD ) finished the bullrun:
🔎Analysis summary:
For the past 10 years, Gold has been trading in a very strong expected bullrun. Just like we witnessed it in 2011, a 10 year bullrun is followed by a shorter term bearmarket. Gold is starting to lose its strength, which is a clear sign of weakness and the beginning of a bearish reversal.
📝Levels to watch:
$2.800
SwingTraderPhil
SwingTrading.Simplified. | Investing.Simplified. | #LONGTERMVISION

Still a chance for gold bulls?
💡Message Strategy
The gold market was volatile this week, and gold prices ultimately closed lower for the week.
Gold prices have failed to stabilize above $3,400 an ounce after a bullish breakout. The technical outlook highlights the recent indecision of gold bulls. Looking ahead to next week, the Fed's policy statement and US-China trade talks could trigger the next big move for gold.
These important factors may trigger the market next week
1. The Fed will announce its monetary policy decision after its policy meeting on July 29-30.
Before the Fed meeting, the U.S. Bureau of Economic Analysis will release its first estimate of annualized growth in gross domestic product (GDP) in the second quarter.
2. Next Friday, the U.S. Bureau of Labor Statistics will release the July employment report.
If the non-farm payrolls (NFP) increase by more than 100,000, it may indicate that the labor market is in good enough condition for the Fed to prioritize controlling inflation and support the dollar when making policies.
If the new non-farm payrolls data reaches or falls below 70,000, the dollar may find it difficult to find demand before the end of next week and help gold gain bullish momentum.
3. Market participants will be closely watching the headlines of the US-China negotiations.
If the two sides make further progress in trade and economic relations, risk flows may dominate the actions of financial markets, making it difficult for gold to find demand.
📊Technical aspects
The short-term technical outlook highlights the hesitation among gold buyers. The daily chart shows that the relative strength index (RSI) remains just below 50, and gold is struggling to move away from both the 20-day simple moving average (SMA) and the 50-day SMA after breaking above both levels earlier this week.
If the price of gold falls to the key support level of $3,310 and fails to break down (trend line support/Fibonacci 61.8% retracement level), it will force a large number of shorts to exit the market and may further test the $3,340 range (psychological level/Fibonacci 76.4% retracement level).
Combined with the current trend, the downward momentum of gold has weakened, and it is seeking support to restart the long position
💰Strategy Package
Long Position:3310-3320,SL:3290,Target: 3340
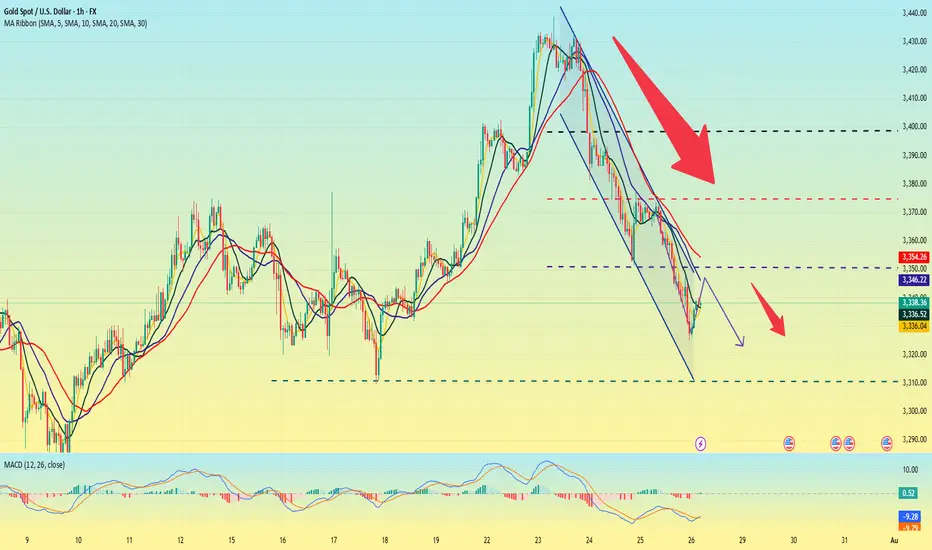
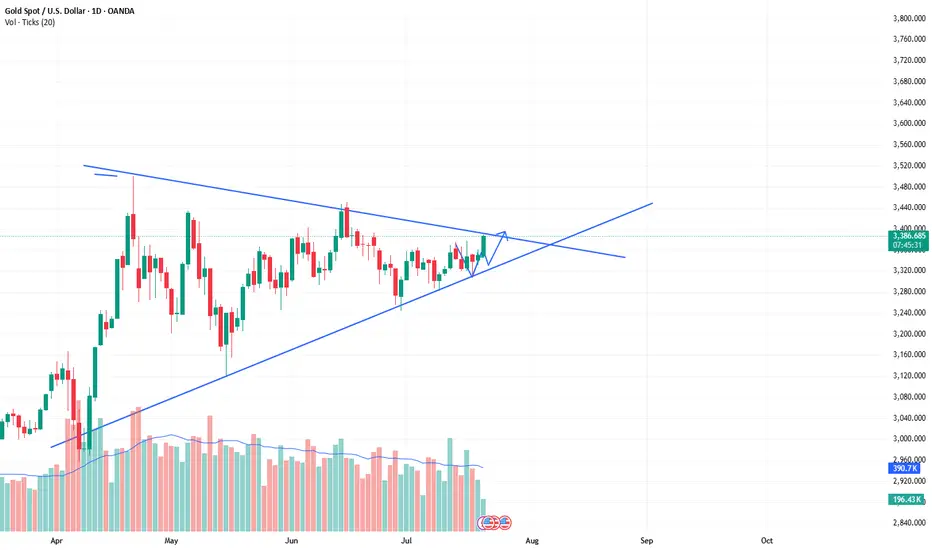
Gold is weak. It may break through next week.This week, gold rose and fell, rising for two consecutive days on Monday and Tuesday, and falling for three consecutive days from Wednesday to Friday. The weekly line finally closed with a small real body negative line with a long upper shadow.
Gold's trend this week was due to the strengthening of the US dollar and the progress in US-EU trade negotiations, which hit the safe-haven demand, leading to a decline in gold prices.
Next week, focus on multiple time points that may trigger market trends, including the Federal Reserve's decision, non-agricultural data, the August 1 tariff deadline, and the economic and trade talks between Chinese representatives in Sweden and the United States. These events may set the tone for the market in the second half of the year and need to be paid attention to.
At the beginning of this week, we focused on the triangular convergence pattern formed by the high and low points since 3500 points. On Tuesday, gold broke through the pattern upward, but failed to stand firm on Wednesday. Instead, it fell to form a false breakthrough, and on Friday it fell to the lower edge of the triangular convergence range. However, from the perspective of the international futures market, the overall situation is still in the triangular convergence pattern and has not achieved an effective upward breakthrough. Based on this, we need to continue to keep a close eye on the changes in the triangle convergence pattern next week. The direction of its next breakthrough will have an important impact on the short-term trend.
Operation strategy:
Short near 3350, stop loss 3360, profit range 3320-3315. If the price continues to fall, you can hold a small position, and the area near 3300 is likely to be touched.

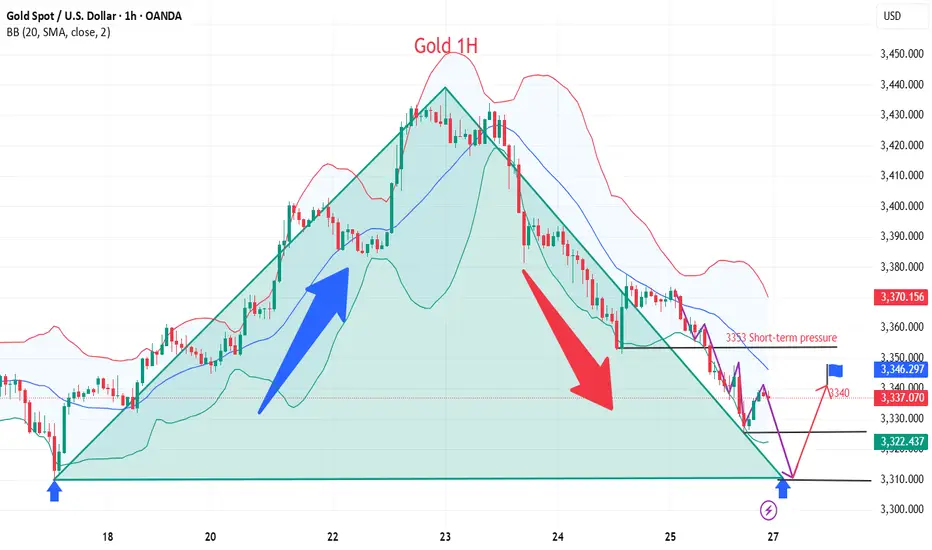
Gold is going down. It may continue next week.On the last trading day of this week, the bears attacked strongly and continued to refresh the recent lows, reaching the lowest point near 3325 before stopping.
From Monday's 3345 to 3440, it closed near 3337. This week, it also walked out of the large range roller coaster pattern, and all the strengths in the previous period did not exist. Under the continuous downward trend, the bulls were also vulnerable, and there was not even a strong rebound, which indirectly explained the strength of the bears in the short term.
As for the current trend, the bears are likely to continue to be strong, and before there is a symbolic upward breakthrough, we still need to maintain the idea of shorts to operate. The current upper pressure is maintained near 3350, which is also the bottom position touched for the first time in the previous period. It is possible that it will be transformed into a top-bottom conversion pattern; and the strong support level below is near 3310.
When the Asian market opens next Monday, we need to pay close attention to whether there is a gap problem on both the bulls and bears. After three consecutive negative daily lines, all the moving average systems have been broken, and it is also likely to form a resonance pressure pattern. On Monday, gold will first touch around 3350 and continue to short. The profit range will be around 3330-3320, and the stop loss will be 3360. If the European session is stronger, you can adjust the point before the US session.
XAUUSD: Fluctuation of $30/ounce. Do you want to know?Yesterday, I frantically notified followers to buy around 3366-3375, and the market finally rose to 3430. This is a huge profit. I will continue to update it in the Band Trading Center Research Institute later. If you don’t want to miss it, follow me. If you see it but are still not sure how to trade. Then you can leave me a message at the Swing Trading Center Research Institute. I will reply to you one by one when I see it.
This week, some followers have achieved weekly profits of 50%-268%. If your profit is not ideal. Or don’t know how to trade. Remember to like and follow. I will lead everyone to victory.
Buy around 3400-3410. When will it close? I will post the results on the Swing Trading Center. Stay tuned.
XAUUSD:3450-3500The probability of the same direction of the two histories is 95% similar. This shows one thing. The market may repeat history again.
So buy with me. The next target is 3450-3500
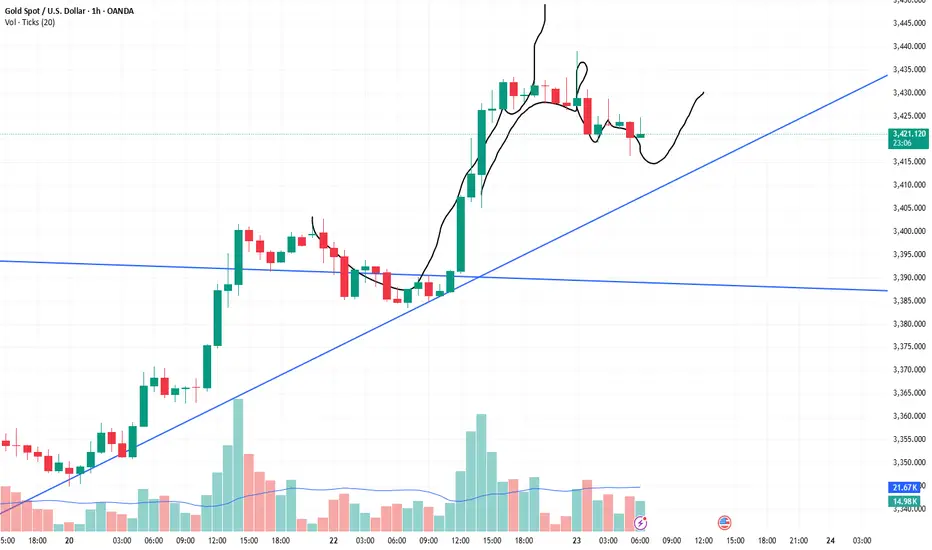
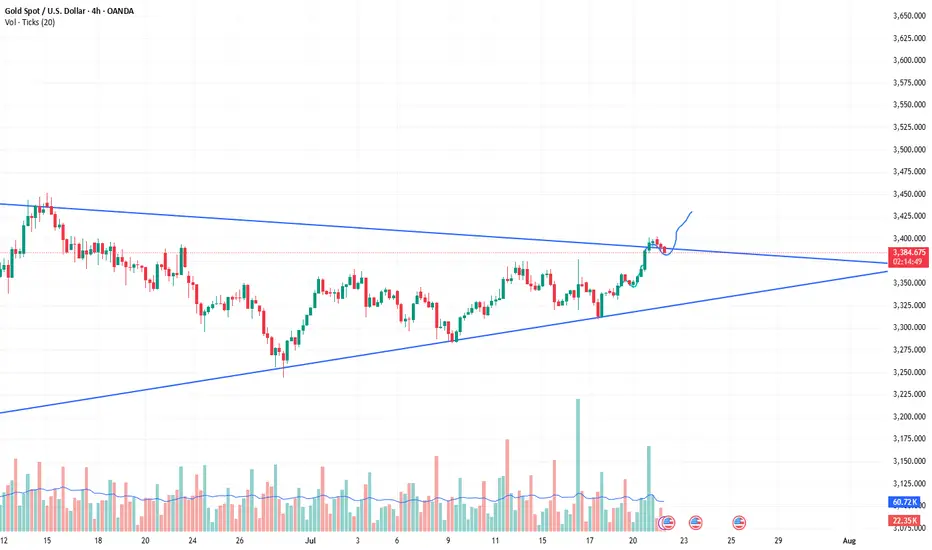
The bull market of xauusd continues, buy and wait for the rise.As predicted in the band trading center in advance over the weekend. The daily level trend is still very stable, and the breakthrough trend has been perfectly carried out. The current quotation is 3388. It is only a matter of time before it rises wildly to the position of 3430. The short-term will definitely break through. The current bull market is clear and has huge potential. The limit of the triangle consolidation phase is about to be broken. Then the bulls will continue to rise. Therefore, buying is the key operation plan.
XAUUSD:Retracement is a buying opportunityAfter the Asian market hit the highest position of 3403, there was some decline. The current gold price is 3386. From the short-term trend of the hourly level. It is still fluctuating at a high level. Combined with the trend of the daily level, there are signs of retracement and counterattack. There is no news dominance. It is purely a technical repair after hitting the high. This retracement can pay attention to the support near 3382-3378. The London and New York markets are still based on buying and profit.
In-depth analysis of gold price trends this week!Market news:
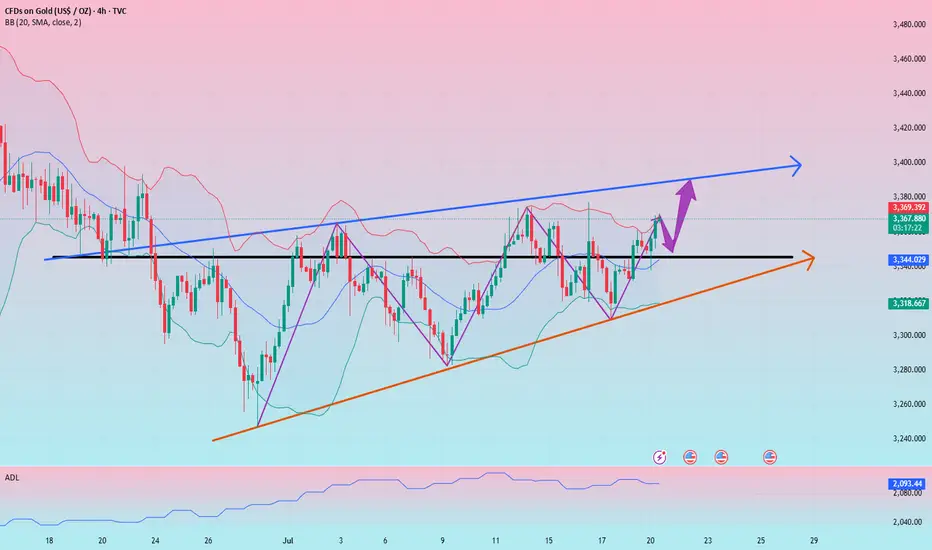
During the Asian morning session on Monday (July 21), the London gold price rose slightly to above $3,350 and is currently trading around $3,356/ounce. The weakening dollar and continued geopolitical and economic uncertainties have boosted demand for safe-haven spot gold, supporting international gold prices, but the rebound in the University of Michigan survey index may limit gold's gains.Although gold prices may face correction pressure in the short term, international gold has limited room to fall. Factors such as economic slowdown, lower interest rates and rising inflation will attract more buyers to enter the market. The continued purchases by central banks over the past two and a half years have also provided solid support for gold prices. The tension between Trump and Powell is the main reason why gold prices remain high.Looking ahead, the market focus will shift to this week's ECB monetary policy meeting. Economists generally expect the ECB to keep interest rates unchanged, and preliminary manufacturing data released this week may also trigger some market fluctuations. This week's economic data and Fed dynamics will be key variables in the trend of gold prices. No matter how the market fluctuates, the long-term value of gold cannot be ignored, and investors need to pay close attention to macroeconomic changes and political events.
Technical Review:
Technically, the daily chart of gold still maintains the adjustment of the middle track of the Bollinger Band, forming a yin-yang alternating shock consolidation. However, on Friday, the gold price closed with a small positive K, and the price MA10/7-day moving average closed above 33/42. From the indicator point of view, the MACD indicator momentum column shortened, and the RSI indicator ran around 50, indicating that the market buying and selling forces were balanced.The 4-hour chart shows that the gold price fluctuated and tended to buy and consolidate at 3330-3360. At present, the moving average system opened upward. As long as gold does not lose 3320, it is expected to continue to sprint upward to 3375/3400. On the contrary, if it loses the support of 3320/10 again, it is regarded as a short-term weak shock downward. On the whole, the current trend of gold is oscillating and tending to buy and consolidate. Today's trading idea is mainly to buy at a low price and sell at a high price.
Today's analysis:
Since there is no major economic data this week, in the absence of geopolitical risks and emergencies, it is expected that gold will still see a small range of shocks and consolidation this week, and the range can be focused on 3400-3300. The daily Bollinger Bands continue to close, with the upper track at 3375 and the lower track at 3288. The short-term moving averages are intertwined near the middle track, suggesting that gold will still be dominated by fluctuations in the short term. In terms of operation, keep the idea of selling at high prices and buying at low prices. Do not chase the rise and sell at the fall. Wait for the breakthrough signal to be confirmed before following the trend. Today’s support is at 3340. You can use this as a key point to arrange buy orders during the day. The key point above is 3361, which is the high point of last Friday. 3361 is a short-term pressure point. If there is no correction today and it directly breaks 3361, we can follow the trend directly. If there is a correction, pay attention to the bottom structure above 3340 and buy at the bottom!
Operation ideas:
Buy short-term gold at 3340-3343, stop loss at 3332, target at 3370-3390;
Sell short-term gold at 3377-3380, stop loss at 3388, target at 3340-3320;
Key points:
First support level: 3340, second support level: 3332, third support level: 3320
First resistance level: 3375, second resistance level: 3388, third resistance level: 3410

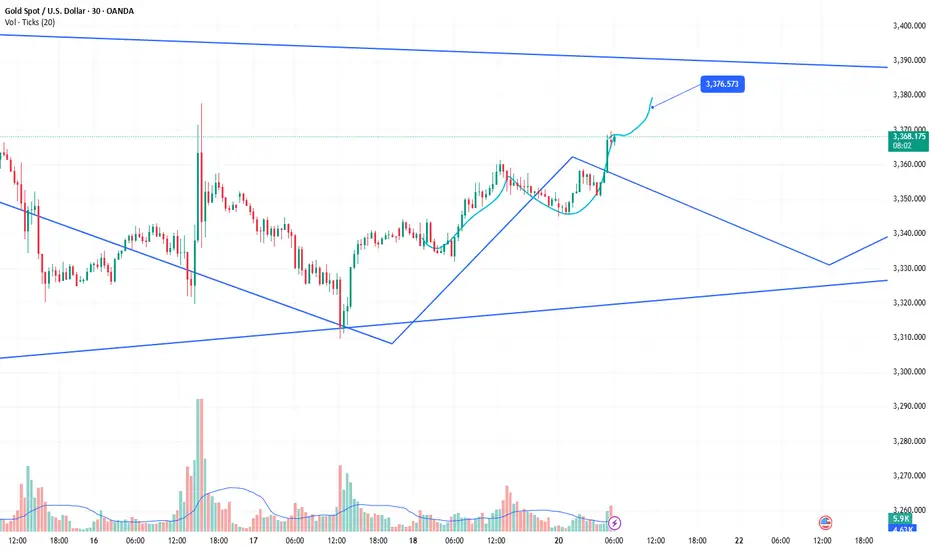
Ultra-short-term trading. Profit of $10/ounceThe order to buy XAUUSD successfully made a profit. The current gold price is 3367. Stimulated by the weekend news, the expected trend was achieved smoothly, and the short-term bulls were strong. Buying can continue to be the main focus. Relying on the half-hour and one-hour trends, trading can be carried out in the London market for the purpose of buying and profit. The increase is about $10/ounce.
Gold is rising steadily, finding the right buying point is the k
There are no eternal friends, only eternal interests. Value exchange is the "code" of interpersonal relationships. From the president to individuals, the game of interests is everywhere.
Half a year ago, Musk strongly supported Trump to take office. The two joined forces to win the swing states. One gained power and the other gained fame. After Musk became the head of the efficiency department, he made drastic reforms and fought corruption from the outside to the inside.
Now, the two have parted ways. According to US media reports on July 20, Trump began to review the order contract between Musk's Space X and the federal government. In just 6 months, the two went from close friends to opponents. The "big and beautiful" bill was also strongly resisted by Musk.
If the big guys are like this, let alone ordinary people, their butts determine their heads, sitting in different positions to think about different interests, emotions and friendship are just outer garments, Musk spent $270 million and got fame, and Trump also got the power he pursued, there is no right or wrong.
This struggle is far from over. It is estimated that the game will continue during Trump's four years in office. Musk stands on the high-dimensional pursuit of interests for the exploration of human progress, while Trump's slogan is to make America great again. The two people have taken different routes.
What we care about is not the right and wrong of the two, but whether this right and wrong will bring turmoil to the financial market. Will Tesla be the "prince in distress"? Is there a possibility of bargain hunting after the stock price plummets in the short term? Will the gold market trigger risk aversion because of Trump's unpredictable approach? This is what we need to ponder and study.
Okay, let's talk about the gold market today:
During this period, the volatility of the gold market has become smaller and smaller, and the range of fluctuations has also been compressed. The sentiment of investors in the market is relatively low. When the fluctuations just started in April, some people who were trapped were concerned about when to get out of the trap every day. After 3 months, everyone is tired, and the fight between bulls and bears has cooled down.
However, as the shock is coming to an end, the gold price may explode into a new round of unilateral market at any time due to fundamentals, especially on August 1, Trump will implement equal tariffs on global trading partners. This king bomb has been delayed. Once it starts to land, it will inevitably cause turmoil in the financial market.
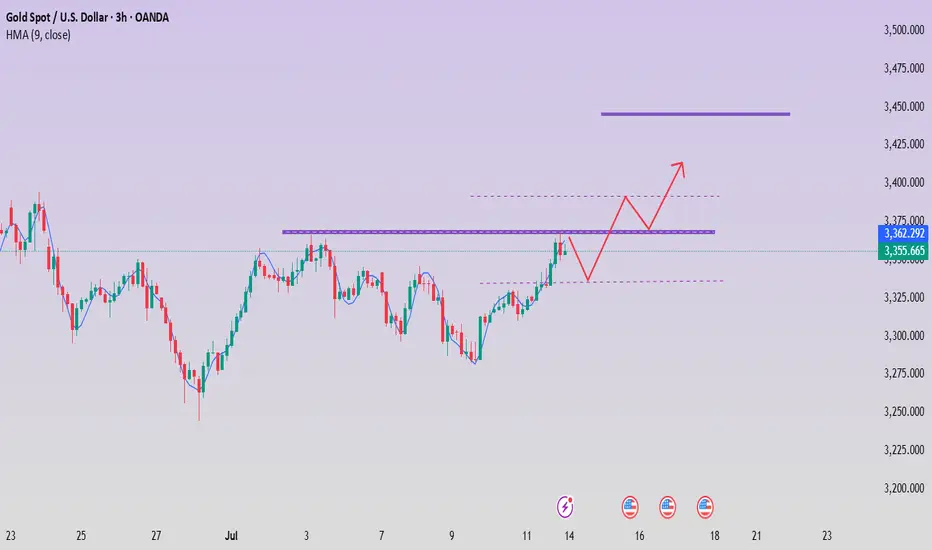
Since last week, affected by Trump's threat to fire Fed Chairman Powell, the gold price quickly hit the high of $3,370 and then fell back to $3,310. After that, the price lows continued to rise and rebounded. The top and bottom conversion of $3,345 in the morning and the support of the low point in the early morning of last Friday were the starting points for the rise. Today, the focus is on the long-short dividing point of $3,345, that is, the price is temporarily not empty above $3,345. Today is not a sharp rise at the opening. The prerequisite for a sharp rise must be that $3,345 breaks.
Today, I think that 3345 USD should be used as the dividing point between long and short positions, that is, your stop loss should be placed below 3345, and then find a position to go long, such as within the range of 3360-55, first look at 3370-75 above, and then look at 3392-95 USD after breaking through. Some people say that they dare not do such a large stop loss? In fact, just reduce the position. The stop loss space is dynamically adjusted according to the support level. Fixed stop loss space is a false proposition.
Gold rises after brief recovery
Let’s review the gold price for next week from July 14, 2025 to July 18, 2025
⭐️Gold Information:
Gold prices surged nearly 1% on Friday as sentiment soured over U.S. President Donald Trump’s controversial trade policy targeting Canada, while hinting at broader tariffs on other countries and copper. At the time of writing, XAU/USD was trading at $3,354, rebounding from an intraday low of $3,322.
On Thursday, Trump announced a 35% tariff on Canadian imports, but goods eligible under the 2020 USMCA trade agreement remain duty-free. He also expressed his intention to extend tariffs to most trading partners, proposing a basket of rates ranging from 15% to 20%.
With a light U.S. economic calendar, attention turns to comments from the Federal Reserve. Chicago Fed President Austan Goolsbee dismissed calls for rate cuts aimed at reducing government borrowing costs, stressing that the central bank's focus remains firmly on employment and price stability.
⭐️Personal Comment:
Growth with the trend, maintaining the accumulation price zone above 3300
🔥 Technical:
Based on the resistance and support levels of gold prices on the 4-hour chart, NOVA has identified the following important key areas:
Resistance: $3392, $3447
Support: $3330, $3308, $3246
Trump's tariff news stimulates gold to explode!
📌 Driving Events
Gold prices rose for the third consecutive day and are expected to close higher this week. The trend turned in favor of gold buyers as tariff tensions intensified. US President Trump announced new tariffs, exacerbating concerns about a trade war.
📊Personal Comments:
Signs of instability in Trump's trade policy have once again hit investor confidence, reviving safe-haven demand for gold. In the absence of any top US economic data, the market will continue to focus on trade headlines. Weekend fund flows may also drive gold price movements.
⭐️Set Gold Price:
🔥Sell Gold Area: 3360-3369 SL 3374
TP1: $3355
TP2: $3342
TP3: $3325
⭐️ Note: Labaron hopes that traders can properly manage their funds
- Choose a lot size that matches your funds
The weekend closed higher to around 3360
📌 Driving Events
Gold prices (XAU/USD) were on track to rise for the third consecutive day on Friday, climbing to the upper limit of this week's trading range as escalating trade tensions fueled safe-haven demand. Amid a significant intensification of global trade disputes, U.S. President Donald Trump this week sent formal notices to multiple trading partners detailing individual tariff rates that will take effect on August 1 if no agreement is reached. This has disrupted investor sentiment, weighed on risk assets, and provided solid support for gold.
Meanwhile, expectations of an imminent rate cut by the Federal Reserve (Fed) have cooled after last week's strong U.S. jobs data. As a result, the U.S. dollar (USD) remained firm, holding near more than two-week highs set on Thursday. A stronger dollar could limit upside for the non-yielding gold in the short term. Therefore, traders could look for a sustained breakout before going further bullish on the XAU/USD pair.
📊Personal comments:
Gold price broke through 3330, maintained good buying pressure, and rebounded over the weekend
⭐️Set gold price:
🔥Sell gold area: 3367-3369 SL 3374
TP1: $3355
TP2: $3342
TP3: $3325
🔥Buy gold area: $3306-$3308 SL $3301
TP1: $3315
TP2: $3325
TP3: $3338
⭐️ Note: Labaron hopes that traders can properly manage their funds
- Choose a lot size that matches your funds
Bearish pressure below 3,300 at the start of the week
📌 Driving Events
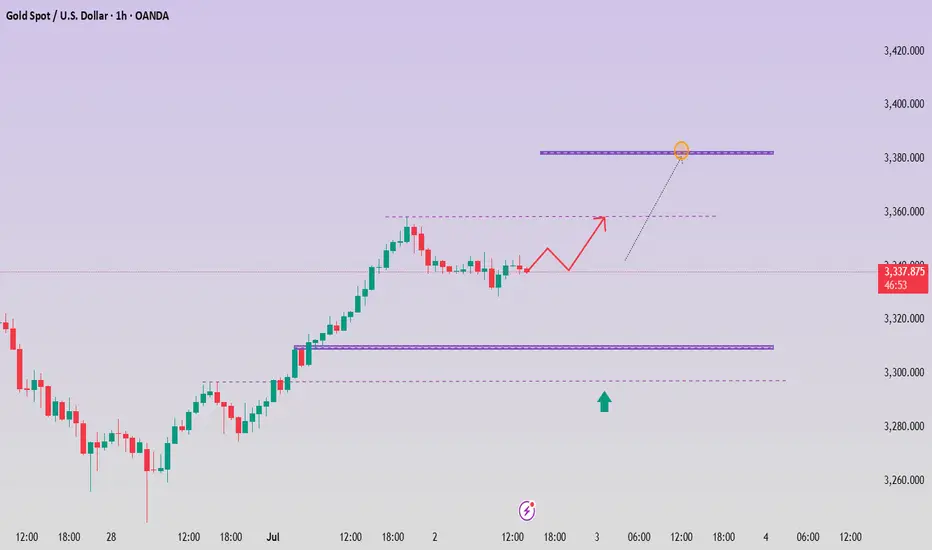
Gold prices (XAU/USD) faced renewed selling pressure in early Asian trading on Monday, falling to the $3,320 level. Gold's pullback came as stronger-than-expected U.S. nonfarm payrolls data for June reshaped market expectations for the Federal Reserve's (Fed) policy path. Investors are now turning their attention to the Federal Open Market Committee minutes, which will be released on Wednesday, for further guidance.
The U.S. added 147,000 jobs in June, better than expected and slightly higher than the revised 144,000 in May. Meanwhile, the unemployment rate remained stable at 4.1%. These data reinforce the view that the labor market remains resilient, reducing the likelihood of an imminent rate cut by the Federal Reserve. As a result, the U.S. dollar strengthened, weighing on non-yielding assets such as gold.
📊Comment Analysis
The decline at the beginning of the week, gold prices give up accumulation below 3300
💰Strategy Package
⭐️Set gold price:
🔥Sell gold area: 3337-3339 SL 3344
TP1: $3328
TP2: $3312
TP3: $3300
🔥Buy gold area: $3297-$3295 SL $3290
TP1: $3308
TP2: $3320
TP3: $3330
⭐️ Note: Labaron hopes that traders can properly manage their funds
- Choose the number of lots that matches your funds
- Profit is 4-7% of the fund account
- Stop loss is 1-3% of the fund account
Trump's new tariffs are coming, will gold soar?
✏Hello everyone, let's comment on the gold price next week (July 7, 2025-July 11, 2025)
. ⭐️Gold Information:
This week, the spot gold price showed a trend of rising first and then falling. From Monday to Wednesday, driven by safe-haven demand and the weakness of the US dollar, the gold price recorded three consecutive increases, climbing rapidly from US$3,271/ounce to the intraday high of US$3,365/ounce on Wednesday afternoon, showing strong upward momentum. However, on Thursday, before the release of the June non-farm payrolls data, market sentiment turned, and the gold price plummeted to US$3,312/ounce, the largest single-day drop in the week. On Friday, affected by the light trading during the US Independence Day holiday, the gold price fluctuated between US$3,330 and US$3,355/ounce, closing at around US$3,337/ounce, up about 1.91% for the week.
U.S. President Donald Trump announced that the U.S. will begin sending formal letters to trading partners on Friday, ahead of a July 9 deadline, outlining new tariffs ranging from 10% to 70%, which will take effect on August 1. Treasury Secretary Scott Bessant added that a series of trade agreements are expected before the deadline, with an estimated 100 countries facing reciprocal tariffs of at least 10%. He also hinted that some agreements will be announced soon.
⭐️Labaron personal comment:
Gold prices continue to consolidate sideways, fluctuating in the 3242-3450 range
The following important key areas have been identified:
Resistance: $3362, $3393, $3446
Support: $3312, $3279, $3241
Gold accumulates and breaks through 3350 points
⭐️Personal comments:
Gold price rebounded around 3350. There was no important news and bank holidays in the US session on Friday, so it rebounded in the short term
⭐️Set gold price:
🔥Sell gold area: 3365-3367 SL 3372
TP1: $3355
TP2: $3342
TP3: $3330
🔥Buy gold area: $3311-$3313 SL $3306
TP1: $3325
TP2: $3338
TP3: $3350
Gold fluctuates during the day, short-term profits will be left
📌Main driving events of gold
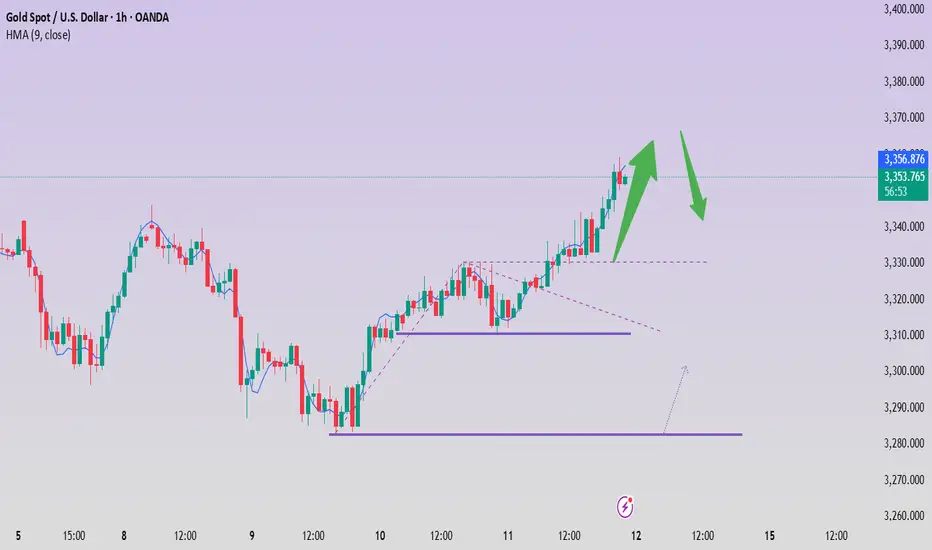
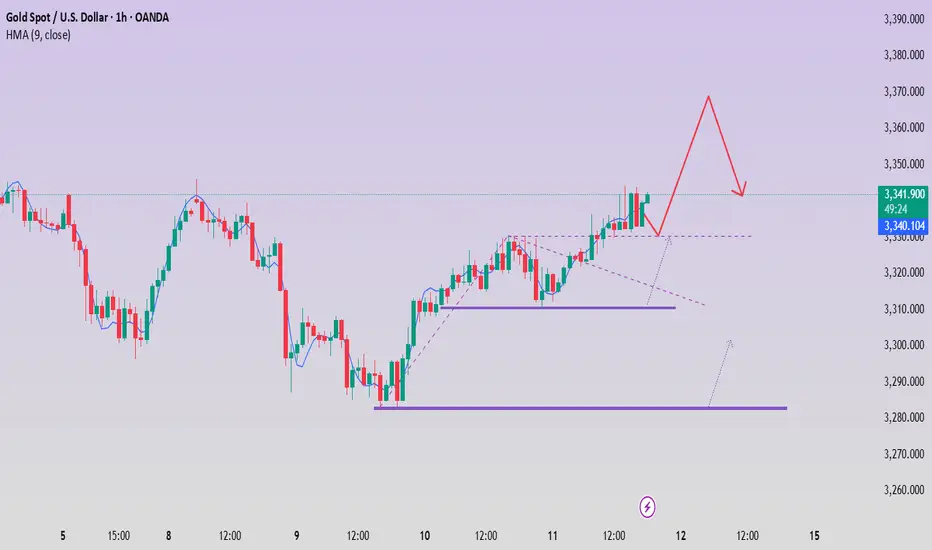
The big non-agricultural data in the United States caused the gold price to fall by almost 40 US dollars in one breath, but after a short emotional storm, the market returned to calm. Today's market began to bottom out and rise. As of now, the non-agricultural market has been backed by 50%, and the energy of the shorts has been basically digested. Next, the bulls will start to exert their strength! Today's direction is still the same and continue to be bullish!
📊Comment analysis
In the US market, the gold price rebounded after the decline and the bottom of the second retracement appeared. The support level is 3322. After a night of fluctuations, gold has begun to rise, and the low point has begun to rise. The key point of the day is still 3323. In the morning, we wait for the gold price to fall back to around 3323 and we will buy the bottom and go long. We don’t expect to surpass yesterday’s high point during the day, but at least it will go to 3350!
💰Strategy Package
Long position:
Gold long at 3322-3327, stop loss 3315, target 3350-3360
⭐️ Note: Labaron hopes that traders can properly manage their funds
- Choose the number of lots that matches your funds
Gold grows, recovers near 3390
📣Gold News
Gold prices edged higher during the North American trading session as investors turned their attention to the upcoming U.S. non-farm payrolls report (NFP), which could influence the Fed's next policy move.
The latest labor data showed that companies are pausing hiring rather than laying off employees, reflecting caution in an uncertain economic environment. Meanwhile, Microsoft's decision to lay off 9,000 employees has heightened concerns about a weak labor market.
Traders are currently awaiting the official employment report from the U.S. Bureau of Labor Statistics on Thursday, which is expected to show 110,000 new jobs in June, down from 139,000 in May. The unemployment rate is expected to rise slightly to 4.3%, still within the 4.4% range of its forecast according to the Fed's latest summary of economic projections.
📣 Technical Analysis
NF is worth buying before the news release, holding. The dollar continues to be under selling pressure from investors worried about the Trump administration's erratic tariff policy.
💰Set Gold Price:
💰Sell Gold Zone: 3390-3398 SL 3405
TP1: 3380 USD
TP2: 3363 USD
TP3: 3350 USD
💰Buy Gold Zone: 3296-3294 USD SL 3289 USD
TP1: 3308 USD
TP2: 3318 USD
TP3: 3330 USD
⭐️Technical Analysis:
Set reasonable buy orders based on technical indicators EMA 34, EMA89 and support and resistance areas.
Gold prices have risen sharply. How should we trade gold?
📣Gold news:
US Senate passes Trump tax reform bill. Trump wins major victory
Trump's signature tax and spending cuts bill passed the Senate on Tuesday. Republican leaders finally convinced dissenting lawmakers after a hard fight, helping Trump win another political victory.
Trump refuses to extend July 9 tariff deadline
US President Trump reiterated on Tuesday that he has no intention of extending the 90-day suspension of reciprocal tariffs on most countries after it expires on July 9.
When asked whether he would extend the suspension of tariffs, Trump replied on Air Force One: "No, I haven't thought about it. I will write to many countries to notify them of the tariff rates they will face."
Gold (XAU/USD) struggled to extend its two-day rally, fluctuating narrowly in the Asian session on Wednesday, just below Tuesday's one-week high. The dollar's slight rebound - from its lowest level since February 2022 - put pressure on gold. Moreover, improving market sentiment continues to weaken demand for safe-haven assets such as gold, further limiting its upside.
⭐️Technical Analysis:
Trend lines are steadily picking up, and continued buying could move towards 3383 based on today's ADP-NF data
💰Set Gold Price:
💰Sell Gold Zone: 3375-3385 SL 3395
TP1: $3370
TP2: $3360
TP3: $3350
💰Buy Gold Zone: $3315-$3310 SL $3305
TP1: $3320
TP2: $3330
TP3: $3340
⭐️Technical Analysis:
Set reasonable buy orders based on technical indicators EMA 34, EMA89 and support resistance areas.
This is the reason why gold suddenly "changed its face"!
📣 Gold News
Spot gold closed up $28.59, or 0.87%, at $3,302.71 per ounce on Monday. Gold prices fell to around $3,246 per ounce in early Asian trading, the lowest level since May 29.
At 21:30 Beijing time on Tuesday, Federal Reserve Chairman Powell, European Central Bank President Lagarde, Bank of England Governor Bailey, Bank of Japan Governor Kazuo Ueda, and Bank of Korea Governor Lee Chang-yong will hold a group meeting.
Last Tuesday and Wednesday, Federal Reserve Chairman Powell attended a congressional hearing and said that the Fed needs more time to observe whether tariffs make inflation rise higher before considering cutting interest rates.
Powell said in his congressional testimony that he and most Fed officials expect inflation to start to pick up soon, and the Fed is not in a hurry to cut interest rates before that.
Powell said: "At present, we have good conditions to wait and further understand the possible development path of the economy before considering whether to adjust the policy stance." Yesterday, gold opened at $3381.6 and quickly fell back, reaching a low of $3248.8, then rebounded, rebounded in the early trading and touched $3270 and fell again, gold fell back, reaching a low of $3259.4, then gold did not continue to fall, and rebounded. Gold continued to rebound in the European and American markets, with the highest rebound in the US market reaching $3309.4, and finally closed at $3002.9 in the late trading. The monthly line closed with a long upper shadow line and a shooting star pattern. After such a pattern ended, today's gold rebounded high, and the upper resistance focused on the $3326 line. The rebound relied on the resistance below here to short, and the lower side looked at the $3295 line.