Short gold immediately
The 1830 short position on gold has been closed for profit. What can we do now to maximize profits? Looking at the short-term trend, a death cross has formed on the 15-minute chart, and with continued weakness on the 15-minute chart, a death cross on the 30-minute chart is also about to form. Therefore, it makes sense to sell at this point.
My personal trading strategy:
Enter a short position at the current level, with a target of 1820.
During the profitable process, investors can choose their own profit-taking levels based on their risk tolerance.
Liking, commenting, and subscribing are your biggest encouragement to me. Find me to make trading easier! You are also welcome to check out my other ideas below.
OANDA:XAUUSD FXOPEN:XAUUSD
Goldlongterm
Can gold still rally?
In trading, we may have short-term profit goals, but long-term goals are built on the foundation of short-term profits. Without short-term profits, long-term goals are meaningless. Therefore, we need to balance short-term and long-term goals to achieve steady and sustained profitability.
After Powell's speech, gold continued its downward trend and hit a one-week low around $1809. The question of whether it will continue to rise is a concern for many traders.
I think there is an opportunity. First, the 50-basis-point rate hike in March is not set in stone. It is just a change in expectations. As Powell said, we need to pay attention to data, especially this Friday's non-farm payroll report. If employment data is weak on Friday, it does not support the Fed's continued high-intensity rate hikes. At that time, the expectation of a 50-basis-point rate hike will also cool down, and the gold price will rise accordingly. Secondly, from a medium to long-term perspective, I am still optimistic, because after multiple 50-basis-point rate hikes, the Fed's terminal interest rate is relatively high now, and it should be difficult to continue to raise rates by 50 basis points. Therefore, the big cycle will gradually slow down the rate hikes.
Overall, I think there is no need to be too pessimistic. Short-term adjustments will only make subsequent rebounds more powerful. There are many events this week, and the probability of continued volatility is high. It is expected that gold will begin to rebound next week.
For short-term trading strategies this week, we should first look at the support level of $1809 below, with the first target level of $1845 and the second target level of $1860. I will update the article with detailed price levels and trading directions based on the market situation. I also welcome everyone to express their opinions. Follow me to make trading simpler!
FXOPEN:XAUUSD TVC:GOLD COMEX:GC1!

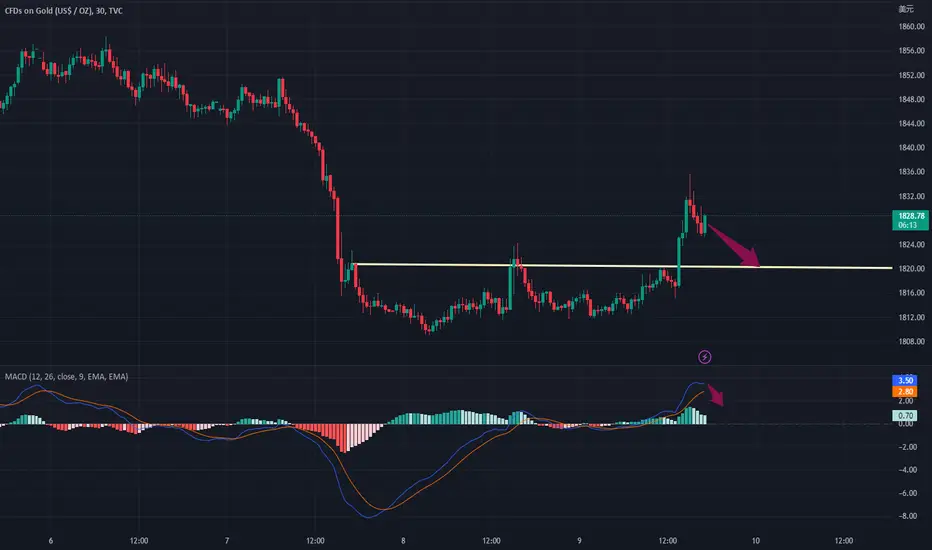
Gold surged and then retreated, waiting to short at 1819.How to maximize profit in real-time gold trading today?
The gold market in the US session has been unable to hold its ground, with clear signs of weakness in the long positions, and the market is struggling to advance. The price briefly surged near 1822 but was quickly pushed down, with three failed attempts to break the resistance level. Overall, the market is in a weak consolidation phase.
On the 4-hour chart, the price is still under strong pressure, and the K-line has not been able to touch the moving average, indicating resistance to further price increases.
Therefore, my real-time short-term trading strategy focuses on selling short. I recommend buying a short position near 1819, with a stop loss at 1826 and a target price at 1809, the support level where we previously entered long positions.
Investors can choose their own profit-taking points during the process of making profits based on their trading styles.
Please note that the above is only a short-term trading opinion. If there are suitable opportunities, I will notify promptly.
Liking, commenting, and subscribing are your biggest encouragement to me. Follow me and make trading easier! Also, feel free to check out my other ideas below.
OANDA:XAUUSD FXOPEN:XAUUSD
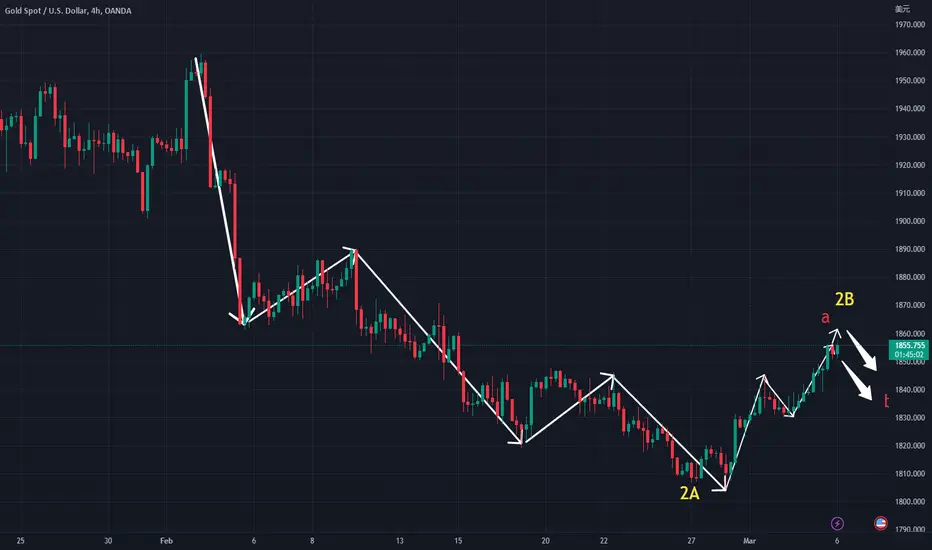
Gold is bearish and $9 is in the bag
The Achilles heel of human psychology---fear and greed. Why is there fear, repeated failures, unprincipled stop losses, funds are inadvertently because the countless stop losses are getting less and less, so that they dare not start when they are right, hesitant, and keep doing it when they are wrong , Don't dare to do it! Don't dare to look at what is right, but keep watching when you are wrong. Why greed, greed is gambling, greed in the wrong direction can only lead you to the infinite abyss.
Now I would like to share my thoughts on shorting gold yesterday. Since the early fall did not touch the lower support, and the structure of the fall did not appear in a three-wave pattern, the main consideration yesterday was that the fall was much lower, but there was a rebound trend in the afternoon, which indicates that There will be a wave of falling back and the space is also in line with the profit-loss ratio, so the position that may be under pressure is given in advance in the morning. The rebound touches the 50%~61.8% area of the golden section, which is the node that may fall back. Around $9. When arriving at the 1841~1840 area in the evening, this is also the previous platform high point and the structure is completed at the same time, so try to do more risk control at $4, but the cloud of the chairman of the Federal Reserve's speech continues to suppress the short-term trend, and the long-term thinking here fails. The speech at 11 o'clock in the evening began with the hawkish interest rate hike speech. As soon as the market bulls gave up, the decline was logical. Therefore, judging from yesterday's operation, news factors can sometimes affect the development of local markets, so risk control must be given top priority at all times. One short, one long, one profit, and one loss are still profitable overall, mainly because Control the size and target of each stop loss. The current downtrend has become a second downtrend in advance, and the previous low will be tested or even broken in the past two days.
Traders, if you like this idea or have your own opinion about it, please write in the comments. I will be happy 👩💻
Missed Last Rally of GOLD? No Worries, Follow This Setup Good to see gold is following us
Hope this Analysis will help you guys to plan your trades
I see an Order Block area in Weekly Time frame and sooner or later it will be fulfilled
This area would be a good long area for those who missed last rally of gold.
Cheers
DYOR

Buy gold now.
Gold has support at 1830-32below, and it has basically returned to this level after the pullback. The distance between the moving averages and the K-line is relatively far, and the moving averages and the K-line have mutual attraction, indicating a likely return to the moving averages. Therefore, we can directly enter a long position at 1833 for gold. Are you ready? Opportunities do not always come, so we must seize them when they do.
Trading strategy: Go long on gold at 1832, with a stop loss at 1823 and a target of 1852.
Follow me to make trading simpler. FXOPEN:XAUUSD
Gold breaks through previous highs, bulls will continue to rise
The maple leaf ignited a fire in the forest, it was after experiencing the blow of the frost: the big tree stood proudly in the snowstorm, it was after taking deep roots in the soil: you——stand out and make a big splash, it is in After practicing calmly and steadily.
Gold chose to break through directly on Friday, and did not choose to fall back again in the 1844~1847 area. Now that the market has made a choice, it has opened up short-term upside space, and the next pressure is located at 1864~1873. For gold operation, it is recommended to buy at 1848, risk control at 1844, and target 1860~1864.
Gold is bullish for several reasons:
1. Gold breaking through the previous high means that the bullish trend is not over yet, and there is still room above the daily closing.
2. The pressure within the day is 1864~1873, and the support is 1849~1845.
Traders, if you like this idea or have your own opinion about it, please write in the comments. I will be happy 👩💻
The bulls counterattack, can the non-farm week go up to 1900?
You understand when others don't understand, you act when others understand, you succeed when others act, and you become rich when others succeed. This is: extraordinary thinking, foresight. Smart people can understand, shrewd people can see accurately, and savvy people can see far. The voice of the wise is the direction of the fool. You must learn to give up what you should not have, otherwise you will not be able to enter the palace of wisdom. Prejudice is worse than ignorance
In the past week, the trend of gold price has basically revolved around the rebound of the bulls. The daily level performance closed positive for four days, and it even rose to 1856 at the end of Friday and then closed the line. On the weekly line, a big positive package was formed. The negative reversal pattern, which is what we reminded last week, is the long counterattack after the monthly line ends, which is exactly in line with expectations~
After the monthly line closes, the 5/10 daily moving average indicator at the monthly line level is still bullish in the mid-term. As I said, if the price of gold is above 1790, it is possible to arrange mid-line long orders, but it is a pity that the lowest retracement on Monday is only around 1804, and the mid-line long orders have not been able to complete the layout, but this week's short-term long-term profit is not small~
Although the weekly level of the 5/10 daily moving average is dead fork downward, the reversal of the Dayang K-line directly disrupts the track of the moving average indicator. Next week, the 5-day moving average will form a corner, so the weekly level is basically difficult. Now comes the suppression on the technical side. Lianyang rebounded on the same daily line. The fundamentals of gold at the beginning of next week will definitely be bullish. It is not too difficult for the technical side to be bullish above 1875. In the short term, there may not be any Larger pullback~
Next week will usher in the announcement of the super data ADP employment and non-agricultural employment population. At the beginning of the week, we continue to be basically bullish. With a population of 500,000, it is a major bearish force for gold and silver, but it is difficult to maintain the employment population above 500,000 this month. This is a potential bullish factor that stimulates gold prices to rebound before non-farm payrolls, slowing down the release of non-farm payrolls. Announcing the downward pressure on the US dollar at that time~
To sum up, whether it is before or after non-agricultural, I am personally optimistic about the performance of gold bulls. Before the data at the beginning of the week, it was bullish to the 1875-1885 area, and it is expected to hit the 190 mark within the week. The limit is the 1910-1920 area~
Traders, if you like this idea or have your own opinion about it, please write in the comments. I will be happy 👩💻

Forecasting the future trend of goldDon't be indifferent to gentleness because of too much busyness, don't hide enjoyment because of too much pursuit, work is not the whole of life, stop in a hurry, please enjoy the blessings of life. have a good weekend
Last week, gold closed as scheduled, all profits.Congratulations to my friends
As analyzed during the trading week, gold was primarily bullish with pullbacks providing opportunities for buying. Essentially, all long positions were profitable, albeit with slight variations based on individual entry points. The overall trend direction was accurately captured. In the short term, gold is expected to remain bearish, and those with significant long positions should consider controlling their position size. For those who have questions or insights on the gold market, feel free to click on the rocket icon to join the discussion.
There are two principles in investment: first, don't lose money; second, never forget the first.

XAUUSD-GOLD Dear traders, hope you all doing great, this will possibly be the last sell entry be on XAUUSD, We have high impact news on XAUUSD and that is why we think, it would be a perfect area to sell gold and target 400-500 pips. We may have the buy limit set around 1780-85 as this is the area every trader is eying on.
-Trade Setup will only be valid if we have good rejection to ‘red marked area’.
-If price comes to area range enter with 50-60 stop loss.
-First target 100 pips once achieved close 50%.
-Do not enter earlier with bigger stop loss.
-Trade smart and wise.||
Good luck and Trade safe. Remember, Patience Pays.
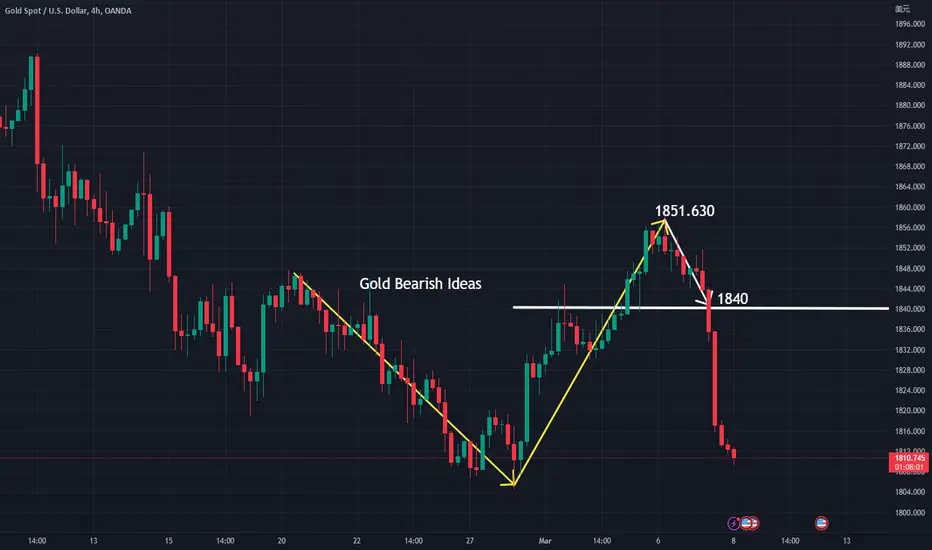
Silver collapses, gold can be shorted near 1838
Gold's intraday rebound near 1838 was blocked, and it has now retreated to around 1830. Although gold is weak and the amplitude is not large, there is basically no rebound strength near 1830. For the related product silver, the silver daily line has fallen below yesterday's daily low point level , if proportionally speaking, gold may fall to the 1820 level
At present, the rebound of gold is weak. I think a few points of the small rebound can be directly empty, and it can be seen that it will be held near 1820.
At present, the amplitude is not large, either it will follow silver directly, or it will fluctuate slightly before and after the U.S. market data in the evening. Overall, silver is obviously weak, and gold rebounded yesterday. In reality, beware of the possibility of a gold rebound in one step
Friends can make their own suggestions
OANDA:XAUUSD

Gold: Short selling
Observing the 1-hour chart of gold, MACD indicator has shown a clear divergence.
The increase has reached as high as 40 US dollars from yesterday to today, so a short-term pullback is necessary.
Therefore, short-term trading will be bearish dominant, supplemented by bullish, until the correction is completed. From a long-term perspective, it is expected to rise until it reaches 1860 US dollars.
If you liked this idea or if you have your own opinion about it, write in the comments. I will be glad!
FXOPEN:XAUUSD

Gold a currency hedge assetThe 2 key reasons why gold keeps rising it is because
1) Gold is an inflation hedge asset
2) Gold is a currency hedge asset
Content:
• Gold is still an inflation hedge instrument
• Gold is also a currency hedge instrument
• How to invest & trade in Gold?
CME Micro Gold Futures
Minimum fluctuation
0.1 = $1
1 = $10
10 = $100
100 = $1,000
Disclaimer:
• What presented here is not a recommendation, please consult your licensed broker.
• Our mission is to create lateral thinking skills for every investor and trader, knowing when to take a calculated risk with market uncertainty and a bolder risk when opportunity arises.
CME Real-time Market Data help identify trading set-ups in real-time and express my market views. If you have futures in your trading portfolio, you can check out on CME Group data plans available that suit your trading needs tradingview.sweetlogin.com

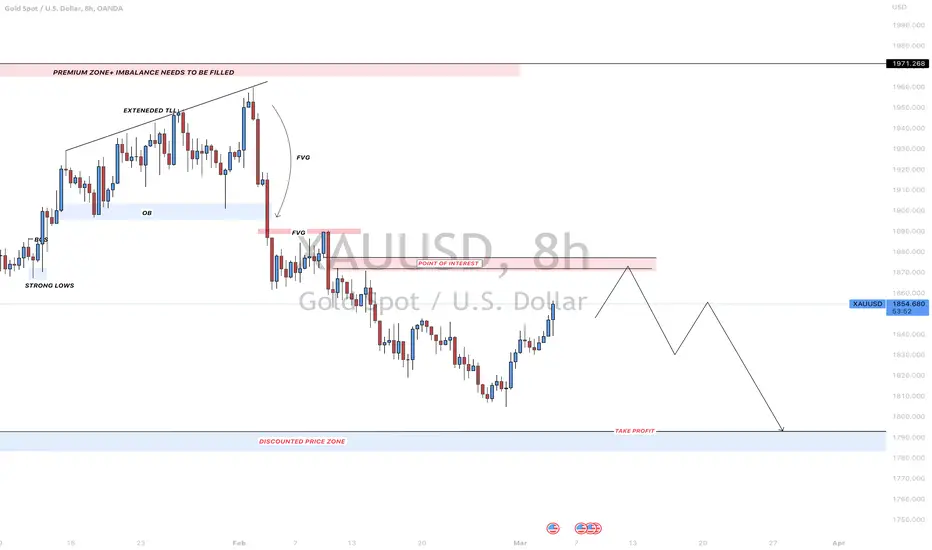
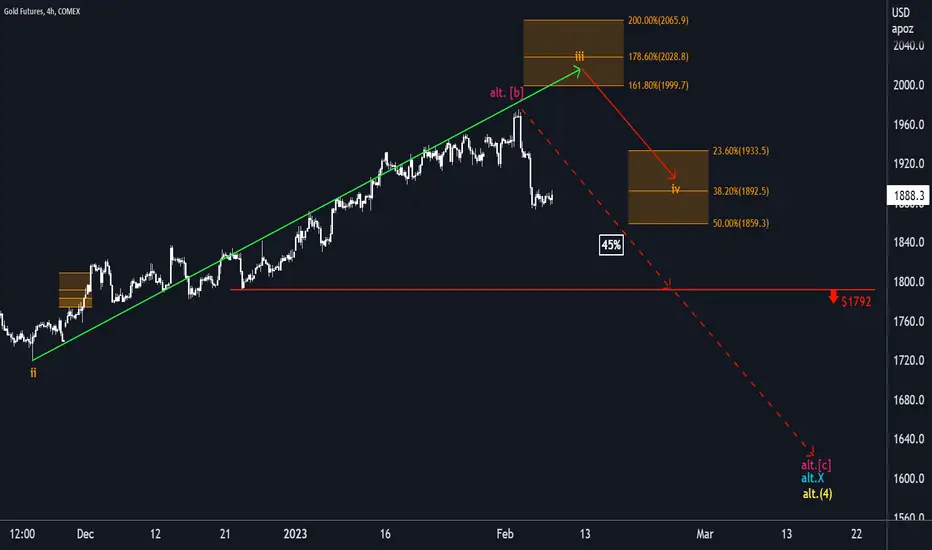
Gold: Balanced 🌿Although Gold is gaining more stability while tapping sideways, it should work on its upwards momentum to carry on with our primary scenario. In this case it would rise up to the orange target zone to complete the orange wave iii. After completion, the orange wave iv should push the Gold back into a correction. In our alternative scenario with a probability of 45%, the course would drop below the support line at $1792 instead of climbing to the orange zone.
Gold Day AnalysForex and gold is a market full of potential but also a lot of risk, so practice and equip yourself with the necessary knowledge.
Our pivot point stands at 1912.00.
Our preference
The upside prevails as long as 1912 is support.
Alternative scenario
The downside breakout of 1912 would call for 1901.50 and 1895.50.
Comment
The RSI is trading above 70. This could mean that either prices are in a lasting uptrend or just overbought and that therefore a correction could shape (look for bearish divergence in this case). The MACD is positive and above its signal line. The configuration is positive. Gold is above its 20 and 50 period moving average (respectively at 1911.30 and 1904).
Supports and resistances
1951.50 **
1945.50 *
1939.50 **
1933.00
1920.20 last
1916.00
1912.00 **
1901.50 *
1895.50 **
Number of asterisks represents the strength of support and resistance levels.
Gold Moon BootsI had an analysis completed back on
06 August 2021
Idea shared but taken off for the rules - error on my part.
Anyway - Self explanatory.
The long-term view for XAUUSD toward 2104.0
Breakdown of Gold thoroughly explained before hand.

Gold Bullish PotentialABCD Bullish Reversal Pattern
Price reacts on Monthly support and makes Bullish Engulfing Candle
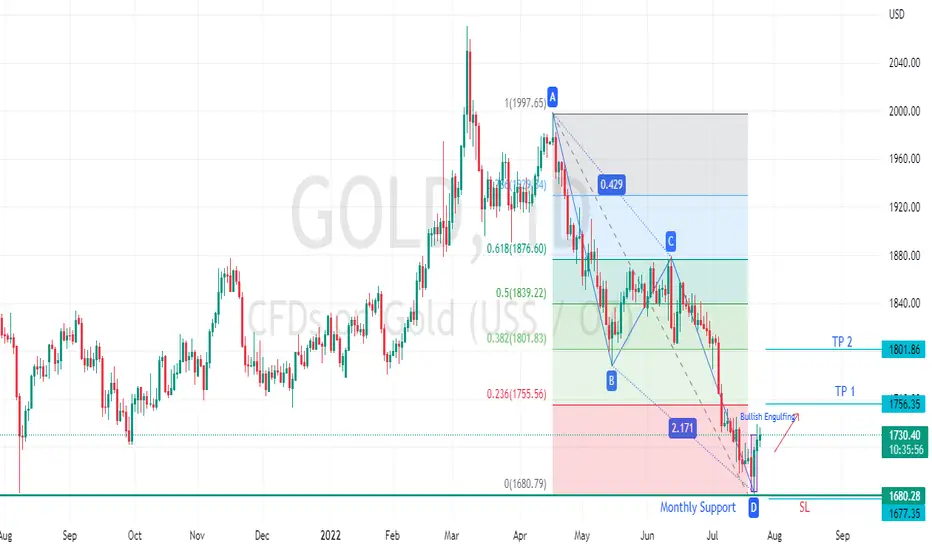
gold trading setup gold touch strong support 1681 and touch strong trendline
now gold next target iy 1781 if gold break 1781 then gold target is 1778 and more up
buy from 1718
stop loss 1672
take profit1 1781
take profit2 1878
long traders buy and hold

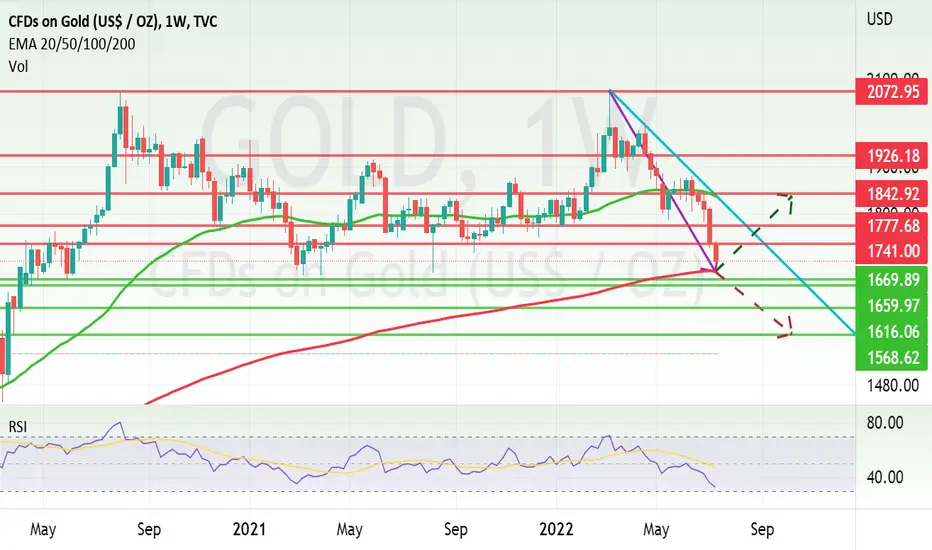
Gold very near to major weekly support of last two years.Gold very near to major weekly support of last two years. In June 2020 Gold was seen at the levels of USD 1677.70. right now Gold is at USD 1706.70. If Gold closes a week below 1677.70 there is a chance that it can fall to 1659 and 1616. In case of further major rate hikes if we see further weakness in commodities God can go to as low as USD 1568. On the upper side once Gold finds it's bottom and goes north the major resistance will be seen near USD1741, USD1777. Gold will find a major resistance near 1842 on it's way up. Long term bullion investors can start buying gold X/3 at CMP. X/3 can be bought if prices falls to 1538-1616 levels. X/3 entry can be taken above 1777 levels.
GOLD - Follow The Yellow Brick RoadAll you need to know is Gold just reached levels near the lower range of the Yellow Brick Road (YBR). The price channel Gold has continued to stay within should drive prices back higher if it is not broken by some external market event (think global collapse). Even then, if it is broken, Gold will recover and continue higher after a deeper pullback.
Right now, I see these lows as a fantastic opportunity to BUY THE DIP. Same thing with Silver.
These lower ranges present very solid opportunities for skilled traders. The next few weeks could see a solid rally back above $2100 - then targeting $2600 or higher.
Here we go. Get ready for a solid move higher over the next 5+ weeks.
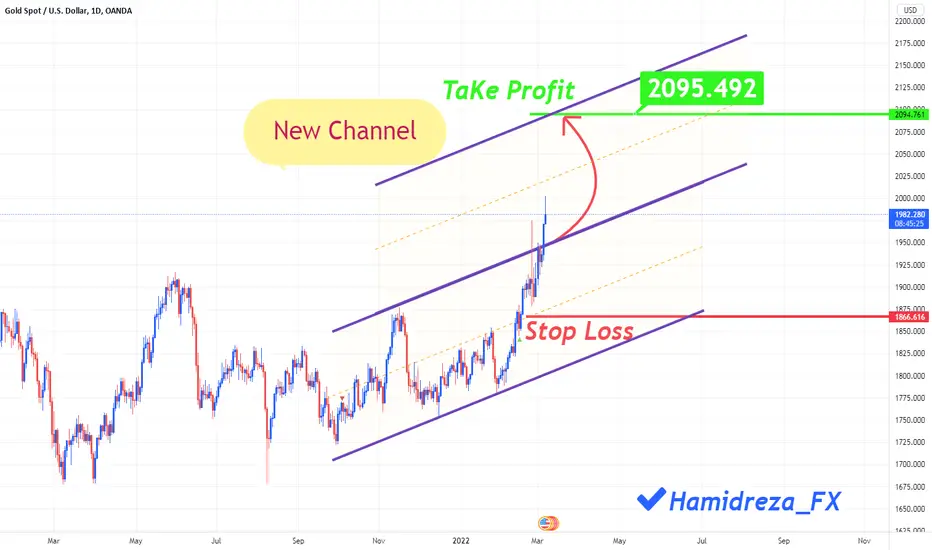
💡Don't miss the great Buy opportunity in XAUUSD 😍Hello to all dear traders
It looks like we've entered a new channel. All the evidence, including the continuation of the Russian war against Ukraine, and the conversion of capital into gold by the warring countries, has led us to see an increase in the price of gold right now. To better show the analysis, I also removed the Ichimoku and MACD indicators. All indicators suggest a long-term buy.
🙏If you have an idea that helps me provide a better analysis, I will be happy to write in the comments🙏
❤️Please, support this idea with a like and comment!❤️
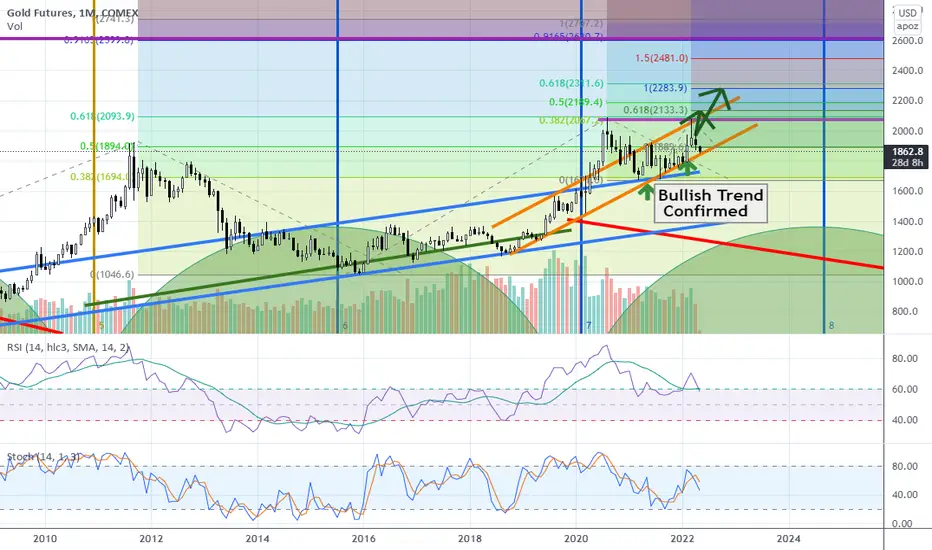
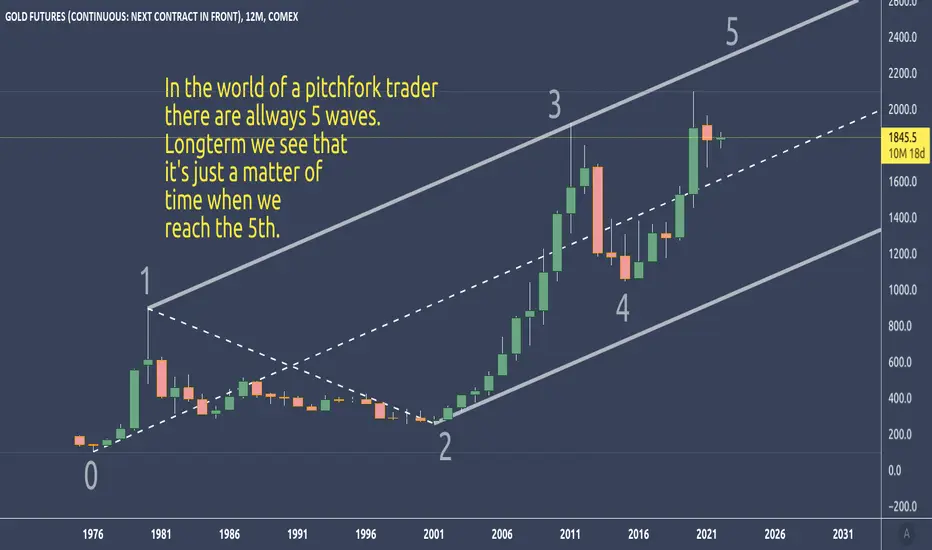
gc1! - Gold on the way to the 5th waveI always can expect 5 waves, before markets switch direction to a new trend.
In this Gold longterm chart, we clearly see that we are approaching wave 5, expecting the target at or even above the U-ML (Upper Medianline Parallel).
GOLD'S DOWNWARD PRESSURE (MANIPULATION) IS EXHAUSTED! It is hard to technically analyze a market as manipulated as precious metals are. Every day they are bought up in the Asian/Euro markets and slammed (8:30am EST) almost without fail. Ive been watching the metals markets every day for the past decade and I have not seen manipulation this blatant since 2011 (silver take down from $49). The difference today is that the shorts (despite their government backed fiat war chests) have not been able to hold metals down. If you think I am a heretic please educate yourself on governments "rights" as well as ability to "control" every financial asset known to man (expect for Bitcoin) in the interest of preserving the "economy' and the USD. As frustrating as the past decade and this past week has been I relish in the futile attempts central banks and the federal reserves attempts to distort reality and play god with the worlds financial monetary system.
Hocus Pocus aside, from a technical perspective.... Gold and Silver's RSI have turned up on a weekly basis. They have formed a nice inverted head and shoulder pattern, and have finally started to print higher lows and higher highs on a daily basis. It is foolish to underestimate the power and control nice government men have over this market but I am compelled to stick my hands in the fire and buy metals again for a long term hold. The Feds "transitory" rhetoric has fully devolved into a pipe dream even the most foolish of believers have started to awaken from. With the commodities index up hundreds of percentage points it is hard to believe metals can realistic be lower than they were this time last year. In addition, the euphoria of Bitcoin (a clear competitor to Gold) seems to be peaking as it always does with "bullish" news of a ETF just as it did the last time it reached this resistance zone with the public offering of Coinbase.
