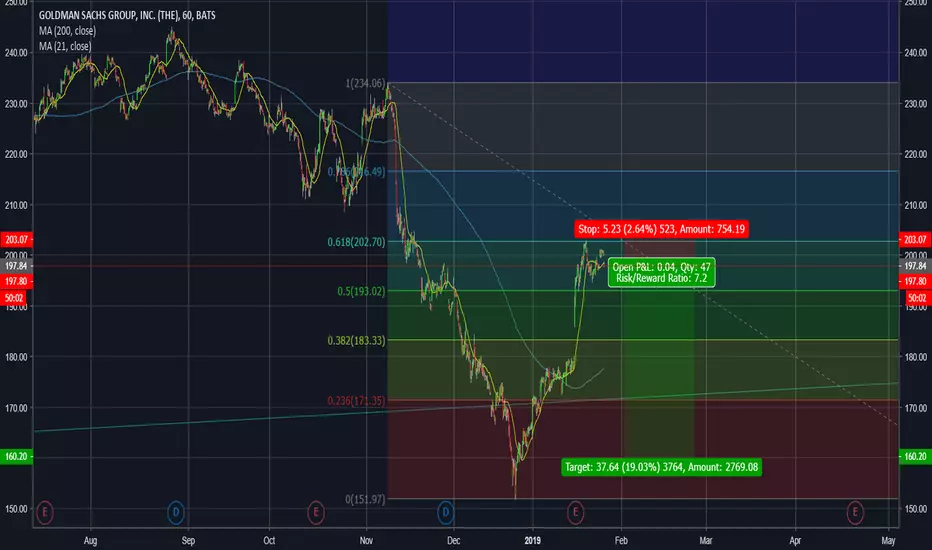
Goldman Sachs - GS - Bull Flag? Look for breakoutNot financial advice. Do your own research. The ideas shared here are the personal opinions of the BitDoctor team. Trade at your risk.
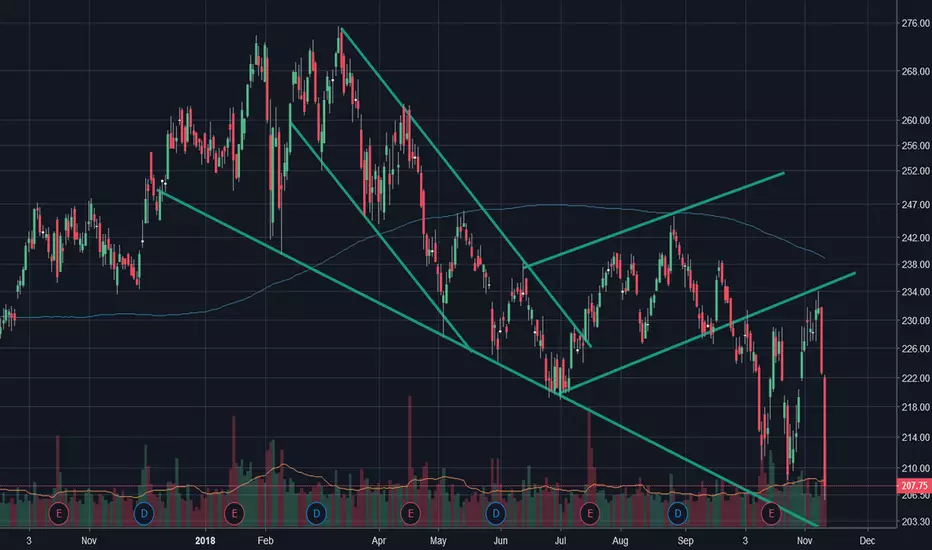
Took a really profitable trade on GS yesterday and got out right before it hit the top. Now I am looking for a more long term trade since we hit a bottom in intraday trading today. I'm not going to touch GS unless it breaks a key level around $200 and closes on a daily timeframe.
If Goldman Sachs can close above $200 then if I look at a measured move on this flag pattern, we are likely heading to $223 which would be over 10% from breakout (not from where we are right now which is about $192).
There are a lot of factors that one needs to consider trading right now and one of those factors is the fact that we're still somewhat stalled on trade deals with China and shaky ground in the legislative / executive branch in the USA.
Regardless, if we can break through this level and potentially retest it to confirm support, we have potential to make that strong push up. It'll take time and this is where patience could pay off. Keep the stop loss.
Trade safely friends.
<3 -CE-
Goldmansachs

Global Growth Fears Goldman Sachs Prices have perfectly aligned itself with the Fib Ratio prices. As long as the price doesn't break above the Stop loss, I will be holding a Put.
Here is my Option Trade: (Keep in mind that I am not good at options, I just see good value here as a swing option trade)
GES $165 Put
EXP date: 2/22
I will be holding this option until days before the expiration date.
If I made you money, follow me !
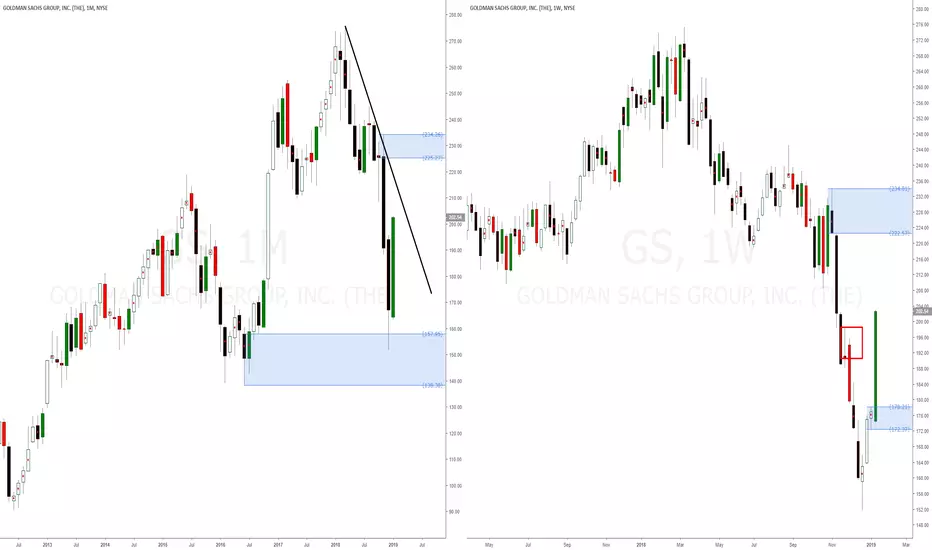
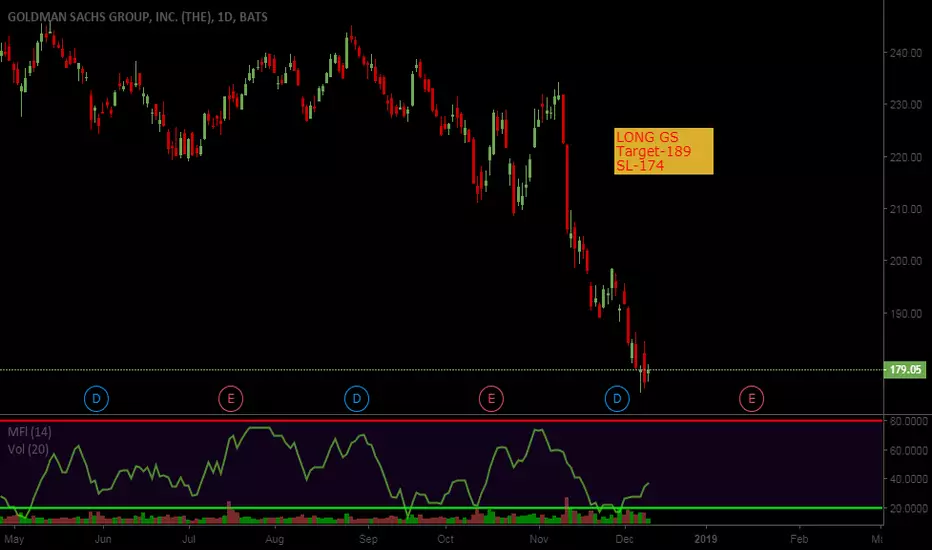
Buy Goldman Sachs american stocks after hitting monthly demandGoldman Sachs GS american stock buy opportunities after reaching monthly demand level around 157. This monthly demand imbalance has gained control after a strong drop for a few months.
New weekly demand level is being create at $178 as a reaction to monthly demand level, shorts are not allowed on this stock. Long term long bias with bigger picture uptrend on all bigger timeframes. Very strong reaction on the monthly off that M demand level.
We don't really care what the fundamentals are saying about this american stock, we don't care if BlackRock and Goldman Sachs Asset Management both plan to temporarily move some British-based fund managers to New York in the event of a no-deal Brexit, two sources told Reuters. Or if neither of the firms, who together employ more than 10,000 people in London, expects a chaotic exit that would force them to carry out the emergency relocation, the sources said.
Goldman's asset management business GSAM, with 50 managers in London, has plans to send "a handful" to the U.S. financial capital until a framework is in place, the second source said, adding they too would eventually relocate to the euro zone.
Goldman Sachs has reached a bigger timeframe demand level, it's time to buy with a clear long term long bias, no need to pay attention to what the fundamentals are saying. Buy opportunities being created on weekly and daily imbalances on Goldman Sachs NYSE american stocks.
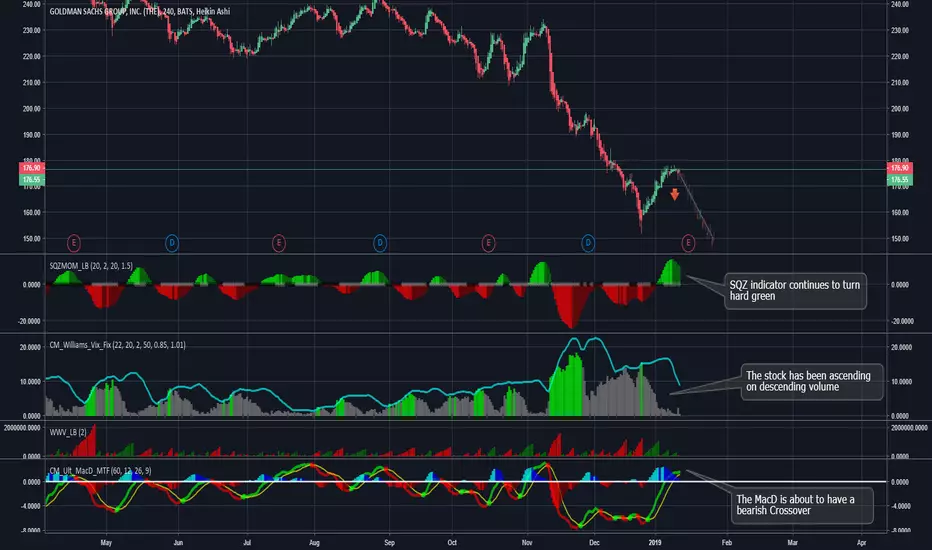
Goldman Sachs | Outlook & Earnings bearishLooking at Goldman Sachs chart.
The SQZ indicator continues to turn hard green. Indicating further down side.
The stock has been ascending on descending volume. Bearish sentiment.
The MacD is about to have a bearish crossover.
The chart follows the bearish sentiment that is seen across the market.
Bitcoin Elliot wave theory + TAI have no clue when it comes to the likeliness of this drawing aligning with any future outcomes. I added some notes of my observations, for where we may be heading short term- on route to complete a medium term recovery (1-3 months). I applied some Elliot wave theory and fib retracements to further accredit trends and observations made from normal TA and patterns. It looks like bitcoin is starting to lose its bearish sentiment as seen by the broken resistance and double bottom reversal. This past pump had an extremely evident bullish divergence on the daily chart which was a strong indicator that a powerful reversal was likely. However, I don't think we are close to a bull market when considering bitcoins past value cycles, but we're getting closer to being able to say that we broke out of the free fall of sell offs. So for the next month I can see bitcoin best case scenario tapping 5300 before welcomed with a deserving correction, and worst case scenario I can see it dipping down to the 3100 level. Anything less than 3,000 in the next 3 months and I will pull out to re-enter at another sign of a reversal.

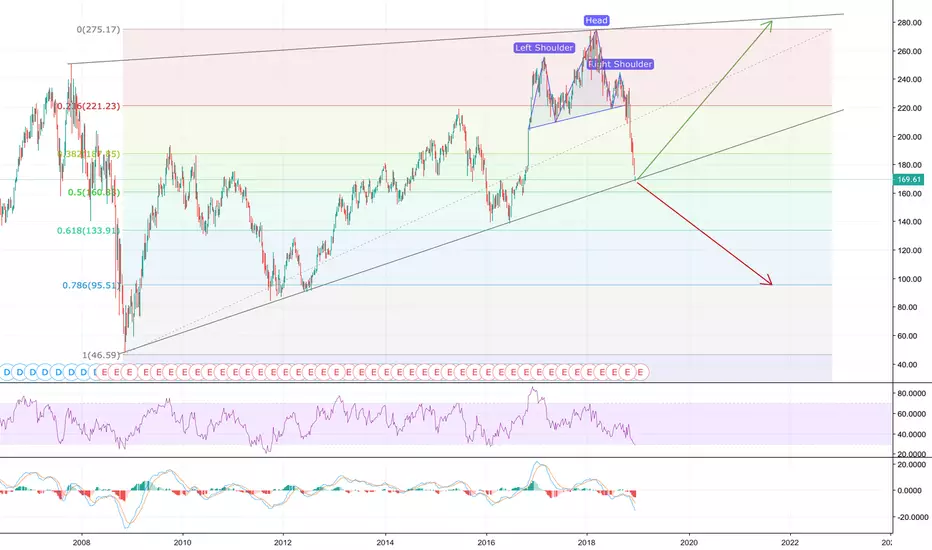
Decision Time for Goldman SachsThe H&S target has been reached, leaving GS at the rising trend line of the large rising wedge that has been in play since the 2008 crash. The RSI is showing that GS is oversold while the MACD is still taking a plunge. A MACD recovery and bullish cross would be a good sign. If the price closes under the rising trend line, I expect a large plunge to the 0.786 Fibonacci retracement. If the support holds, expect return to the top of the rising wedge .
GS Approaching Support, Potential Bounce!GS is approaching support at 171.75 (61.8% Fibonacci extension, 76.4% Fibonacci retracement, horizontal overlap support) where it could potentially rise to its resistance at 209.46 (horizontal pullback resistance).
Stochastic (89, 5, 3) is approaching support at 3.1% where a corresponding bounce could occur.

GOLDMAN SACHS: when a giant stumblesGoldman Sachs has stumbled and now there is much debate out there about what next to do. As usual some are shouting "enter long now", whilst others are saying "stay out" etc.
For me, it's very simple i.e. I just need to wait on a favourable time frame, somewhere between 2 - 6 hourly if I'm to go north. It's difficult to go short as there could be a rebellion of hopefuls heading north anytime soon. A northward push (if it happens) could attempt to test what I see as the base of a not so well-defined head and shoulders on the weekly.
The other major problem is that we are in dangerous economic times - far worse than 2008. So, GS could well head into a massive dive just like around 2008.
My strategy in the short term:
1. Wait for a pulse north and follow that if it happens on a microtrend (long position).
2. If that microtrend happens to get near the base, I'll be out - then look to short.
(Emphasis on the word 'if').
Longer term strategy:
1. If price goes into a deep dive like in 2008-ish probably months away, then look for favourable trend heading north, to go long.
2. Stalk for a double bottom if it happens.

Autonomous AI Vision Fund Upgrades Goldman Sachs to Sell $179.5Autonomous AI Vision Fund Upgrades Goldman Sachs to Sell $179.5
Strong Sell Rating $270

GS Approaching Support, Potential Bounce!
GS is approaching support at 171.75 (61.8% Fibonacci extension, 76.4% Fibonacci retracement, horizontal overlap support) where price could bounce up to its resistance at 209.46 (61.8% Fibonacci retracement, horizontal pullback resistance).
Stochastic (89, 5, 3) is approaching its support at 3.15%.

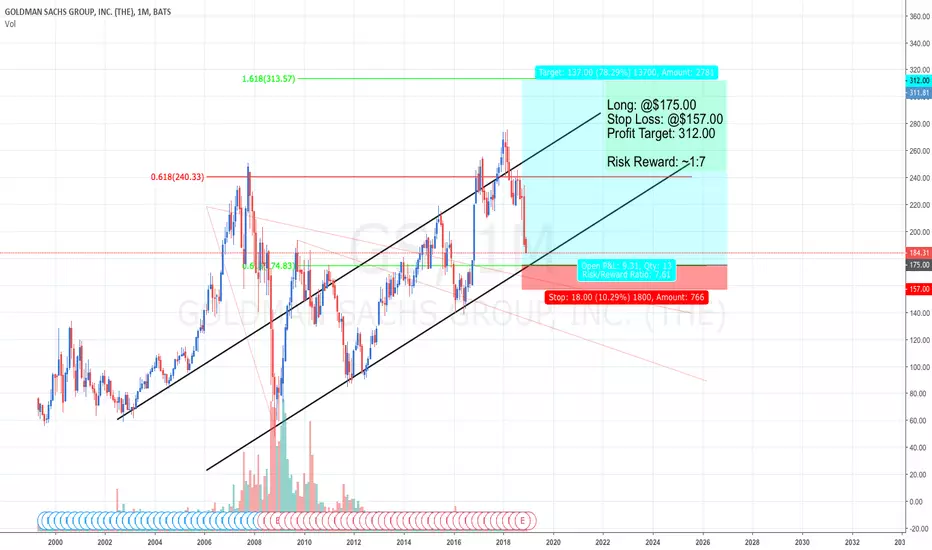
GS Bounce LongLong based off trends and fib levels
Long: @$175.00
Stop Loss: @$157.00
Profit Target: 312.00
Risk Reward: ~1:7
Goldman Sachs Testing Support, Potential Bounce!Goldman Sachs is testing support at 190.47 (100% Fibonacci extension, 61.8% Fibonacci retracement, horizontal swing low support) where it could potentially rise to its resistance at 230.72 (50% Fibonacci retracement, horizontal swing high resistance).
Stochastic (89, 5, 3) is testing support at 3.5% where a corresponding bounce could occur.

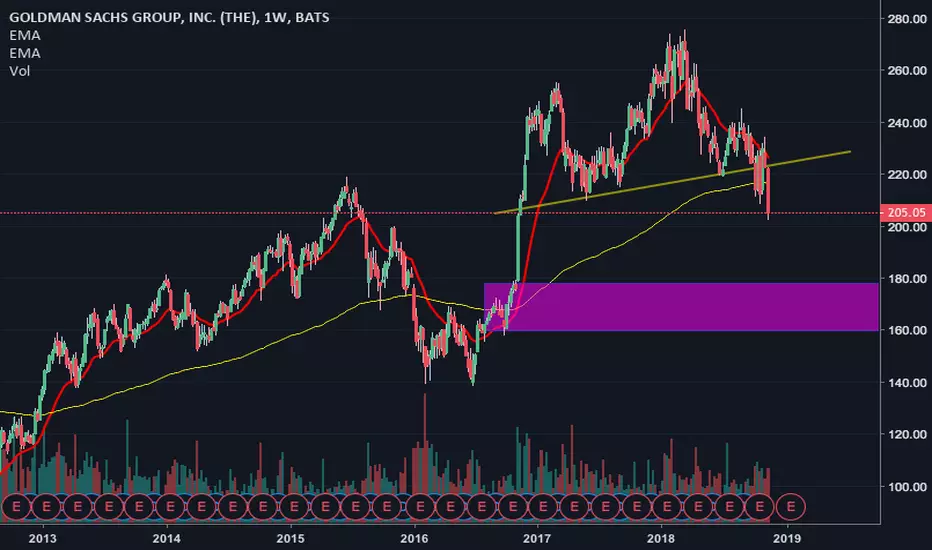
Goldman Sachs : Bearish SignalGoldman Sachs is in head and shoulders (s1 h s2) validated configuration in weekly. The break ok the neckline has confirmed the configuration and the bearish signal. From now, a pullback over the neckline is expected before the start of the strong bearish phase. Objective is 160$.

GOLDMAN H&S CONFIRMEDWe are witnessing a softening in the market. The Dow Jones Industrials appear to be a mixed bag. Buying blind is NOT the strategy at this point - it worked for 10 years, now the easy money has been made.
As suspected, the mid-term elections have not been without incident, and investors are naturally cautious. Many big stocks are confirming bearish topping patterns - including Goldman. I shorted today, with a target below.
This is telling me that the rally in the indicies has stalled for now, and an extended period of consolidation is perhaps on the cards. On the other side, we will see a bullish continuation, in anticipation of a Trump 2020 win.
With that said, I am buying any low in the Dow, yet cautious for now, and net short.
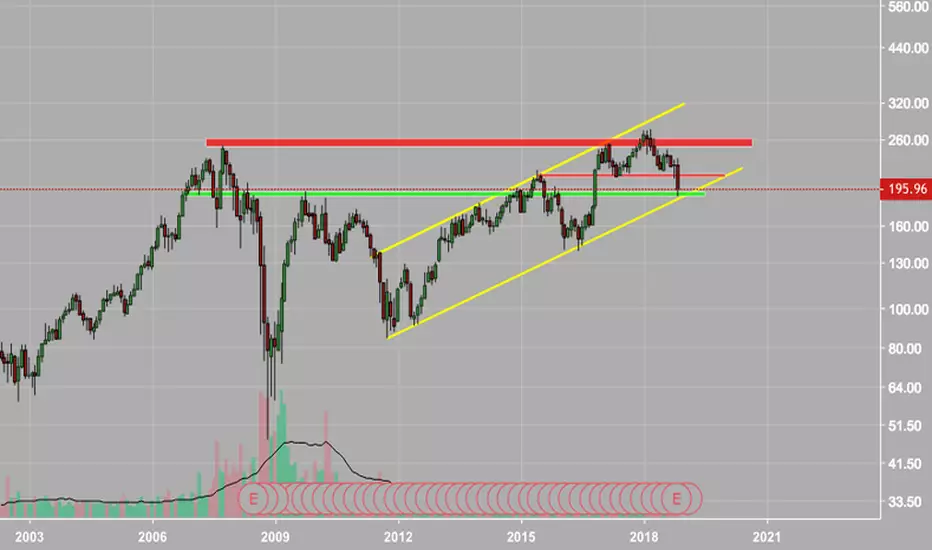
GS getting interestingGS downtrend support is around $200. Would probably set up a good long in this area. If it breaks, could see 2016 election levels.
Goldman Sachs head and shoulders on monthly about to play outH&S about to break down, target is to support line around $200

WTI Crude oil | 1D Bullish channel | Long supportOil is getting geared up to go with the volatile markets
$68 key psychological level
Break past $70
T1: $83
T2: $88
R/r =3/1
Stop loss 62$
__________________
A bull's case for oil by Goldman Sachs

No insider trading here, I repeat, no insider trading here. Just a note to self for the future:
If you see something, trade something.
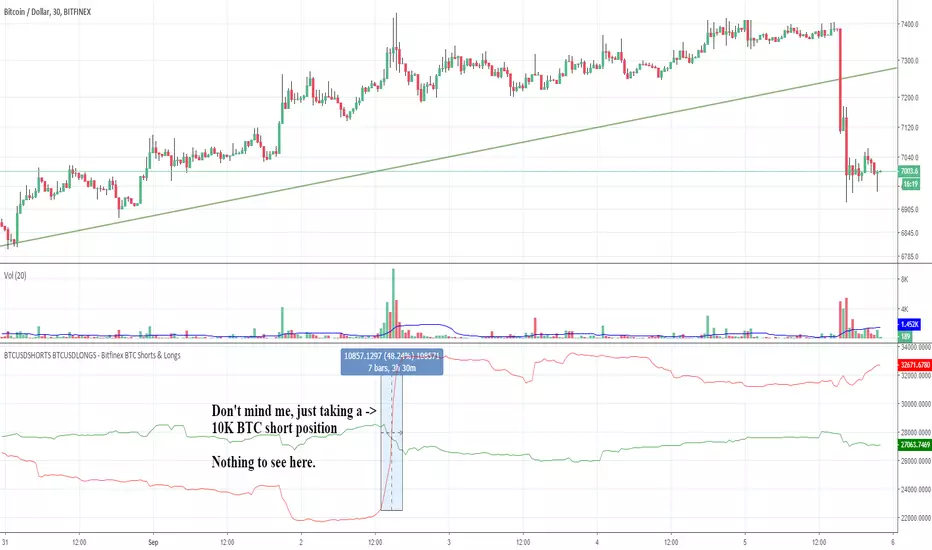
Goldman Drops Trading Desk!!!! Goodbuy, I mean Goodbye.. BitcoinCheck out this news on Bitcoin today Sept. 5th. All credits going to CNBC. Goldman Sachs did NOT settle for the price of Bitcoin. Like I said... too expensive for banks. Retail traders will settle for anything. Not a Investment banker that has back to back months of winning trades for years. Maybe GS will come back to the table at a better price like $1100 or under $1000 a Bitcoin. We may get some bullish months when Bitcoin reach $2500 I hope.

GOLD LONG-TERM ANALYSIS TO CONTINUE 'SHORT'Looking at the long-term analysis on the 1W view of gold, it looks like it is headed downward still. At the moment it is on a retracement up and not to be confused for trend reversal as i do not believe market is reversing just yet until it hits either/both of the 2 horizontal lines in my chart.
1st yellow line at 1130.71 here on tradingview
2nd yellow line at 1056.57 here on tradingview
As platform prices may be different, I suggest setting alerts for both lines here on tradingview and once the alerts go off, then you know it is time to look into going in on whatever platform you trade on.
Please remember to look at what indicators are telling you if you can understand some, as they would likely help you determine a suitable entry point. Also, do set stop losses but be generous with how much room you allow for this due to candle wicks and there is also the posiblity to hedge yourself, for more confident traders imo -0.06% .
All comments and questions welcome, if curious about indicators I use then feel free to inquire.

Goldman Sachs respecting support line longThe chart says it all really, another bounce off our key support line.. we are long on this position
TP and SL are reserved for our clients.
