Gold surges! Gold prices soar!Market news:
In the early Asian session on Wednesday (July 23), spot gold fell slightly and is currently trading around $3,422/oz. Supported by the increasing uncertainty in global trade, the downward trend in U.S. Treasury yields and the weakening of the U.S. dollar, spot gold rose strongly, hitting a five-week high. The market's tension over the August 1 deadline for the implementation of U.S. President Trump's tariffs has intensified, driving safe-haven funds to continue to flow into the international gold market. Investors are focusing on the progress of the U.S. multilateral trade negotiations and the new round of tariffs that the Trump administration is about to launch: while the demand for safe-haven assets has increased, the U.S. 10-year Treasury yield has fallen to a two-week low, further enhancing the attractiveness of non-interest-bearing gold. The global economic slowdown, expectations of loose monetary policy and geopolitical risks will continue to support gold's status as a safe-haven asset. Looking ahead to the market this week, the market focuses on: the Fed's FOMC policy meeting will be held next week. Although the meeting is expected to keep interest rates unchanged, investors have begun to bet on the possibility of a rate cut in October; Fed Vice Chairman Bowman reiterated on Tuesday that the central bank should maintain policy independence, and Powell's upcoming policy meeting may release further signals; in terms of inflation, as signs of tariff costs being transmitted to consumer goods emerge, Powell has previously warned that inflation may accelerate again in the summer.
Technical Review:
Gold maintained its expected bulls and hit a new high yesterday. The daily line maintained a long-term structure of consecutive positive bulls. The MA10/7-day moving average opened upward, and the RSI indicator ran above the central axis. The Bollinger Bands of the hourly and four-hour charts opened upward, the price maintained the middle and upper track channel, and the moving average system opened upward. The idea of gold trading remains unchanged, and the layout is mainly based on buying at a low price and selling at a high price. After a sharp rise last night, gold began to fluctuate at a high level in the second half of the night, and the adjustment was very small, which means that the market is still the strong market. The recent pattern of gold price fluctuations and rises remains. Since it is fluctuating upward, the overall trend of gold today is still biased towards buying, but we need to be alert to the risk of short-term corrections. It is recommended to arrange buy orders based on technical support levels, and pay attention to trade policies and the Fed's trends!
Today's analysis:
Gold buying has been as strong as a rainbow in the past two days, and it is also a buying carnival. Gold is now buying strongly and the momentum is winning. Once the trend is formed, it is necessary to follow the trend. Now the trend of gold buying is very obvious, constantly refreshing the recent highs, so continue to buy gold to the end, and continue to buy if it rises. Continue to buy if it falls during the day!
The gold 1-hour moving average continues to form a golden cross upward buying arrangement. The gold buying power is still there, and gold continues to exert its strength. Gold has risen step by step in the past two days. As long as there is no sharp decline, it is accumulating momentum to attack. The gold support continues to move up. Now it has broken through and stabilized at the 3400 line. If gold falls back to 3400, it can still be bought at low prices.
Operation ideas:
Short-term gold 3400-3403 buy, stop loss 3392, target 3420-3440;
Short-term gold 3438-3441 sell, stop loss 3450, target 3400-3380;
Key points:
First support level: 3412, second support level: 3403, third support level: 3390
First resistance level: 3438, second resistance level: 3450, third resistance level: 3468
Goldminers

XAU/USD(20250723) Today's AnalysisMarket news:
White House officials plan to visit the Federal Reserve headquarters on Thursday local time.
Technical analysis:
Today's buying and selling boundaries:
3416.02
Support and resistance levels:
3465.76
3447.17
3435.12
3396.94
3384.89
3360.33
Trading strategy:
If the price breaks through 3435.12, consider buying, the first target price is 3447.17
If the price breaks through 3416.02, consider selling, the first target price is 3396.94

XAU/USD) Bullish trend analysis Read The captionSMC Trading point update
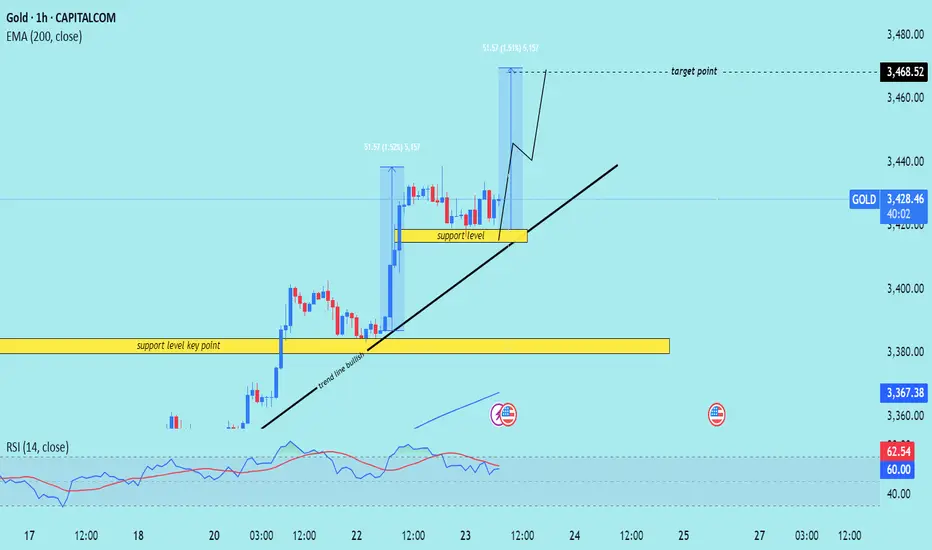
Technical analysis of Gold (XAU/USD) on the 1-hour timeframe. Here's a breakdown of the key trading
---
Technical Overview
Price: $3,428.71 (currently near the upper consolidation)
EMA 200: Around $3,367.38 (well below price, indicating strong uptrend)
Target Point: $3,468.52
Indicators:
RSI (14): 60.19–62.55 → shows moderate bullish momentum, not yet overbought.
---
Key Technical Elements
1. Bullish Breakout Structure:
Price has broken out of a previous range, and is forming a bullish flag or rectangle, which typically leads to continuation higher.
Measured move projection from previous leg (approx. $51.57 gain) targets the $3,468.52 level.
2. Strong Support Zones:
Two yellow zones highlighted:
Upper support level (around $3,415): acting as immediate structure support.
Lower key support (around $3,380): crucial structure level from where the trend initiated.
3. Trend Line Support:
A clearly marked ascending trend line supporting higher lows—indicating bulls are in control.
Expect price to stay above this trend line to maintain bullish bias.
4. Volume & RSI Confirmation:
RSI remains in a bullish zone but isn’t overbought → leaves room for upside.
Volume remains steady, confirming healthy consolidation.
Mr SMC Trading point
---
Conclusion & Trade Idea
Bias: Bullish
Entry Zone: On breakout or retest of minor support ($3,415–$3,420)
Stop Loss: Below trendline or below $3,415
Target: $3,468.52
Confirmation: Hold above trendline + RSI staying above 50
This is a classic bullish continuation setup supported by structure, RSI, and trend momentum. Traders could look for buying opportunities on minor dips or trendline retests.
---
Please support boost 🚀 this analysis)
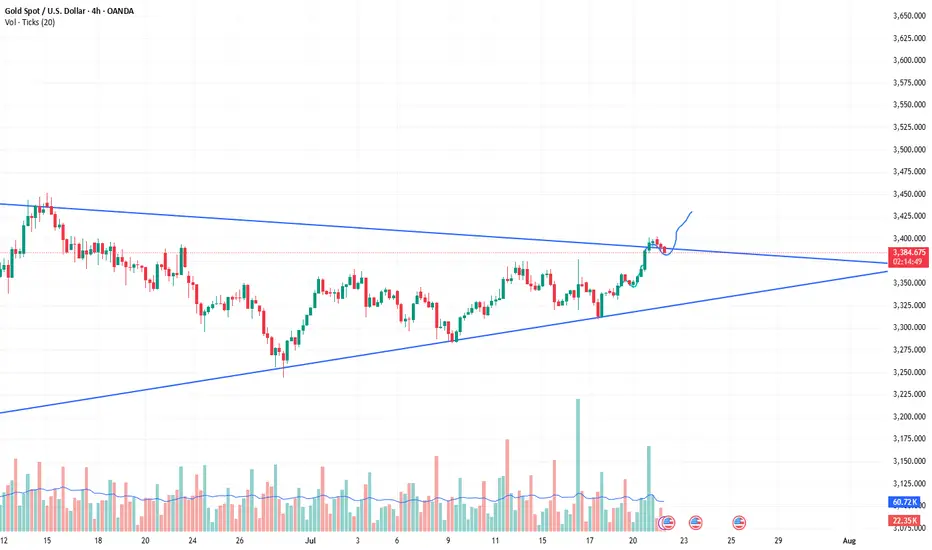
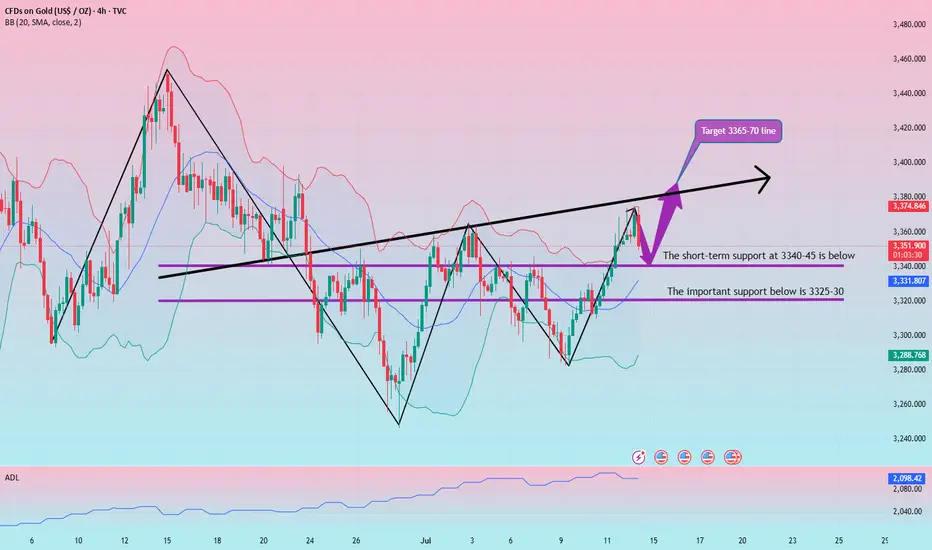
XAU/USD) breakout analysis Read The captionSMC Trading point update
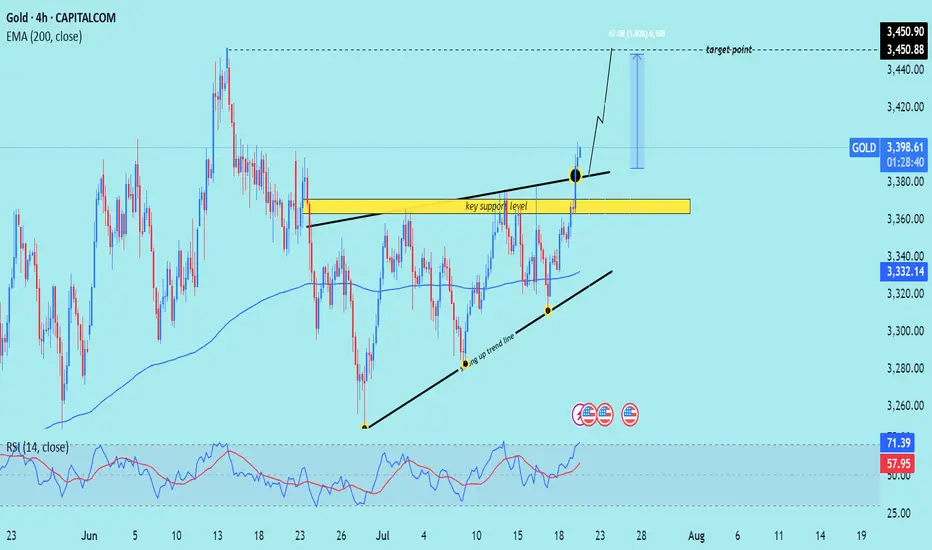
Technical analysis of (XAU/USD) on the 4-hour timeframe, highlighting a move toward the $3,450 target. Here's the full technical breakdown
---
Technical Analysis – Gold (4H)
1. Breakout from Resistance Zone
Price has broken above a key horizontal resistance level (now turned support, marked in yellow).
The breakout is confirmed by a strong bullish candle with momentum, suggesting buyers are in control.
2. Ascending Triangle Formation
Price formed an ascending triangle, a classic bullish continuation pattern.
The breakout above the upper boundary confirms the pattern, projecting a potential measured move.
3. Trendline Support & Higher Lows
The structure shows a rising trendline (black), where price bounced multiple times — confirming a higher low sequence.
The confluence of trendline support + breakout level adds strength to the bullish case.
4. 200 EMA Confluence
The 200-period EMA (3,332.13) has been acting as a dynamic support throughout.
Price retested it earlier in the move, then surged upward — validating trend continuation.
5. RSI Indicator
RSI is at 71.13, entering overbought territory.
This implies strong bullish momentum, but a short-term pullback to retest the breakout level is possible.
6. Target Projection
Target Point: $3,450.90, calculated from the height of the triangle (~61 pts or 1.80%) added above the breakout zone.
A retest of the breakout area (yellow zone) around $3,370–$3,380 could offer a better entry before continuation.
Mr SMC Trading point
---
Summary
Bias: Bullish
Current Price: $3,397.62
Support: $3,370–$3,380 zone (previous resistance turned support)
Trend: Higher lows + breakout above resistance
EMA Support: 200 EMA at $3,332.13
Target: $3,450.90
RSI: 71.13 – bullish but near overbought
Please support boost 🚀 this analysis)
XAUUSD: Fluctuation of $30/ounce. Do you want to know?Yesterday, I frantically notified followers to buy around 3366-3375, and the market finally rose to 3430. This is a huge profit. I will continue to update it in the Band Trading Center Research Institute later. If you don’t want to miss it, follow me. If you see it but are still not sure how to trade. Then you can leave me a message at the Swing Trading Center Research Institute. I will reply to you one by one when I see it.
This week, some followers have achieved weekly profits of 50%-268%. If your profit is not ideal. Or don’t know how to trade. Remember to like and follow. I will lead everyone to victory.
Buy around 3400-3410. When will it close? I will post the results on the Swing Trading Center. Stay tuned.
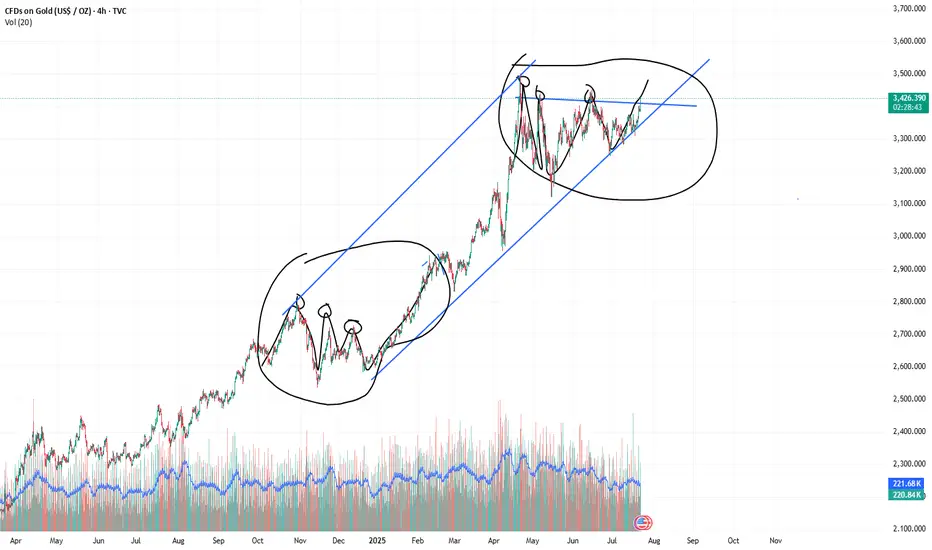
XAUUSD:3450-3500The probability of the same direction of the two histories is 95% similar. This shows one thing. The market may repeat history again.
So buy with me. The next target is 3450-3500
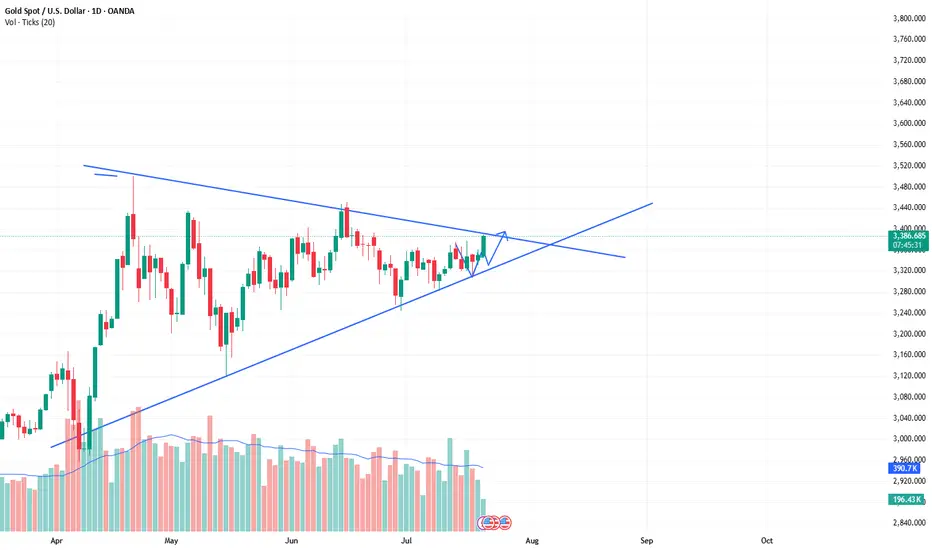
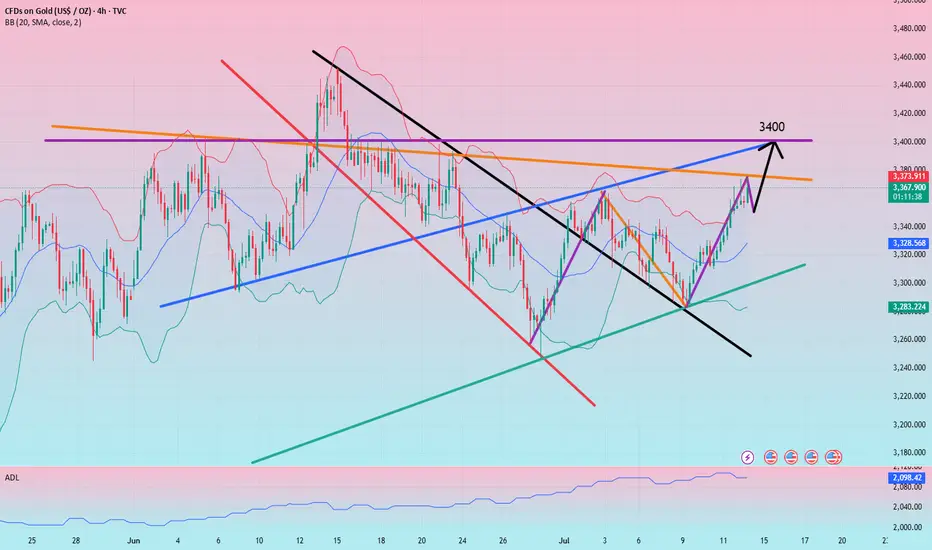
The bull market of xauusd continues, buy and wait for the rise.As predicted in the band trading center in advance over the weekend. The daily level trend is still very stable, and the breakthrough trend has been perfectly carried out. The current quotation is 3388. It is only a matter of time before it rises wildly to the position of 3430. The short-term will definitely break through. The current bull market is clear and has huge potential. The limit of the triangle consolidation phase is about to be broken. Then the bulls will continue to rise. Therefore, buying is the key operation plan.
XAUUSD:Retracement is a buying opportunityAfter the Asian market hit the highest position of 3403, there was some decline. The current gold price is 3386. From the short-term trend of the hourly level. It is still fluctuating at a high level. Combined with the trend of the daily level, there are signs of retracement and counterattack. There is no news dominance. It is purely a technical repair after hitting the high. This retracement can pay attention to the support near 3382-3378. The London and New York markets are still based on buying and profit.
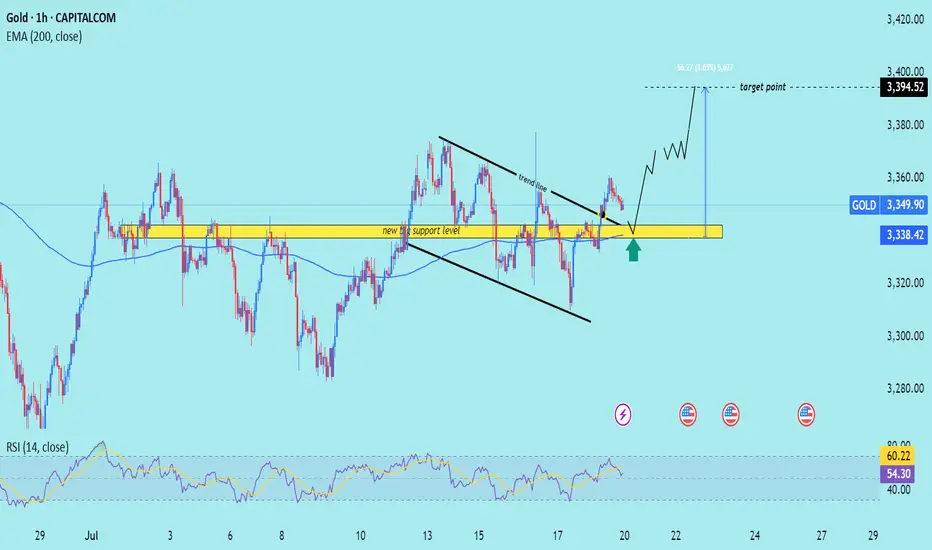
XAU/USD) Bullish trend analysis Read The captionSMC Trading point update
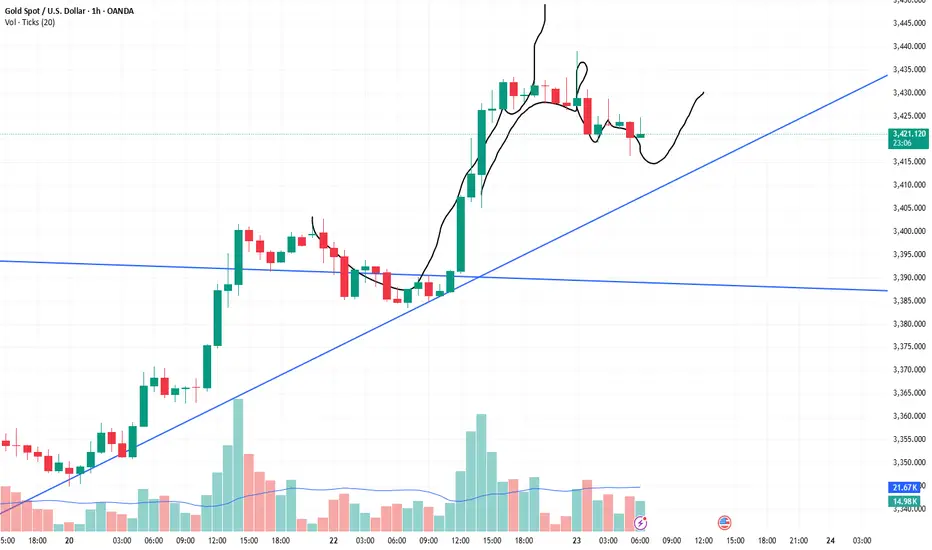
Technical analysis of XAU/USD (Gold) on the 1-hour timeframe. Here’s a breakdown
---
Technical Analysis Summary
Descending Channel Breakout
Price action previously formed a descending wedge/channel, shown by the two black trendlines.
A bullish breakout occurred above the trendline, signaling a shift in momentum from bearish to bullish.
Key Support Zone
The yellow highlighted zone (around $3,338–$3,340) is marked as the “new key support level”.
Price is expected to retest this area (confluence with 200 EMA), which aligns with standard bullish breakout behavior.
The green arrow indicates potential bounce confirmation.
Bullish Projection
After the retest, price is projected to climb steadily toward the target point at $3,394.52.
The setup anticipates around 56.27 points upside, or roughly +1.69% gain from the support zone.
---
Target
$3,394.52 – defined using the previous range breakout height and horizontal resistance.
---
Trade Idea
Entry: On bullish confirmation near $3,338 support zone.
Stop Loss: Just below the yellow zone (e.g., under $3,330).
Take Profit: Near $3,394.
Mr SMC Trading point
---
Conclusion
This is a classic breakout-retest-play, supported by trendline structure, a key horizontal support zone, and RSI strength. As long as price respects the highlighted support, the bullish outlook remains valid.
Please support boost 🚀 this analysis)
Ultra-short-term trading. Profit of $10/ounceThe order to buy XAUUSD successfully made a profit. The current gold price is 3367. Stimulated by the weekend news, the expected trend was achieved smoothly, and the short-term bulls were strong. Buying can continue to be the main focus. Relying on the half-hour and one-hour trends, trading can be carried out in the London market for the purpose of buying and profit. The increase is about $10/ounce.
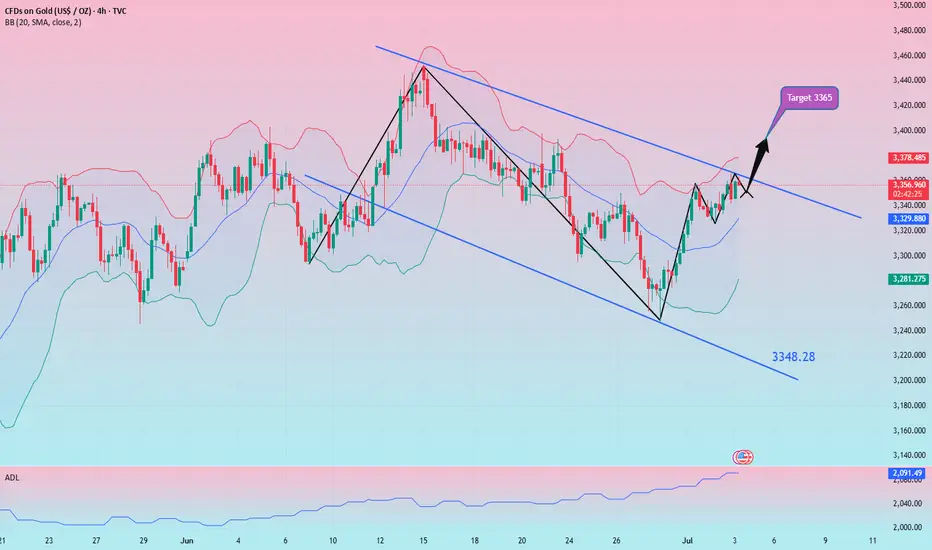
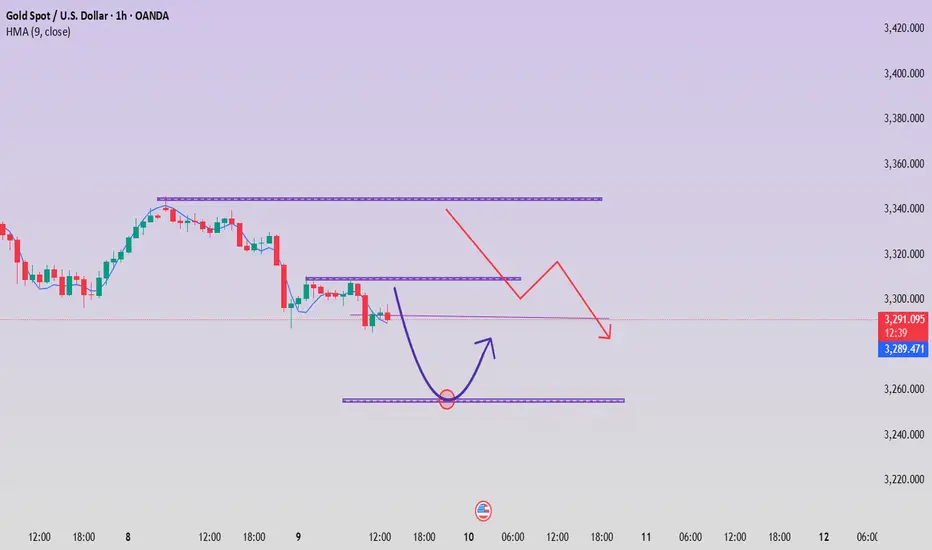
How to find stable trading opportunities in gold fluctuations?Today, the rhythm of gold going short first and then long is perfectly grasped. Congratulations to those who followed the trading plan for reaping good returns. We are still holding long orders at present, and the overall position is arranged around the idea of stepping back to low and long. From the current market structure, the 3325-3320 area below is an important dividing line for the bulls to be strong, and it is also a key support level that determines the subsequent direction. If this area stabilizes, the short-term structure will still be bullish and unchanged, and the rhythm of stepping back to low and long is expected to continue. It is expected that gold will rebound to 3340-3350 and the upper target again. If 3320 is lost, it is recommended to stop loss as soon as possible, and the defense position is recommended to be set below 3315 to prevent the short-term structure from turning short and bringing further callback risks. The core of this round of trend is that only by holding the support can we be qualified to talk about rebound; if the support is lost, we need to turn decisively to prevent being passive. The current market volatility has intensified, but the direction has not yet completely broken. The focus of operation is still on entering the market around key points, switching positions between long and short positions to find the rhythm, blindly chasing orders and emotional operations will be taboos in the current market. Opportunities are not absent, but they belong to those who are always ready. The structure is not broken and the low and long will not change.
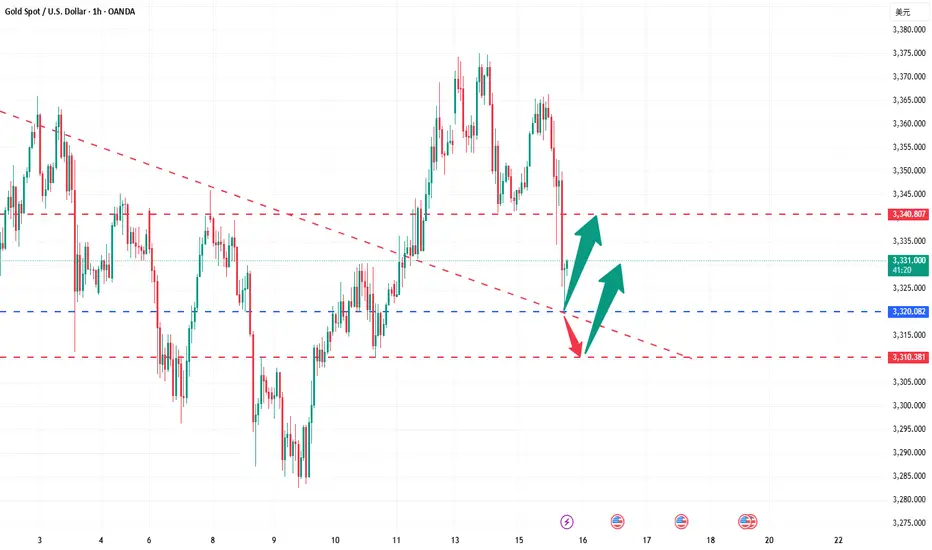
Gold fluctuates downward, go long again when it falls back
Gold is currently fluctuating downward. Although the trend is bullish, we must not rush into the market. The technical side needs to step back. We need to be cautious when going long. We need to grasp the entry position and step back to 3340-45 and then more!
From the 4-hour analysis, the short-term support below focuses on the neckline of the hourly line of last Friday, 3340-45, and the focus is on the support of 3325-30. The intraday step back continues to follow the trend and the main bullish trend remains unchanged. The short-term bullish strong dividing line focuses on the 3325 mark. The daily level stabilizes above this position and continues to follow the trend and bullish rhythm. Before falling below this position, continue to follow the trend and follow the trend. The main tone of participation. I will remind you of the specific operation strategy in the VIP group, and pay attention to it in time.
Gold operation strategy:
Gold goes long at the 3340-45 line when it steps back, and covers long positions at the 3325-30 line when it steps back, stop loss 3317, target 3365-70
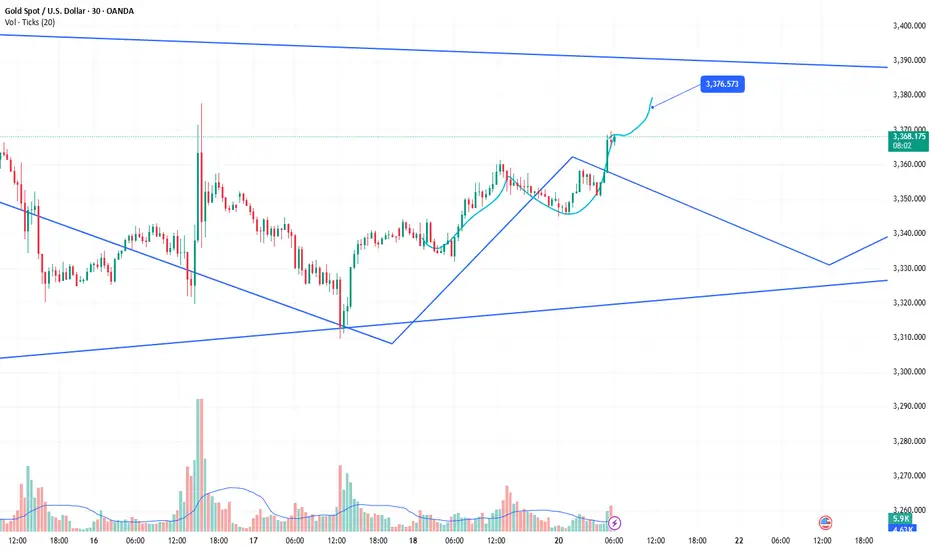
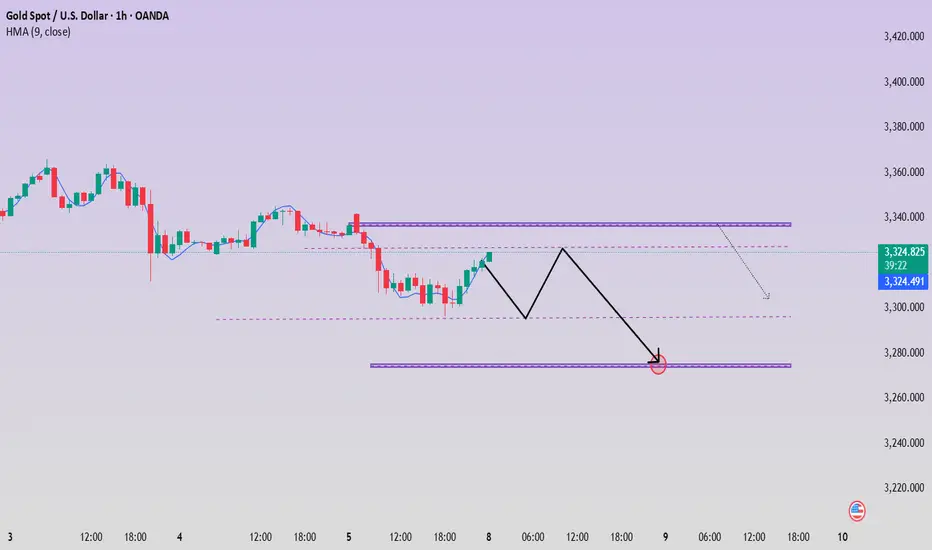
Gold continues to rise after keeping low and breaking high
Last Thursday and Friday, I repeatedly mentioned the position of 3344 to my members. As a strong resistance position in the early stage, every time the price falls below the low point, the pressure to find the bottom and rebound is this area, and then continue to break the low under pressure. This time, we emphasize that breaking through and standing firmly on 3344 is the key. If it can break through and stand firmly, the next resistance is 3358, followed by 3373.
Now the price has broken upward as expected, completing the qualitative change. The next step is to look at the switching of space. Keep low and break high to see acceleration. After breaking the low point, consider sweeping.
Specific key points are expanded:
1. The daily line pattern is still closing and flat. The lifeline is the space switching point in the past one or two months, which will determine the subsequent market space rhythm. At present, the price has successfully broken through the lifeline and switched upward to enter the lifeline to the upper track. 3339-3396
Then, in the case of subsequent market holding the lifeline, maintain the upper range sweep, yes, it is still the rhythm of sweeping, just change the space
2. The four-hour pattern opens slightly upward, pointing to the upward direction
Starting from the lower track 3283 of the squat probe pattern, it has risen steadily. After repeatedly determining the lifeline position 3310 area, it will start to rise further and the pattern will open upward
The lifeline position coincides with the support 3330-3328 area repeatedly determined last Friday, and together they become the last defensive dividing line for the bulls to rise
3. The double-line interval 3330-3325 of the hourly chart has become a space switching area, which previously suppressed the price from falling further, and now it has turned into support, and will rely on the price to further rise Step up, pay attention to the role of the dividing line
4. Maintain the idea of switching with the same profit space, start from 3283 and calculate 3313, then 3328, then 3343, then 3358, and finally 3373, and then 3388, and 3403 (here needs to be highlighted)
5. As shown in the figure, the purple large channel range is swept, the space range is about 100-150 US dollars, this wave of increase is about 100 US dollars, and there is still room to pay attention to. The upper track of the channel overlaps with the upper track of the daily line pattern in the 3396-3400 area, and the 3403 position mentioned above together become the next space dividing line area
In summary, for the current gold, it is still in the rising stage, and the idea remains low and bullish. Pay attention to the process The intensity and amplitude of the adjustment can be squatted to gain leverage, or sideways for a period of time to gain space. Both are ways of correction. After the correction is completed, continue to be bullish and break through.
Referring to this idea, we gave a long position from 3358-3356 in the afternoon. As expected, it sprinted to 3375 as of press time. Those who keep positions should pay attention to the upward loss point, and then pay attention to further rise.
Of course, today's trend will be more tiring, so there is still an opportunity to step back and buy low. Pay attention to the 3364-3362 position to continue to buy low (aggressive 3366 can start), stop loss 3355, target 3380-3388
Another extreme sweep needs to pay attention to the 3342-3339 and 3330-3328 areas. This needs to be determined according to the situation. Pay attention to 3388 and 3396-3403 when switching upward.
XAU/USD technical analysis setup Read The captionSMC trading point update
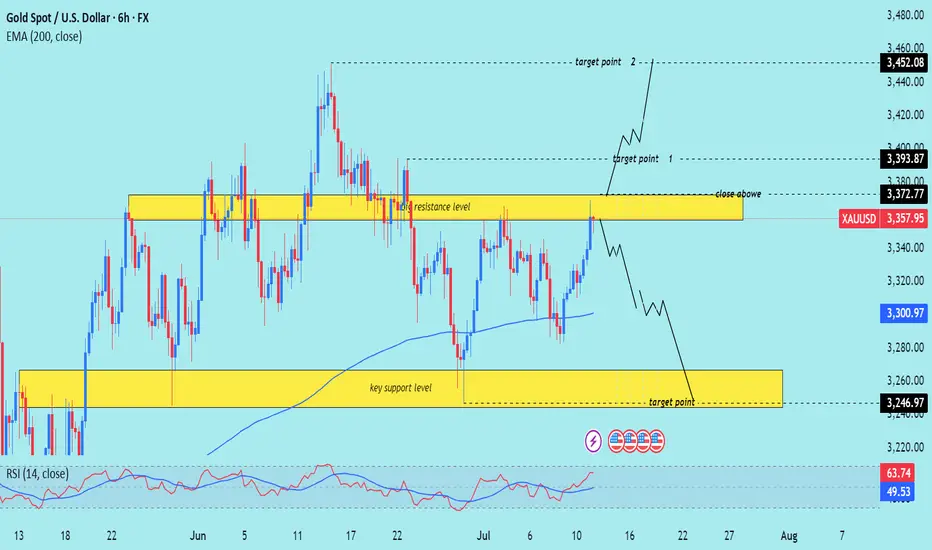
Technical analysis of (XAU/USD) on the 6-hour timeframe, focusing on a key resistance zone that could trigger either a bullish breakout or a bearish reversal.
---
Analysis Summary
Current Price: $3,357.95
Trend Context: Price is testing a strong resistance zone with a possible breakout or rejection in play.
---
Scenario 1 – Bullish Breakout
1. Resistance Zone: $3,357–$3,372
Multiple previous rejections.
A confirmed close above $3,372.77 signals bullish strength.
2. Upside Targets:
Target 1: $3,393.87
Target 2: $3,452.08
3. Indicators:
RSI at 63.74, approaching overbought but still with room to rally.
EMA 200 is trending upward, supporting bullish bias.
---
Scenario 2 – Bearish Rejection
1. If price fails to close above $3,372.77, a rejection from resistance is likely.
2. Downside Targets:
Reversal projected toward the key support zone at $3,246.97
EMA 200 at $3,300.97 may provide temporary support before breakdown.
---
Trade Ideas
Direction Entry Level Stop-Loss Target 1 Target 2
Bullish Close above $3,372 Below $3,346 $3,393.87 $3,452.08
Bearish Rejection from $3,357–$3,372 Above $3,380 $3,300 → $3,246.97
Mr SMC Trading point
---
Summary
This is a critical decision point for Gold. A breakout above resistance can propel price to $3,450, while rejection could drive price back to $3,246. The reaction at the current zone will dictate the next major swing.
Please support boost 🚀 this analysis)
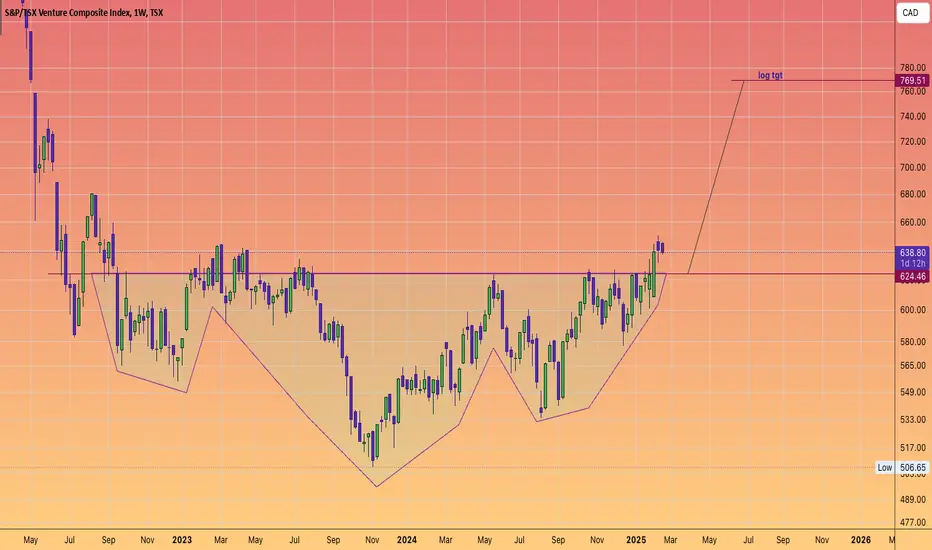
Canadian Venture index --- Inverse head & shouldersGold has reached unprecedented heights, approaching the $3000 mark—a prediction we made with precision. Now is the moment to turn our attention to silver and the mining sector.
To start, let's examine the Canadian venture index, which is displaying a promising inverse head and shoulders pattern. I am confident that the logarithmic projection will be achieved without much difficulty.
Gold resumes its rally
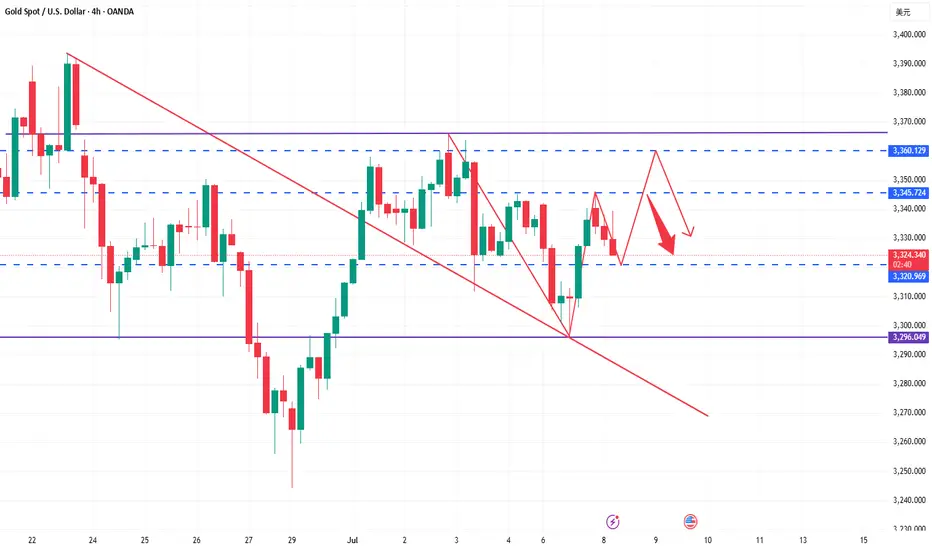
From the 4-hour analysis, the upper side focuses on the short-term suppression of 3345-50. Today's lower support focuses on the vicinity of 3309-16. The short-term bullish strong dividing line is near 3295-3301. The overall bullish rhythm of high-altitude and low-multiple continues to remain unchanged. Before the daily level falls below the 3300 mark, any retracement is a long opportunity. Short orders against the trend should be cautious.
Gold operation strategy:
1. Go long on gold when it falls back to 3316-25, stop loss at 3307, target at 3340-45, and continue to hold if it breaks;
2. Go short on gold when it rebounds to 3345-50, stop loss at 3357, target at 3320-3326, and continue to hold if it breaks;
Gold rebound is powerless and waiting for catalyst! European sup
In the Asian session on Wednesday, spot gold suddenly fell rapidly in the short term, falling to the lowest level of 3284. At present, gold is firmly bearish in the near term, and the price of gold may fall to $3247/ounce. The Federal Open Market Committee (FOMC) is scheduled to release the minutes of the June monetary policy meeting on Wednesday. This document may reiterate what speculative interest already knows, that is, Fed officials are satisfied with their recent wait-and-see stance.
The Federal Open Market Committee (FOMC) will release the minutes of the June monetary policy meeting. The minutes of the Fed's June 17-18 meeting to be released will send a more dovish signal than expected, and the "wait-and-see period" for rate cuts may end in late summer.
Views on today's gold trend!
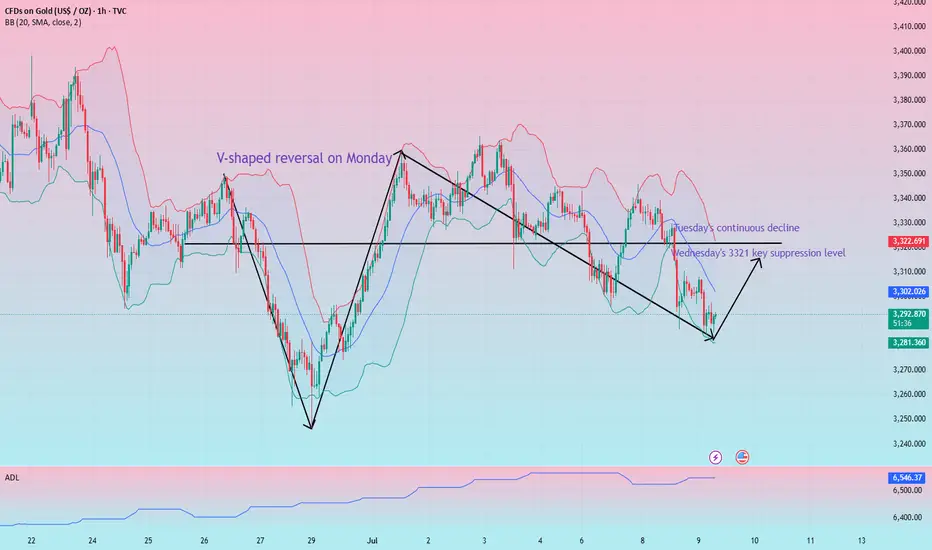
Looking back at the market, it fell first and then rose on Monday, and then retreated directly on Tuesday. The market turned so sharply, and after gold broke below 3300 again yesterday, the market tended to be weak. At present, the upward trend of gold is still in effect, but buyers seem to be losing momentum. It is worth noting that the relative strength index (RSI) triggered a "sell signal" as the index fell below 50, indicating that sellers outnumbered buyers.
From the perspective of price action, gold prices need to fall below the June 30 low of $3,246/oz to pave the way for further declines. From the 4-hour trend chart and the daily trend, the key node of opening pressure is around 3,321. This position is the low point of yesterday's sideways trading, and it is also the key suppression level of the trend line and the moving average. If you want to weaken again today, this position cannot stand firm, and the support below will first look at the double support of 3,376 and 3,247!
Gold: Short near 3,321, defend 3,331, and target 3,296-3,285! Enter long orders if it falls back to around 3,276 without breaking, defend 70, and target 3,310! If it continues to break, wait for the 3,347 first-line support to take more!
Gold fell under pressure, and the watershed is 3321.
⭐️Gold Information:
During the Asian session on Wednesday, gold prices (XAU/USD) continued to be under pressure, falling below the $3,300 mark, hitting the lowest point in more than a week. The decline in gold prices comes as the market generally believes that the Federal Reserve (Fed) will maintain high interest rates for a longer period of time, especially as the market expects that tough U.S. tariffs may exacerbate inflation in the coming months.
Such expectations have pushed up U.S. Treasury yields and stabilized the U.S. dollar (USD) near a two-week high hit on Tuesday - a key resistance for the non-yielding precious metal, which continues to face downward pressure.
⭐️Personal comments:
Gold price fell below support, Dow Jones H1 pattern, gold price fell below 3300
⭐️Set gold price:
🔥Sell gold area: 3344-3446 SL 3351
TP1: $3335
TP2: $3320
TP3: $3302
🔥Buy gold area: $3256-$3254 SL $3249
TP1: $3268
TP2: $3280
TP3: $3298
⭐️Technical analysis:
Set reasonable sell orders based on technical indicators EMA 34, EMA89 and support and resistance areas.
After repeated tug-of-war, where will gold go?At present, the gold market is divided between long and short positions. The Federal Reserve may maintain high interest rates, which weakens the investment appeal of gold; however, trade frictions and geopolitical risks provide safe-haven support for gold. Overall, market sentiment is mixed, with bulls lacking confidence, but bears have not been able to fully control the situation. Last week's strong non-farm data reduced market expectations for a rate cut in July, pushing up U.S. bond yields and the dollar, putting pressure on gold, which does not generate interest. In addition, Trump said on social media that he would impose a 10% tariff on countries that "support anti-U.S. policies." The market is waiting for the release of the minutes of the Fed's June meeting, which will more clearly show policymakers' views on the current economic situation and future policies, and may determine the direction of interest rates. If the minutes show that the Fed is inclined to maintain high interest rates for a longer period of time, gold prices may continue to face downward pressure.
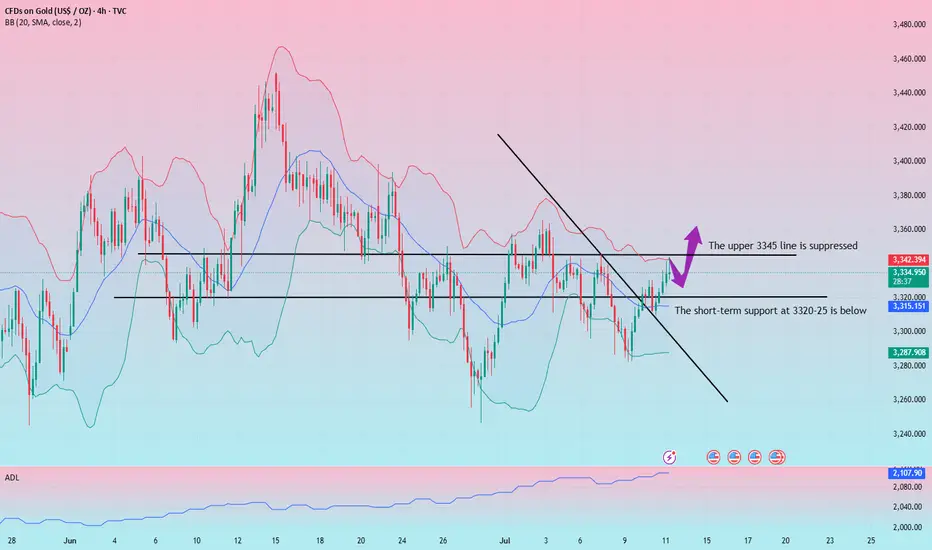
From a technical perspective, gold was under pressure at a high level at the opening, so gold is expected to fall today. Today's key pressure level is 3345. Before the price effectively breaks through and stabilizes at 3345, any rebound is a short-selling opportunity; once it stabilizes at 3345, the bottom pattern is confirmed to be established, and the bulls will start an upward market. At this time, the short-selling idea should be abandoned. From a technical point of view, the 1-hour chart has shown a trend from weak to strong, and the Bollinger Bands are opening and diverging upward, indicating that the market may accelerate upward. Today's operation suggestion is to focus on low-long and high-short as a supplement. In terms of specific points, the lower support is 3327-3320, and the upper resistance is 3355-3360.
Operation strategy:
1. It is recommended to buy gold when it rebounds to around 3327-3320, with the target at 3340-3350.
2. It is recommended to sell gold when it rebounds to around 3345-3355, with the target at 3330-3320.
Bearish pressure below 3,300 at the start of the week
📌 Driving Events
Gold prices (XAU/USD) faced renewed selling pressure in early Asian trading on Monday, falling to the $3,320 level. Gold's pullback came as stronger-than-expected U.S. nonfarm payrolls data for June reshaped market expectations for the Federal Reserve's (Fed) policy path. Investors are now turning their attention to the Federal Open Market Committee minutes, which will be released on Wednesday, for further guidance.
The U.S. added 147,000 jobs in June, better than expected and slightly higher than the revised 144,000 in May. Meanwhile, the unemployment rate remained stable at 4.1%. These data reinforce the view that the labor market remains resilient, reducing the likelihood of an imminent rate cut by the Federal Reserve. As a result, the U.S. dollar strengthened, weighing on non-yielding assets such as gold.
📊Comment Analysis
The decline at the beginning of the week, gold prices give up accumulation below 3300
💰Strategy Package
⭐️Set gold price:
🔥Sell gold area: 3337-3339 SL 3344
TP1: $3328
TP2: $3312
TP3: $3300
🔥Buy gold area: $3297-$3295 SL $3290
TP1: $3308
TP2: $3320
TP3: $3330
⭐️ Note: Labaron hopes that traders can properly manage their funds
- Choose the number of lots that matches your funds
- Profit is 4-7% of the fund account
- Stop loss is 1-3% of the fund account
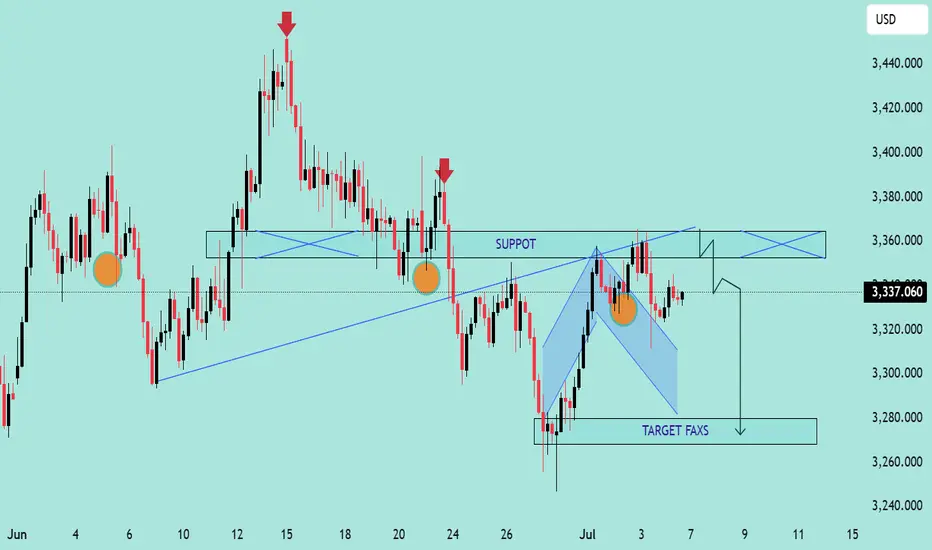
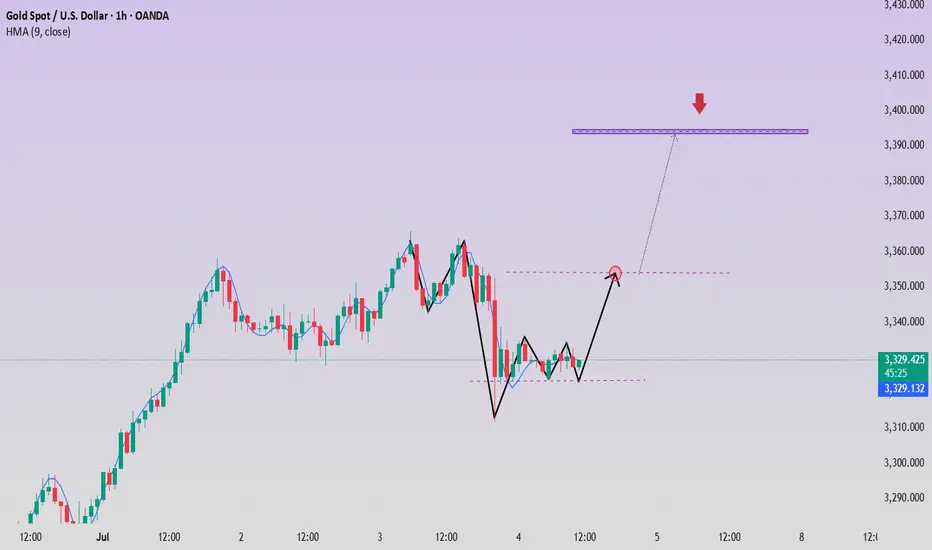
GOLD/USD Bearish Rejection From Resistance Zone – Potential DropGOLD/USD Bearish Rejection From Resistance Zone – Potential Drop Ahead! 🎯
📊 Technical Analysis Summary:
The chart illustrates a bearish setup forming after multiple rejection points near a key resistance zone around 3,360–3,380 USD.
🔍 Key Observations:
🔴 Double Rejection Pattern:
Red arrows highlight strong bearish rejections from resistance.
Indicates sellers are defending this zone aggressively.
🟠 Support Turned Resistance:
The previous support (labelled as "SUPPOT") is now acting as resistance.
Classic bearish retest behavior.
🔷 Bearish Flag Formation:
Price consolidates in a descending flag pattern.
Breakdown below the flag suggests continuation to the downside.
🎯 Target Zone:
If breakdown confirms, price may drop towards target area near 3,275–3,280 USD (marked as “TARGET FAXS”).
🟧 Important Reaction Zones:
Multiple orange circles indicate zones of high reaction – historically significant for both buyers and sellers.
📌 Conclusion:
Unless bulls reclaim the 3,360–3,380 resistance zone convincingly, the bias remains bearish, and the next leg down may target the 3,280 USD area.
🔔 Traders should watch for a clean break below 3,320 to confirm bearish continuation.
Gold fluctuates during the day, short-term profits will be left
📌Main driving events of gold
The big non-agricultural data in the United States caused the gold price to fall by almost 40 US dollars in one breath, but after a short emotional storm, the market returned to calm. Today's market began to bottom out and rise. As of now, the non-agricultural market has been backed by 50%, and the energy of the shorts has been basically digested. Next, the bulls will start to exert their strength! Today's direction is still the same and continue to be bullish!
📊Comment analysis
In the US market, the gold price rebounded after the decline and the bottom of the second retracement appeared. The support level is 3322. After a night of fluctuations, gold has begun to rise, and the low point has begun to rise. The key point of the day is still 3323. In the morning, we wait for the gold price to fall back to around 3323 and we will buy the bottom and go long. We don’t expect to surpass yesterday’s high point during the day, but at least it will go to 3350!
💰Strategy Package
Long position:
Gold long at 3322-3327, stop loss 3315, target 3350-3360
⭐️ Note: Labaron hopes that traders can properly manage their funds
- Choose the number of lots that matches your funds
Gold strengthens, looking for low-buy opportunities
In the matter of trading, everyone's cognition and operation are different, and it is difficult to find people who can really resonate. This huge difference in trading cognition makes many traders often fall into a situation of having nothing to say in social interaction, and it is difficult to find bosom friends who can really discuss trading in depth and understand each other.
1. The US ADP National Employment Report released yesterday showed that private employment decreased by 33,000 in June, which was the first net decrease in jobs since March 2023, in sharp contrast to the 29,000 increase in May after the downward revision. The market had expected 95,000 jobs to increase in June, and this unexpected decline has raised investors' doubts about the health of the US labor market. So I think the unexpected weakness of the ADP data has led the market to bet on the Fed's interest rate cut, and this expectation has driven the rise in gold prices in the short term.
2. The trade agreement reached between the United States and Vietnam reduced the tariffs previously planned to be imposed on Vietnamese exports, easing market concerns about trade tensions. I believe that against the backdrop of increasing global economic uncertainty, gold's position as a safe-haven asset has become increasingly solid, which will become an external factor affecting the gold market in the future.
Technical aspects:
Weekly chart: Upward trend, long-term buy on dips.
Daily chart: Symmetrical triangle consolidation, cautious wait-and-see in the medium term.
4-hour chart: Downward channel breaks upward, short-term buy on dips.
30-minute chart: Upward trend, short-term buy on dips.
Intraday operations focus on bullish opportunities in the 3350 area, defend 3343. Continue to look above 3365.