XAUUSD Weekly Outlook – August 4–8, 2025
The question isn’t whether gold is strong. The question is — will price expand, or rebalance?
🔸 Macro Overview
Gold begins the week consolidating just below its final HTF supply zone (3439), while USD weakens amid mixed macro data and growing speculation of future rate cuts. Markets await fresh catalysts, and gold’s recent impulsive rally is now facing the big test: break the wick, or pull back?
🔸 Weekly Structure & Bias
Element Observation
🔹 Trend Bullish continuation — clean structure
🔹 Last BOS March 2025 — impulsive, with imbalance below
🔹 Price Action Top wick rejection forming near 3439
🔹 Bias Still bullish, but entering exhaustion zone
🔹 RSI Above 70 — overheated
🔹 EMAs EMA5 > EMA21 > EMA50 > EMA100 — perfect trend
🔸 Key Weekly Levels (Zones + Confluences)
Zone Type Price Range Confluences
🔴 Supply 3350 – 3439 HTF wick supply + FVG + RSI 70+ + liquidity trap
🔵 Demand 3270 – 3215 Weekly OB + FVG + EMA21 support
🔵 Demand 3120 – 3070 Old BOS + deep FVG + psychological level
🟢 Support 3000 zone EMA50 + historical consolidation
🔸 Fibonacci Extensions (Above 3439)
Extension Level Price Target Confluences
1.0 (Swing Full) 3439 Supply wick high
1.272 3505 Next psychological milestone
1.414 3560 Mid-extension + liquidity
1.618 3610 Golden expansion target
2.0 3740 Full trend extension (max)
🔺 These levels serve as potential breakout targets ONLY if we get a confirmed weekly close above 3439 with clean BOS on LTF.
🔸 Weekly Scenarios
🟢 Scenario 1 – Break and Expand
If gold breaks 3439:
Expect clean continuation to 3505 → 3560 → 3610
Best entries come from new OBs on H4/D1 around 3350–3370
Follow momentum — but don’t chase without retrace confirmation
🔻 Scenario 2 – Rejection + Retracement
If price holds below:
Pullback toward 3270 – 3215 expected
EMA21 acts as dynamic support
If selloff gains strength, next demand = 3120 – 3070
🎯 This zone aligns with macro OB + re-entry for long-term bulls.
🔸 Conclusion & Gameplan
Gold is pressing against its final weekly ceiling.
Structure remains bullish, but every sniper knows — at the edge of premium, timing is everything.
✅ Above 3439 → expansion opens to 3505 → 3560 → 3610
🟦 Below 3439 → retracement into 3270 → 3215 → 3070
The best setups will be born from confirmation, not prediction. Let the market decide.
—
What would you do if 3439 rejects hard this week?
Comment your plan, tag your sniper level, and let’s stay ahead together 💬
—
With clarity, confidence, and perfect timing,
GoldFxMinds 💙
Disclosure: Analysis based on Trade Nation (TradingView) chart feed.
Goldoutlook

GOLD Weekly Idea💡Why Gold Pulled Back
- Gold pulled back today after hitting $3439.04, just below resistance at $3451.53. Traders took profits ahead of key Fed and trade headlines. Right now, it’s trading around $3414.48, down 0.50%.
- The dip came after the U.S.-Japan trade deal eased geopolitical tension, cutting safe-haven demand. Plus, U.S. bond yields are climbing (10-year at 4.384%), which adds pressure on gold.
Support is building at $3374.42, with stronger buying interest expected around $3347.97 and the 50-day moving average at $3336.40 — a key level bulls want to defend.
Short-term looks a bit weak, but as long as gold holds above the 50-day MA, the bullish trend remains intact. Longer-term, weakness in the dollar, central bank gold buying, and concerns about Fed independence could push prices higher.
🔍Watching the Fed’s July 29–30 meeting next
XAUUSD (GOLD): Wait For The BOS! FOMC and NFP Looms!In this Weekly Market Forecast, we will analyze the Gold (XAUUSD) for the week of July 28 - June 1st.
Gold is in the middle of a consolidation. Bas time to look for new entries!
FOMC on Wednesday and NFP on Friday. Potential news drivers to move price in a decisive direction!
Wait for a break of structure (BOS) either direction before entering a new trade.
Be mindful that the Monthly is bullish, and the Weekly is neutral.
The Daily is bearish, with 3 days of data indicating so. I am leaning towards this bias, as the draws on liquidity are near and obvious.
Enjoy!
May profits be upon you.
Leave any questions or comments in the comment section.
I appreciate any feedback from my viewers!
Like and/or subscribe if you want more accurate analysis.
Thank you so much!
Disclaimer:
I do not provide personal investment advice and I am not a qualified licensed investment advisor.
All information found here, including any ideas, opinions, views, predictions, forecasts, commentaries, suggestions, expressed or implied herein, are for informational, entertainment or educational purposes only and should not be construed as personal investment advice. While the information provided is believed to be accurate, it may include errors or inaccuracies.
I will not and cannot be held liable for any actions you take as a result of anything you read here.
Conduct your own due diligence, or consult a licensed financial advisor or broker before making any and all investment decisions. Any investments, trades, speculations, or decisions made on the basis of any information found on this channel, expressed or implied herein, are committed at your own risk, financial or otherwise.

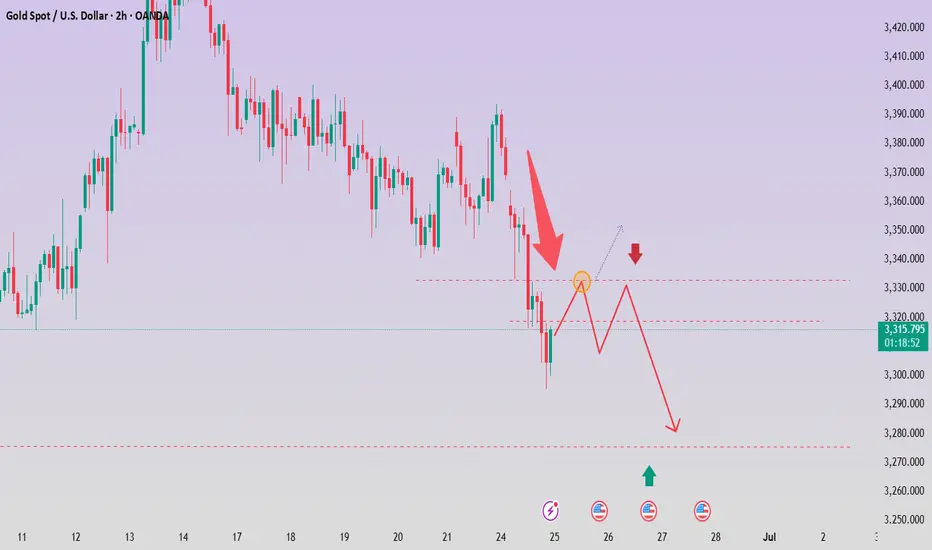
GOLD (XAU/USD) SHORT TRADE PLAN
July 25, 2025
Trade Overview (My setup)
- Direction: Short (SELL)
- Entry Price: $3,330
- Take-Profit: $3,270
- Stop-Loss: $3,370
- Lot Size: 0.18 lots (18 oz)
- Risk: $720
- Reward: $1,080
- Risk/Reward Ratio: 1.5 : 1
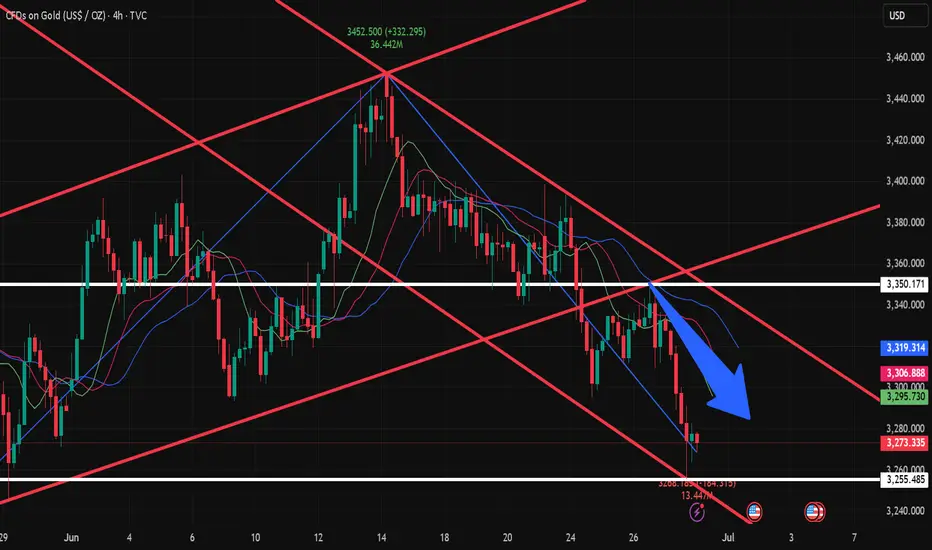
Technical Analysis Supporting the Bearish Bias
1. Price Structure & Trend
- Descending channel observed on the 4H chart - strong short-term bearish signal.
- Series of lower highs and lower lows confirms bearish trend.
- Price is testing $3,325-$3,300 support - breakdown opens downside to $3,270-$3,250.
2. Key Support/Resistance Zones
- Key support: $3,300 being tested.
- Resistance: $3,360-$3,370 zone - logical stop-loss location.
3. Indicator Confirmations
RSI (4H): ~35-40, bearish territory, no bullish divergence.
Moving Averages: Price below 50 EMA and 200 EMA - bearish crossover.
MACD: Bearish crossover, histogram confirms selling momentum.

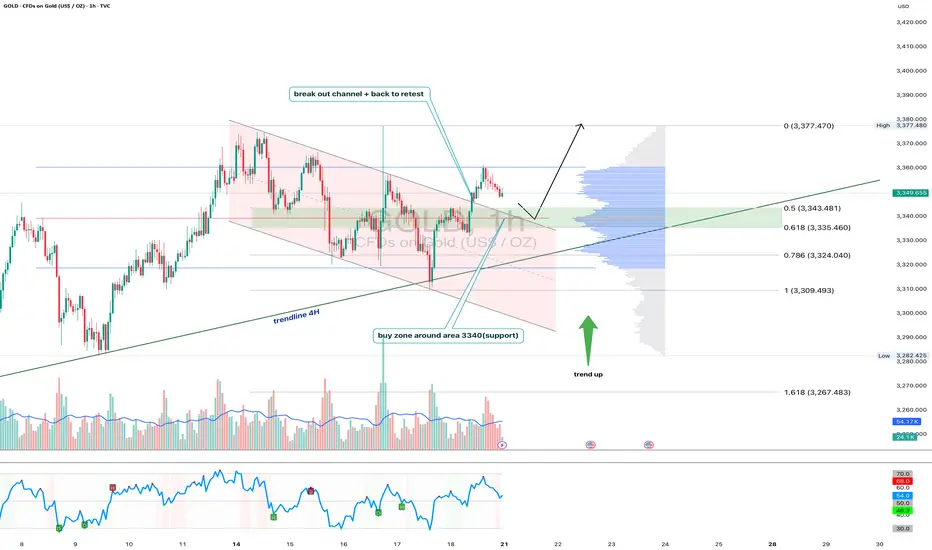
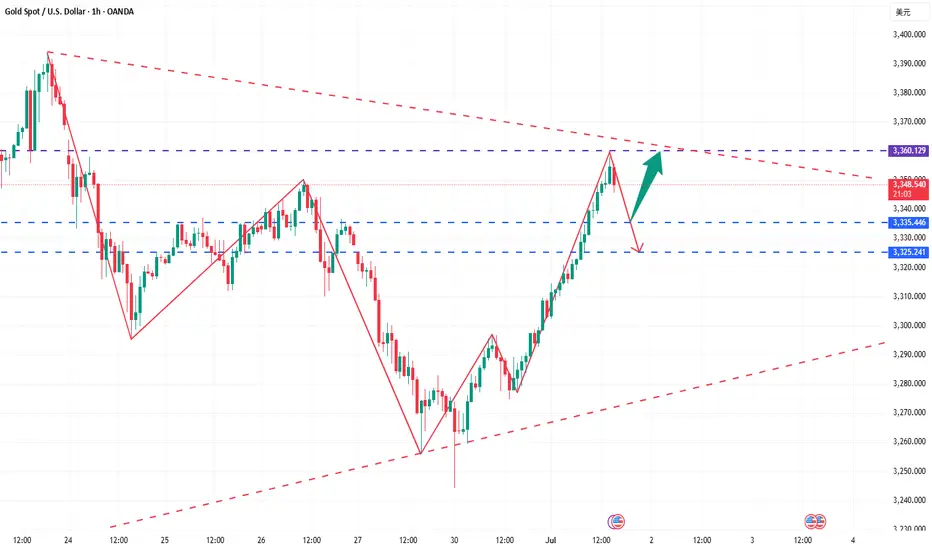
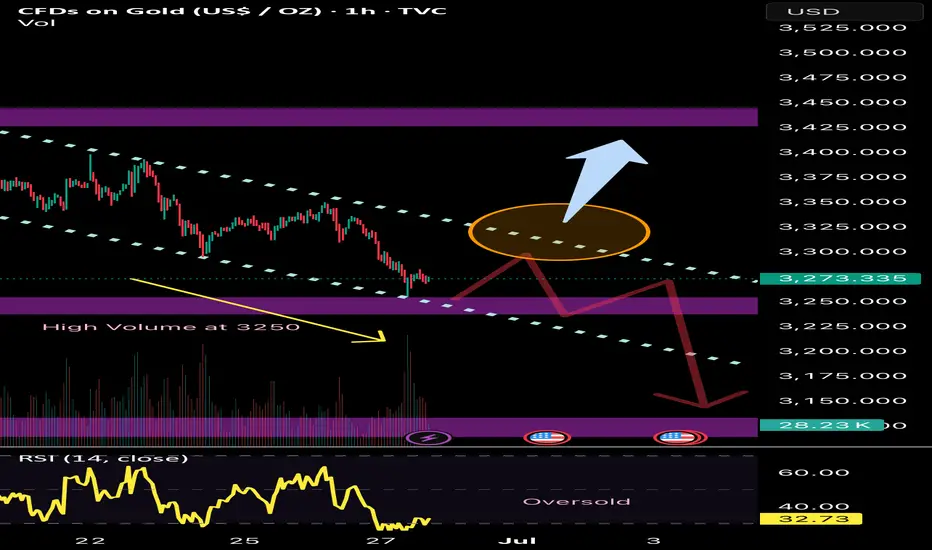
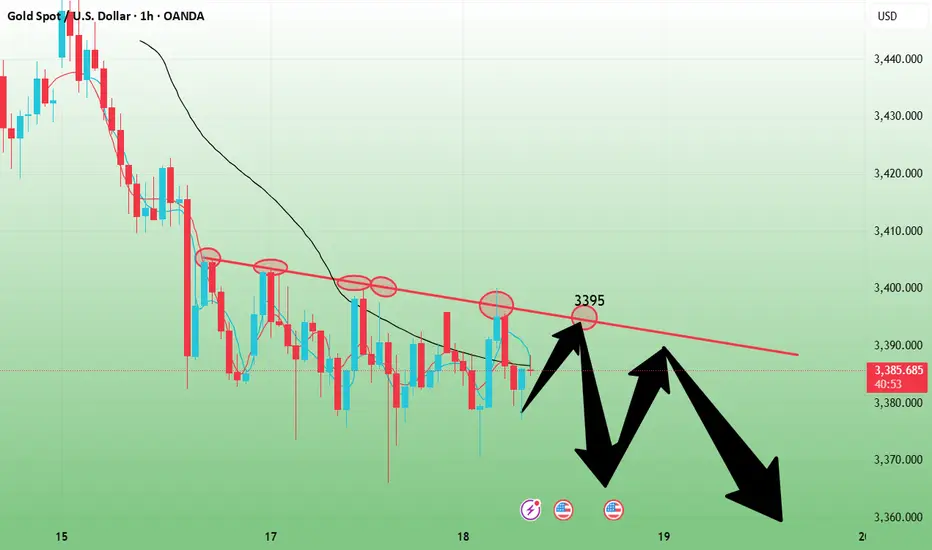
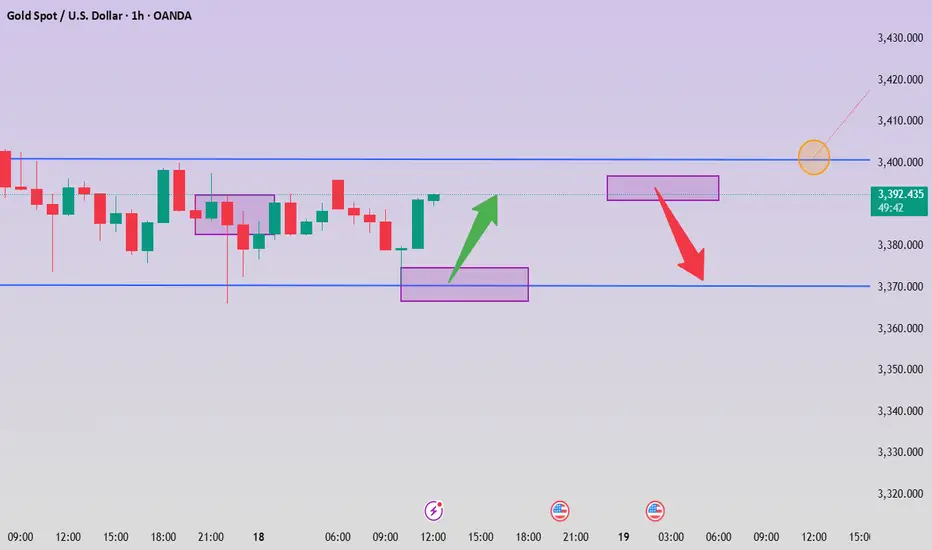
Gold 1H - Retest of channel & support zone at 3340After breaking out of the falling channel, gold is currently retesting its upper boundary — now acting as support. The 3340 zone is particularly important as it aligns with the 0.618 Fibonacci level and high volume node on the visible range volume profile. The price action suggests a potential bullish rejection from this area. With both the 50 and 200 EMA below price on the 1H, the short-term trend remains bullish. The 4H trendline further supports this setup. RSI is cooling off near the neutral zone, leaving room for another leg higher toward the 3377 resistance zone. If 3340 fails, 3324 (0.786 Fibo) becomes the next line of defense. Until then, the structure remains bullish following the successful breakout and retest of the channel.
GOLD! Pre-Market Analysis For Friday July 18th!In this video, we'll present pre-market analysis and best setups for Friday July 18th.
Enjoy!
May profits be upon you.
Leave any questions or comments in the comment section.
I appreciate any feedback from my viewers!
Like and/or subscribe if you want more accurate analysis.
Thank you so much!
Disclaimer:
I do not provide personal investment advice and I am not a qualified licensed investment advisor.
All information found here, including any ideas, opinions, views, predictions, forecasts, commentaries, suggestions, expressed or implied herein, are for informational, entertainment or educational purposes only and should not be construed as personal investment advice. While the information provided is believed to be accurate, it may include errors or inaccuracies.
I will not and cannot be held liable for any actions you take as a result of anything you read here.
Conduct your own due diligence, or consult a licensed financial advisor or broker before making any and all investment decisions. Any investments, trades, speculations, or decisions made on the basis of any information found on this channel, expressed or implied herein, are committed at your own risk, financial or otherwise.

The weekend closed higher to around 3360
📌 Driving Events
Gold prices (XAU/USD) were on track to rise for the third consecutive day on Friday, climbing to the upper limit of this week's trading range as escalating trade tensions fueled safe-haven demand. Amid a significant intensification of global trade disputes, U.S. President Donald Trump this week sent formal notices to multiple trading partners detailing individual tariff rates that will take effect on August 1 if no agreement is reached. This has disrupted investor sentiment, weighed on risk assets, and provided solid support for gold.
Meanwhile, expectations of an imminent rate cut by the Federal Reserve (Fed) have cooled after last week's strong U.S. jobs data. As a result, the U.S. dollar (USD) remained firm, holding near more than two-week highs set on Thursday. A stronger dollar could limit upside for the non-yielding gold in the short term. Therefore, traders could look for a sustained breakout before going further bullish on the XAU/USD pair.
📊Personal comments:
Gold price broke through 3330, maintained good buying pressure, and rebounded over the weekend
⭐️Set gold price:
🔥Sell gold area: 3367-3369 SL 3374
TP1: $3355
TP2: $3342
TP3: $3325
🔥Buy gold area: $3306-$3308 SL $3301
TP1: $3315
TP2: $3325
TP3: $3338
⭐️ Note: Labaron hopes that traders can properly manage their funds
- Choose a lot size that matches your funds
Trump's new tariffs are coming, will gold soar?
✏Hello everyone, let's comment on the gold price next week (July 7, 2025-July 11, 2025)
. ⭐️Gold Information:
This week, the spot gold price showed a trend of rising first and then falling. From Monday to Wednesday, driven by safe-haven demand and the weakness of the US dollar, the gold price recorded three consecutive increases, climbing rapidly from US$3,271/ounce to the intraday high of US$3,365/ounce on Wednesday afternoon, showing strong upward momentum. However, on Thursday, before the release of the June non-farm payrolls data, market sentiment turned, and the gold price plummeted to US$3,312/ounce, the largest single-day drop in the week. On Friday, affected by the light trading during the US Independence Day holiday, the gold price fluctuated between US$3,330 and US$3,355/ounce, closing at around US$3,337/ounce, up about 1.91% for the week.
U.S. President Donald Trump announced that the U.S. will begin sending formal letters to trading partners on Friday, ahead of a July 9 deadline, outlining new tariffs ranging from 10% to 70%, which will take effect on August 1. Treasury Secretary Scott Bessant added that a series of trade agreements are expected before the deadline, with an estimated 100 countries facing reciprocal tariffs of at least 10%. He also hinted that some agreements will be announced soon.
⭐️Labaron personal comment:
Gold prices continue to consolidate sideways, fluctuating in the 3242-3450 range
The following important key areas have been identified:
Resistance: $3362, $3393, $3446
Support: $3312, $3279, $3241
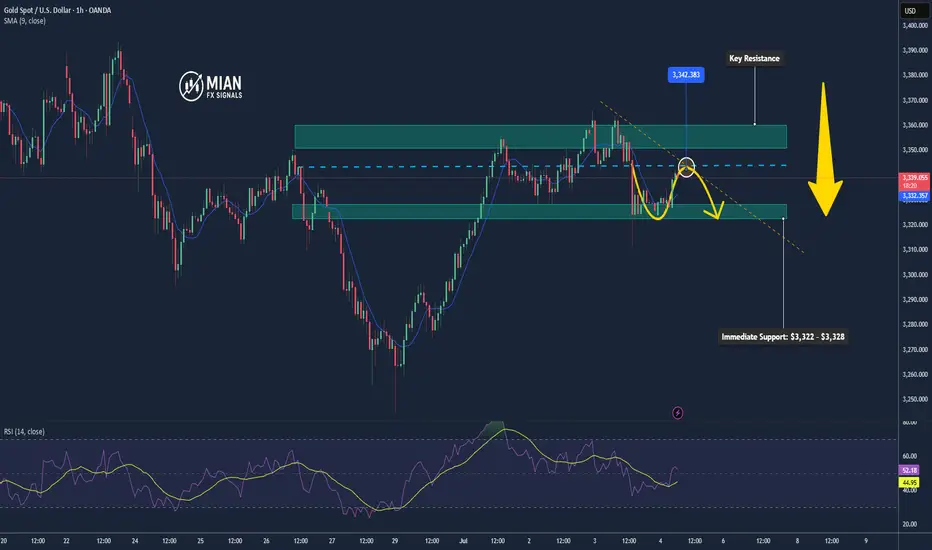
Gold Pulls Back After Strong US NFP Data📊 Market Overview:
U.S. June Non-Farm Payrolls came in at 147,000 vs. 110,000 expected, strengthening the dollar and reducing expectations for a July Fed rate cut. As a result, gold dropped nearly 1%, trading in the $3,328–3,332 zone
📉 Technical Analysis:
• Key Resistance: $3,350 – $3,360
• Immediate Support: $3,322 – $3,328
• EMA: Price has fallen below the 09 EMA, indicating a bearish short-term trend.
• Candle/Volume/Momentum: A strong bearish candle with increased volume shows significant selling pressure post-NFP
📌 Outlook:
Gold may continue its downtrend in the short term if the dollar remains strong and no fresh bullish triggers emerge. A drop toward $3,322–$3,328 is possible.
💡 Trade Ideas:
🔻 SELL XAU/USD at: $3,342 – $3,345
🎯 TP: $3,322
❌ SL: $3,348
🔺 BUY XAU/USD at: $3,322 – $3,325
🎯 TP: $3,345
❌ SL: $3,316
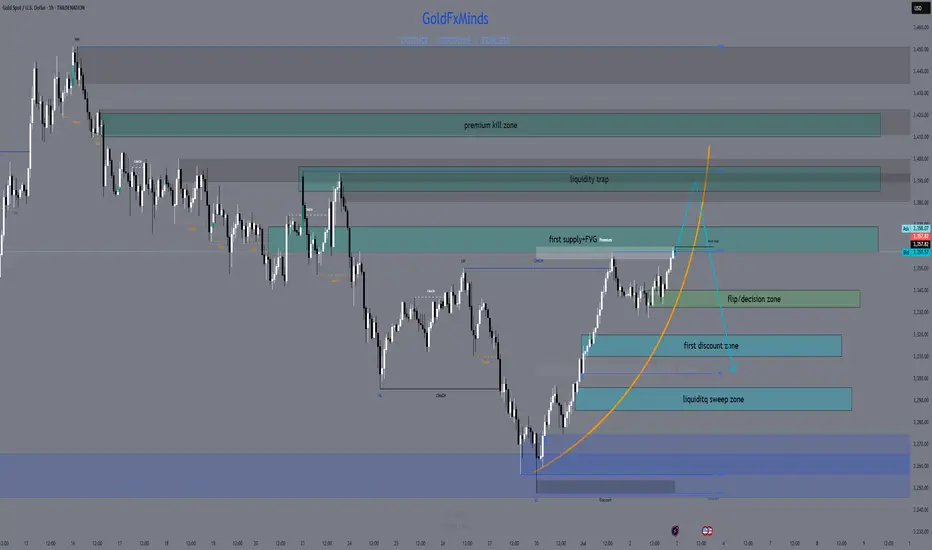
Gold Setup for July 3th: Don’t Get Caught in the Liquidity Net🌙 Good evening, sniper — lock in, load up, and let’s dance with Thursday’s chaos 💣
🌍 Macro & Geopolitical Pulse
Thursday’s setup is not for amateurs:
🔸 Non-Farm Employment Change
🔸 Unemployment Rate
🔸 Initial Jobless Claims
🔸 ISM Services PMI
🔸 Factory Orders
Add to that:
• A Fed still talking tough on rates
• Geopolitical flare-ups in the Black Sea and Middle East
• Gold trading deep into premium…
💡 This is where markets hunt weak hands, then flip direction without mercy.
We don’t chase candles. We wait for exhaustion. Then we execute.
🎯 Bias Snapshot (D1 → H4 → H1)
• Daily closed bullish but deep into old CHoCH + OB
• H4 printed HHs, but structure now presses into stacked supply
• H1 shows momentum fading — RSI divergence + weakening push
📌 Core bias: Still bullish — but every pip above 3360 is loaded with risk.
If 3380 fails to break cleanly, expect rejection.
If it breaks — the market likely wants full liquidity above 3400.
🗺️ Battlefield Zones
🟢 Buy Zone #1 – 3310 to 3320
The sniper’s discount pullback: Fibo 38.2%, M30 OB, EMA 50, and clean imbalance.
Wait for news spike + bullish confirmation to go long.
🟢 Buy Zone #2 – 3285 to 3295
The deep reaction zone.
Fibo 61.8% + OB + gap. Enter only on violent wick and rejection — but RR is exceptional.
🟡 Flip Zone – 3334 to 3340
This is where momentum flips:
• Hold above = continuation toward premium
• Break below = bearish reversal unlocked
No entries here — this is your compass, not your trigger.
🔴 Sell Zone #1 – 3357 to 3366
Classic CHoCH retest. H1/H4 OB with layered liquidity.
If price rejects here on post-news spike — short it back toward the flip.
🔴 Sell Zone #2 – 3387 to 3395
Top-of-range sweep.
If gold blows through zone 1, this becomes liquidity trap central.
Wait for rejection wick + bearish PA confirmation.
🔴 Sell Zone #3 – 3410 to 3420
The final premium kill zone.
This is where the market finishes stop-hunting every breakout buyer.
Fibo extension 1.272–1.618 hits here. If we wick this zone and stall — sniper short back to 3380–3366.
⚔️ Execution Blueprint
Wait for news to trigger the chaos — early entries are a donation.
Short 3357–3366 on exhaustion → target flip zone.
If price overextends into 3387–3395, get ready for the reversal play.
Extreme spike to 3410–3420? That’s your killshot short — ride it back down.
If price retraces into 3310–3320, it’s your safe sniper long.
Panic into 3285–3295? Deep long entry, only with confirmation.
Watch the flip zone (3334–3340) — above = bullish bias holds; below = bears back in control.
🎯 No guesswork. No hope. Just precision. Wait, confirm, and strike.
💬 Let’s stay sharp tomorrow — market will offer clean setups, but patience and clarity are key.
If this plan helped, drop a comment or share your thoughts below.
👉 Follow GoldFxMinds for daily sniper-entry plans crafted with precision.
Smash that🚀🚀🚀 if this plan sharpened your edge.
📝 You already know — we don’t guess, we execute. 🦅
Good night, snipers 💛
⚠️ Disclosure
I’m part of TradeNation’s Influencer Program and use their TradingView charts for analysis & educational content.
Gold grows, recovers near 3390
📣Gold News
Gold prices edged higher during the North American trading session as investors turned their attention to the upcoming U.S. non-farm payrolls report (NFP), which could influence the Fed's next policy move.
The latest labor data showed that companies are pausing hiring rather than laying off employees, reflecting caution in an uncertain economic environment. Meanwhile, Microsoft's decision to lay off 9,000 employees has heightened concerns about a weak labor market.
Traders are currently awaiting the official employment report from the U.S. Bureau of Labor Statistics on Thursday, which is expected to show 110,000 new jobs in June, down from 139,000 in May. The unemployment rate is expected to rise slightly to 4.3%, still within the 4.4% range of its forecast according to the Fed's latest summary of economic projections.
📣 Technical Analysis
NF is worth buying before the news release, holding. The dollar continues to be under selling pressure from investors worried about the Trump administration's erratic tariff policy.
💰Set Gold Price:
💰Sell Gold Zone: 3390-3398 SL 3405
TP1: 3380 USD
TP2: 3363 USD
TP3: 3350 USD
💰Buy Gold Zone: 3296-3294 USD SL 3289 USD
TP1: 3308 USD
TP2: 3318 USD
TP3: 3330 USD
⭐️Technical Analysis:
Set reasonable buy orders based on technical indicators EMA 34, EMA89 and support and resistance areas.
Short-term opportunities are imminent.Gold prices have continued to rebound recently and have reached around 3358, but there is a lack of effective retracement during the rise, and the risk of short-term chasing has increased significantly. From a technical perspective, the US dollar index has a demand for a corrective rebound after a rapid decline, and it is expected to form a significant suppression on gold in the short term, limiting the rebound space of gold prices. From a capital perspective, the previous high-level long chips have gradually been untied and started to leave the market with profits, and selling pressure has gradually emerged; short positions may be re-arranged after completing concentrated stop losses, and the market structure is quietly changing.
Based on the above factors, it is recommended that traders remain patient and continue to hold short positions, focusing on the support of the 3335-3325 area. Be sure to control your position during the operation, strictly set stop losses, and avoid the high risks brought by chasing the rise. The core of trading is to follow the trend, respect the market rhythm, and wait for the adjustment to be confirmed before intervening.
Steady trading can only make long-term profits. Welcome everyone to share and communicate to improve the operation level together.
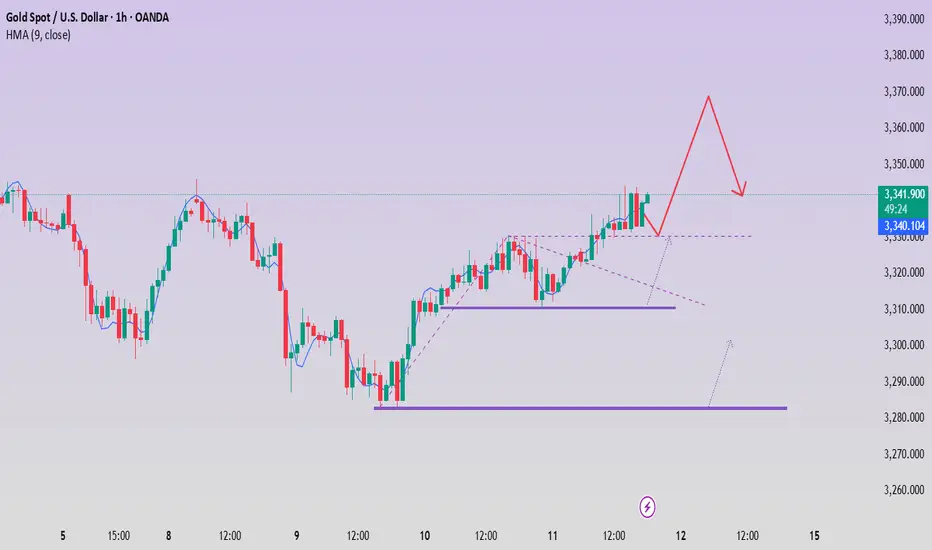
6.30 Four-hour resistance determines the strength of the reboundAt the weekly level, the short-term focus is on the adjustment and continued breaking of the weekly support. As time goes by, the weekly support is at the 3285 watershed. At the daily level, after the price broke the daily support last week, the price continued to rely on the daily resistance to bear pressure. At present, the daily resistance is at the 3355 area resistance. Below this position, gold can continue to be shorted. At the four-hour level, the four-hour key position is the key to our emphasis on short-term trends. At present, the four-hour watershed is in the 3300 area, so the focus is on the gains and losses of this position. Before it breaks up, the short-term focus will be on the pressure first, but once it breaks up, it will need to focus on the rebound to the daily resistance. From the one-hour perspective, the bottom rebounded during the early morning session and broke through the high point of the previous trading day’s early morning retracement, so the short-term is still in adjustment. Temporarily pay attention to the gains and losses of the 3300 position, and treat it as the right-side trading method in terms of operation.
GOLD Price Analysis: Key Insights for Next Week Trading DecisionIn this video, I break down last week’s gold price action and give you a detailed outlook for the week ahead. With gold closing around $3,260 and major macroeconomic shifts unfolding—including the Israel-Iran ceasefire talks, rising US dollar strength, and concerns over the US Q1 GDP contraction, we are at a turning point.
📉 Will weakening economic data force the Fed to pivot?
📈 Could this create a fresh bullish wave for gold?
Or will stronger job numbers and inflation data drag gold lower?
✅ What you’ll learn in this video:
✅Key fundamental drivers affecting gold (XAU/USD)
✅Important economic events to watch (Fed Chair speech, NFP, ISM)
✅My technical analysis of gold price levels to watch
✅How to read the current market sentiment like a pro
✅Strategic trading zones for bulls and bears
🔔 Don’t forget to like the video in support of this work.
Disclaimer:
Based on experience and what I see on the charts, this is my take. It’s not financial advice—always do your research and consult a licensed advisor before trading.
#xauusd, #goldprice, #goldanalysis, #goldforecast, #goldtrading, #xauusdanalysis, #technicalanalysis, #fundamentalanalysis, #forextrading, #forexmentor, #nfpweek, #goldoutlook, #tradingstrategy, #chartanalysis, #julyforecast, #fedwatch, #priceaction, #traderinsights, #commoditytrading, #marketbreakdown, #xauusdforecast, #tradethefundamentals, #smartmoneytrading

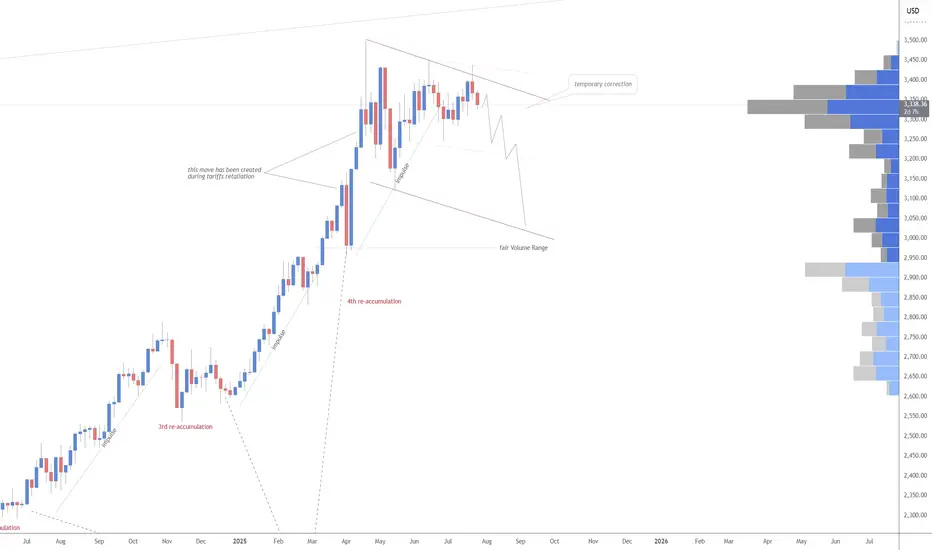
Next week's market trend analysisShort-term technical analysis of gold next week:
After gold was horizontally consolidated below 3400, it had two relatively large retracements. The short-term downward channel, the upper edge of the channel is currently around 3340, which is also the turning point of the short-term long and short cycles that we need to pay attention to later.
Has the current big rhythm entered a weak position?
Daily level analysis: After reaching 3500, gold is still in a trend of high-level consolidation, and there is a periodic switch between long and short positions, and there is no extremely strong or weak rhythm. In this consolidation process, there are two relatively large retracements: the first from 3500 to 3200 space 300 points, the second from 3435 to 3120 space 315 points. In other words, in the current daily level cycle, the maximum decline is around 300 US dollars. Not exceeding this maximum retracement value, to a certain extent, it is still in the rhythm of high-level correction. According to the range of this space retracement, the limit of the daily retracement is around 3150, with an error of about 20 points. However, the daily range is large, so it is too early to talk about this threshold.
At present, the short-term pressure points of 0.618 and the top and bottom structures are all around 3300. Another point for everyone to pay attention to: in the market with a small cycle of negative decline, once there is a sideways trend. Don't take it as support! The price is consolidating horizontally, which only means that the current bulls are weak in pulling back and the change of weakness must be a strong pullback to break through the big negative. Similarly, the slow rise market is the same.
The first support below in the short term is around 3250. The strong support is at the integer level of 3200. Once this position is reached, it will become a repeated test position like 3400.
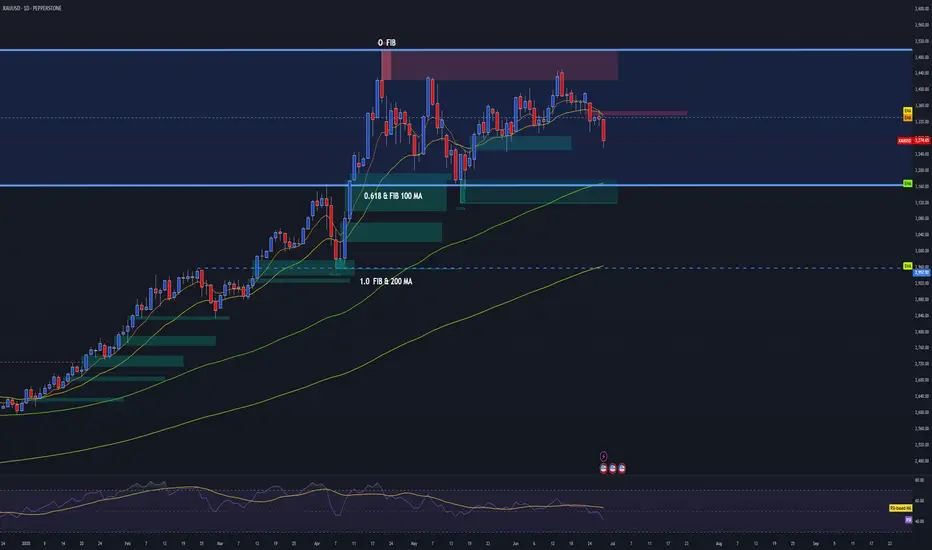
GOLD DAILY OUTLOOK | BEAR MARKET STRUCTURE CONFIRMED 📉 Trend Reversal Underway – Prepare for Lower Levels
The daily structure on Gold (XAUUSD) confirms a shift from accumulation to distribution.
Here's what stands out:
🔻 Key Breakdown Factors:
Failure at O_FIB Rejection Zone
The price failed to sustain above the upper Fib extension and supply zone (marked in red). Multiple attempts at reclaiming this level have resulted in sharp rejections, signaling exhaustion of buyers.
Break of Mid-Range Structure
We've decisively closed below the range midpoint, with strong bearish daily candles. This confirms loss of control by bulls and opens the door for a move toward deeper retracement zones.
Support Zones Exposed
The 0.618 FIB & 100 MA area around ~3160 is now a primary target. This zone held previously, but repeated touches weaken structure.
The 1.0 FIB & 200 MA zone around ~2960 is the macro support target. If sentiment continues to deteriorate, this will be the magnet.
EMA Crosses Rolling Over
Price has decisively lost the 9/21 EMA zone. Until a daily close reclaims this zone (~3335+), bearish momentum remains valid.
📉 Bearish RSI Momentum
While not a primary signal, RSI confirms momentum divergence and bear control below the midline. No sign of reversal.
🎯 Bearish Bias Until Reclaim of 3335 Zone
📌 Next Target = 3160, then 2960
🛑 Invalidation = Daily close above 3340 with strong volume and reclaim structure
This is not a short-term pullback — it's the beginning of a deeper correction. Gold is no longer in the “safe-haven” trade. Be patient, position with structure, and let the trend do the work.
Focus will be on fading the traps on pullbacks into structure.
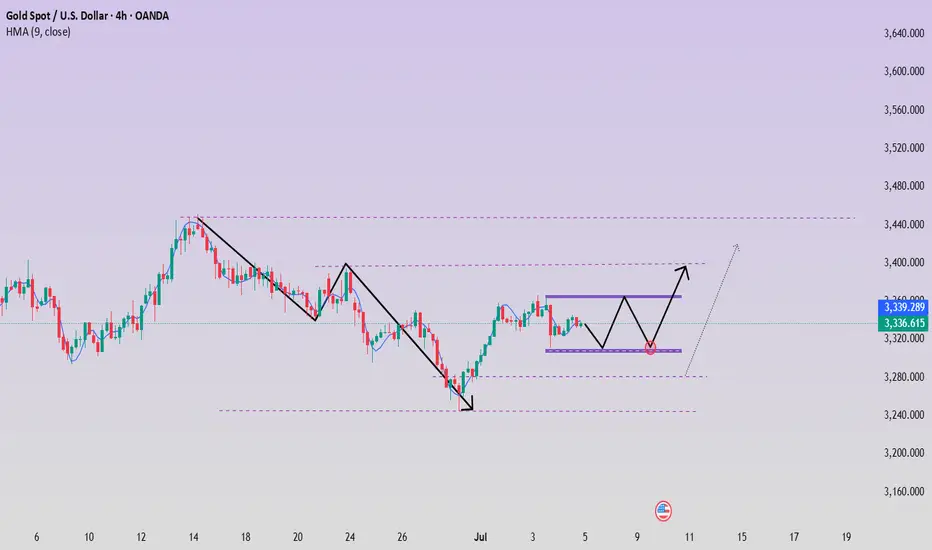
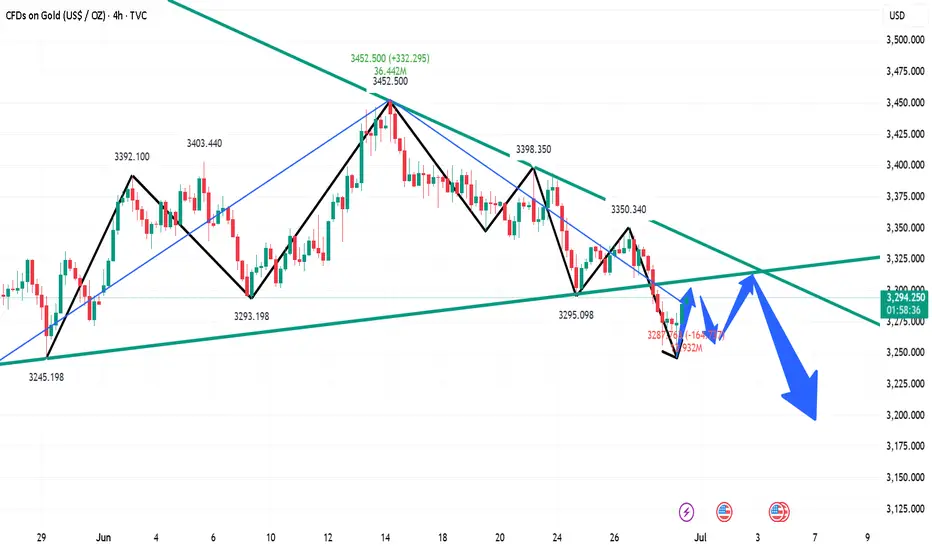
Will the FALL continues?Last trade idea was fulfilled and went into the downside. Targeted 3250. If this 3250 major support area breaks down, we can expect a bigger downside move.
However, there’s a huge buying that happened at that level. It may first have a pullback upwards before it continues its decline. RSI is also at oversold level.
Bullish reversal can be confirmed if 3350 gets broken.
Gold fluctuated and fell, and the rebound was directly short
📣Gold News
Due to the easing of the situation in the Middle East, gold has fallen in the past few days, and the market has been eagerly looking forward to the interest rate cut, because the tariffs in the Trump era may push up inflation, but it has not come yet. "
On Thursday, the U.S. Department of Labor and Commerce issued key economic data, including initial jobless claims and the final value of real GDP in the first quarter. The number of initial jobless claims was 236,000, a decrease of 9,000 from 245,000 in the previous week, better than the market expectation of 245,000. At the same time, as of June 14, the number of continued unemployment claims in the week increased by 37,000 to 1.974 million, a new high since November 2021. Gold stopped below the moving average today. Gold did not continue the small positive line rise, and the decline continued during the U.S. trading period.
Today, focus on the continuation of short positions, comprehensive Labaron believes that gold is bearish today. For today's operation, consider rebound shorting as the main, and low long as the auxiliary.
📣 Pay attention to the resistance of 3330-3345 US dollars above
📣 Pay attention to the support of 3300-3280 US dollars below
💰 Go long near 3295-3285, target 3310-3320
💰 Go short near 3330-3340, target 3000-3290
If you have just entered the market, you are confused about the market of gold, oil and silver, and you always do the opposite operation direction and the entry price is unstable. I hope Labaron's article will help you.
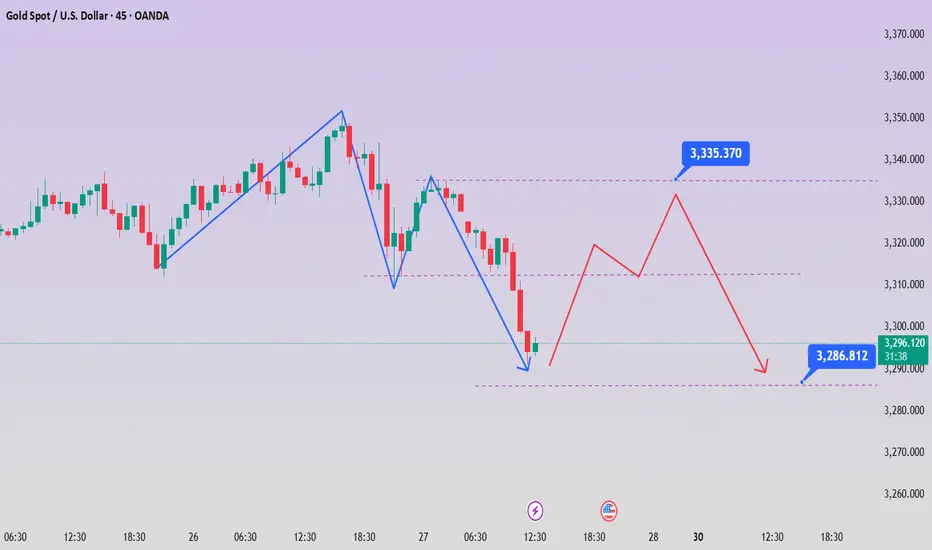
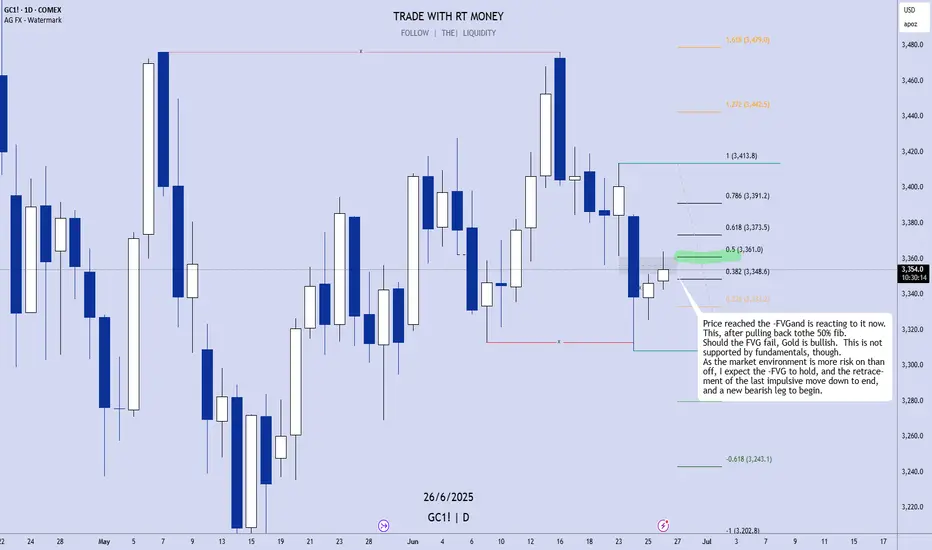
GOLD Can Turn Bearish Now, After Completing a 50% Retracement!GOLD futures analysis for Wed Jun 26th.
Price reached the -FVGand is reacting to it now.
This, after pulling back tothe 50% fib.
Should the FVG fail, Gold is bullish. This is not
supported by fundamentals, though.
As the market environment is more risk on than
off, I expect the -FVG to hold, and the retracement
of the last impulsive move down to end, and a new
bearish leg to begin.
Enjoy!
May profits be upon you.
Leave any questions or comments in the comment section.
I appreciate any feedback from my viewers!
Like and/or subscribe if you want more accurate analysis.
Thank you so much!
Disclaimer:
I do not provide personal investment advice and I am not a qualified licensed investment advisor.
All information found here, including any ideas, opinions, views, predictions, forecasts, commentaries, suggestions, expressed or implied herein, are for informational, entertainment or educational purposes only and should not be construed as personal investment advice. While the information provided is believed to be accurate, it may include errors or inaccuracies.
I will not and cannot be held liable for any actions you take as a result of anything you read here.
Conduct your own due diligence, or consult a licensed financial advisor or broker before making any and all investment decisions. Any investments, trades, speculations, or decisions made on the basis of any information found on this channel, expressed or implied herein, are committed at your own risk, financial or otherwise.
Gold prices rose as dollar data was not good
📌 Gold information:
Gold prices plunged on Tuesday as a ceasefire was declared in the 12-day war between Iran and Israel, market risk appetite rebounded, and demand for safe-haven assets declined. The ceasefire news pushed global stocks higher, while oil prices fell to a two-week low as concerns about supply disruptions eased. The plunge in crude oil prices also further suppressed gold's inflation hedging appeal. As an interest-free asset, gold prices are under pressure against the backdrop of waning risk aversion, but there is still buying support at low levels.
Investors are currently focusing on Federal Reserve Chairman Jerome Powell's appearance at a House Financial Services Committee hearing. Powell has been cautious on whether to cut interest rates in the near future.
📊Comment Analysis
The current market selling sentiment has increased significantly, and for gold, falling seems to be the only way to go. Today, whether you look at rebound short or low long, basically you will not have a chance, that is, falling, it seems that the market has lost hope in gold, and the current gold has fallen to 3295, and the break of 3300 declares that gold has further room to fall. From the trend point of view, it is likely to fall now!
The further strong support on the current trend line is around 3274, and it is not ruled out that it will fall directly to the current position. At present, the Federal Reserve is still speaking, and whether it will cause drastic fluctuations in gold in the future is still unpredictable, but from today's trend, shorting is already the best solution at present, and the upper resistance can first look at 3330!
💰Strategy Package
Gold: Rebound 3325-3335 short, stop loss 3345, target 3290-3300!
⭐️ Note: Labaron hopes that traders can properly manage their funds
- Choose the lot size that matches your funds
Gold-----sell near 3393, target 3380-3366Gold market analysis:
Yesterday, gold was basically a repeated shock, the K line was repaired at one position, and buying and selling were back and forth around the M side of the suppression platform 3405. Yesterday, our analysis was completely in line with our expectations. Yesterday, we also repeatedly arranged 5 sell orders, arranging 3382 break sell, 3387 sell, 3393 sell, 3382 sell, 3377 sell. Today's idea is to continue selling. The daily line cannot determine the bottom of this wave of decline. There are data in European and American time today. I think we can rely on the 3405 platform to be bearish before the data. If 3405 breaks, we adjust our thinking to be bullish. Otherwise, we can sell repeatedly. Gold is oscillating in the short term. Try not to chase it and wait for it to rebound and suppress the position to sell. In addition, the daily moving average suppression position of the moving average is 3396-3363, which is also the main reason for its repeated game at this position. The weekly buying momentum is not dead yet. Be cautious of its rocket in the second half of the week.
In today's Asian session, we will first focus on the suppression of 3395. The risk of taking more is relatively large. The low point below is not stable. The Asian session fell to 3370 and rebounded quickly. From the perspective of the pattern, 3372-3366 is the support. The suppression position of the 1H hourly moving average is near 3395. Yesterday's US session rebounded at around 3396, and the hourly K suppression position was 3400. All the above are suppressed. In addition, the opening position today is also near 3393.
Pressure 3393, 3400, 3405, support 3382, 3370, and the watershed of strength and weakness in the market is 3382.
Fundamental analysis:
In the previous fundamentals, we have been paying attention to geopolitical factors. The situation in the Middle East has indeed changed the way gold and crude oil are traded. Today we focus on the monetary policy of the Federal Reserve, and there is also a speech by Chairman Powell during the US session.
Operation suggestions:
Gold-----sell near 3393, target 3380-3366
Gold may usher in new opportunities
Key fundamental drivers
- Middle East tensions and nuclear negotiations Despite the ongoing tensions, Iran's signal of restarting nuclear talks has reduced risk aversion, triggering an intraday sell-off in gold, and the market has digested the reduced possibility of escalation of the conflict. The turbulent situation in the Middle East remains a trigger for market volatility, and any downgrade/escalation signals may trigger sharp fluctuations in gold prices.
- Fed policy and rate cut bets The Fed kept interest rates unchanged this week, but Powell's "data-dependent" stance has raised market expectations for a September rate cut to 60%. A dovish meeting statement could push gold prices above $3,400, while a delayed rate cut signal could drag gold prices to $3,350.
Short-term outlook
In the short term, gold prices may fluctuate between $3,350 and $3,450, and a breakthrough depends on:
- Upside catalyst: Escalating tensions in the Middle East + weak retail sales data may push gold prices to $3,450.
- Downside risks: Fed hawkish signals + fading geopolitical risks could push prices to $3,300.
Key event risks
- June 19: Fed policy meeting (expected to be dovish)
- June 21: US CPI data (inflation indicator to measure the timing of rate cuts)
- Middle East situation: progress in nuclear negotiations and conflict dynamics
💰Strategy Package
Set gold price:
🔥Sell gold area: 3390-33396 SL 3400
TP1: 3380 US dollars
TP2: 3375 US dollars
🔥Buy gold area: $3374-$3366 SL $3360
TP1: 3390 US dollars
TP2: 3400 US dollars
Gold is under pressure! What is the key to breaking the deadlock
📌 Core driving events
The conflict between Iran and Israel has entered the fifth day. Air raid alerts in Tel Aviv are frequent. The fire on a cruise ship in the Strait of Hormuz has exacerbated the panic of energy transportation. Safe-haven buying supports gold prices;
Trump's contradictory statement of "peace talks + tough" (may send executives to meet but demand "unconditional surrender") has exacerbated the market's disagreement on the direction of the conflict, and risk aversion has fluctuated repeatedly.
The Federal Reserve will announce its interest rate decision today. The market expects it to remain unchanged at 4.25%-4.50%, but Powell's statement on rate cuts will affect the trend of the US dollar (Trump continues to pressure for a 1 percentage point rate cut).
📊Comment Analysis
1-hour chart: 3396 becomes the intraday strength and weakness watershed
The Asian morning session hit a high of 3396 US dollars and fell back. This point is the previous high pressure point. If the intraday rebound does not break through this position, the bearish thinking will be maintained;
💰Strategy Package
Set gold price:
🔥Sell gold area: 3390-33396 SL 3402
TP1: 3380 US dollars
TP2: 3375 US dollars
🔥Buy gold area: $3374-$3368 SL $3362
TP1: 3390 US dollars
TP2: 3400 US dollars
⭐️ Note: Labaron hopes that traders can properly manage their funds
- Choose the number of lots that matches your funds
