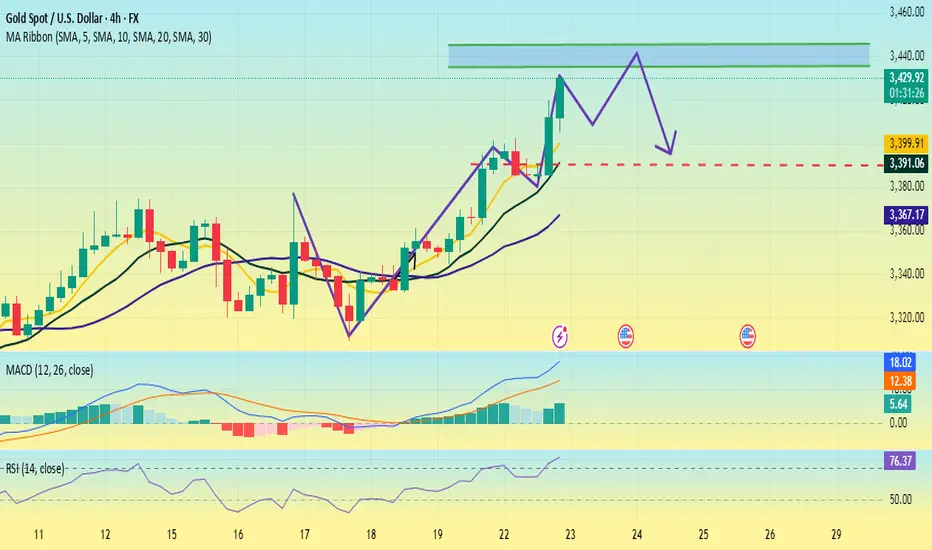
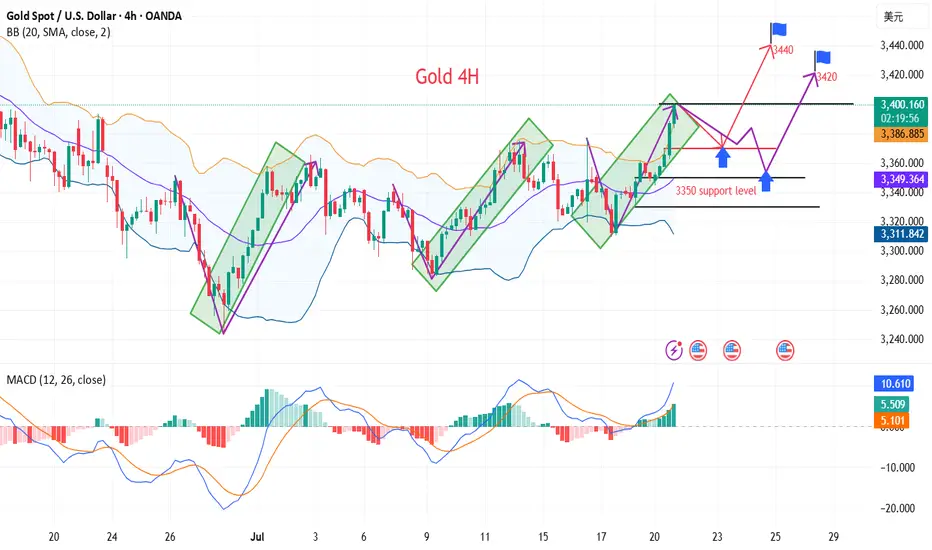
Gold is under pressure. Can it break through?Since the "W bottom" pattern was formed at the low of 3344 US dollars, the gold price broke through the neckline of 3380 and further stabilized at 3400 today, confirming the continuation of the medium-term upward trend. The moving average system is arranged in a bullish pattern, with the 5-day, 10-day and 20-day moving averages diverging upward in turn, and the support strength is stable.
The MACD indicator golden cross continues to expand, the upward momentum is enhanced, and no divergence occurs; the RSI indicator rises to around 76. Although it enters the overbought range, there is no obvious turn, indicating that the bullish momentum is still being released.
The current support level has risen to around 3390, and the support level has risen sharply. The resistance position needs to pay attention to 3430-3440. At present, several times have tested above 3430, but they have not stabilized above this position.
Operation suggestions:
3390-3400 light position to try more, stop loss 3360, profit range 3435-3445.
If it encounters resistance and falls back near 3435, you can consider short-term short orders with stop loss at 3445 and profit range at 3400-3380.
Although the upward momentum continues, some risk information still needs to be paid attention to; this week, we need to pay attention to the US June existing home sales data (July 23), the preliminary value of the second quarter GDP (July 25) and the core PCE price index (July 26). If the data is stronger than expected, it may trigger expectations of interest rate cuts.
Goldprediction
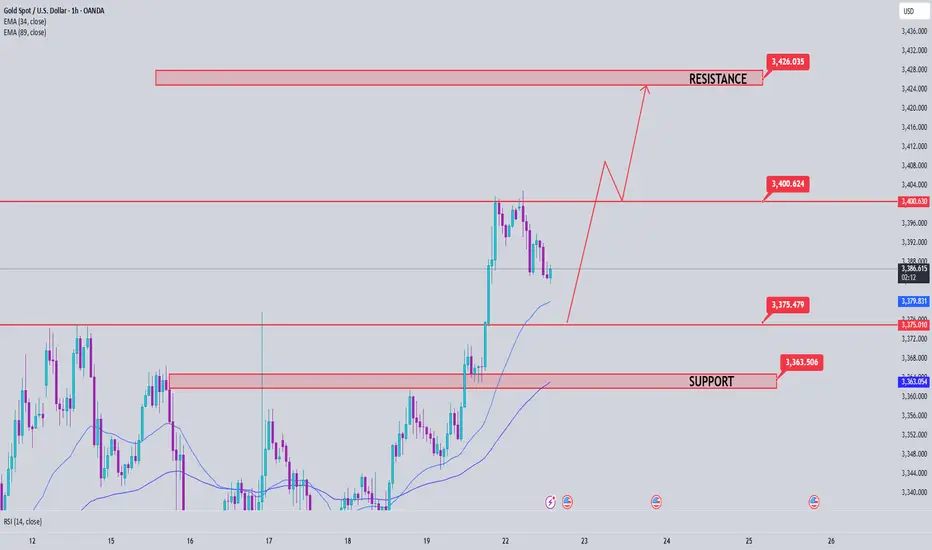
Gold Price Analysis July 22Gold continues to maintain its upward momentum as expected, and yesterday's session reached the target of 3400. This is a signal that the bullish wave structure is still holding. In today's European trading session, the price is likely to make a technical correction to important support zones before continuing the main trend in the US session.
The current trading strategy still prioritizes following the uptrend, focusing on observing price reactions at support zones to find safe entry points. Waiting for buyers to confirm participation is a key factor to avoid FOMO at the wrong time.
🔑 Key Levels
Support: 3375 – 3363
Resistance: 3400 – 3427
✅ Trading Strategy
Buy Trigger #1: Price reacts positively and rejects the support zone at 3375
Buy Trigger #2: Price rebounds strongly from the deeper support zone at 3363
Buy DCA (Moving Average): When price breaks and holds above 3400
🎯 Next Target: 3427
📌 Note: It is necessary to closely monitor price reaction at support zones to determine whether buying power is strong enough. If there is no clear confirmation signal, it is better to stay on the sidelines and observe instead of FOMOing to place orders.
Gold breaks and turns upward! Will it break through 3403? Or wil
Gold fluctuated sideways for another day in this transaction, and only showed signs of further upward attack near the US market. The current gold price is around $3,400/ounce. The gold price is falling from the more than one-month high of $3,403/ounce hit in the early Asian session on Tuesday, and fell to the lowest level of 3,383 before turning around again. So how will the trend be today? Let me explain it to you below!
Why did gold rise across the board this week?
1 On Monday, the uncertainty surrounding the trade agreement between the United States, Japan and the European Union increased, raising concerns about the prospects for US economic growth and suppressing the US dollar. The fate of gold is still closely tied to the trend of the US dollar, which is currently under pressure from US President Trump's tariff negotiations.
2 In addition, Trump has repeatedly called on Federal Reserve Chairman Powell to resign, raising concerns about the independence of the Federal Reserve, causing US bond yields to continue to decline, and also putting pressure on the US dollar. The record rise in Wall Street stock indexes has weakened the safe-haven appeal of the US dollar and the attractiveness of yields, thereby helping gold prices to continue their gains since Friday.
What do you think of the future trend of gold!
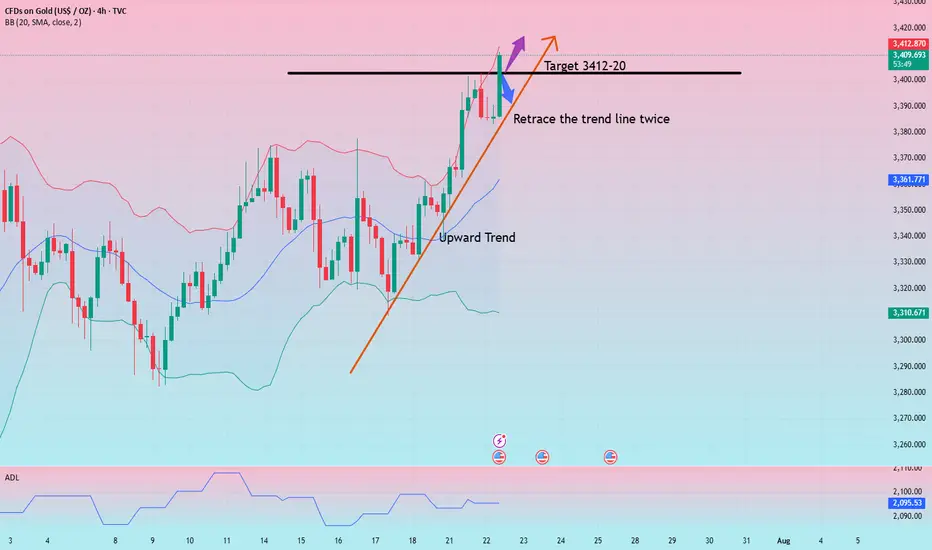
From the current market situation, the trend is still in a very strong market, and the current high point of 3403 is in danger. It can only be said that if it breaks through again today, the upper pressure needs to see the 3420 line. This week's trend has not given any chance to step back. It is either a slow rise or a sudden strength in the sideways market. There is basically no chance to enter the market at a suitable position!
From the current 4-hour trend, there is basically no escape from today's strength, and the current problem is actually whether there is a suitable entry opportunity. Prepare for both hands. One is to look at the previous high of 3403. If it breaks through strongly, go long directly, and look at the 3412-20 line. If it retreats first, then look at the vicinity of 3385 and see the second rise in the US market!
Gold: Long near 3385-87, let go of 75, and the target is 3412-20! If it rises directly and breaks through 3403, you can try to break through long with a light position, and still look at the 3412-20 line above!
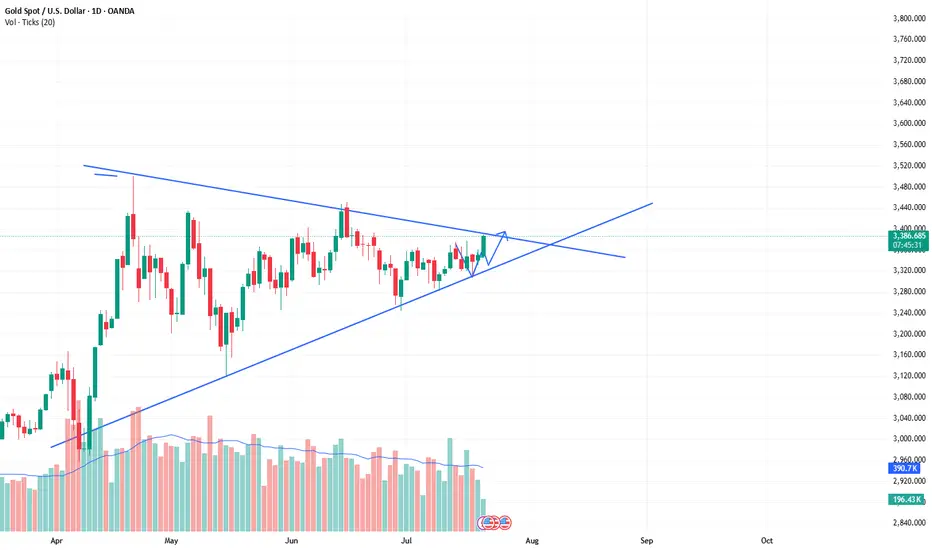
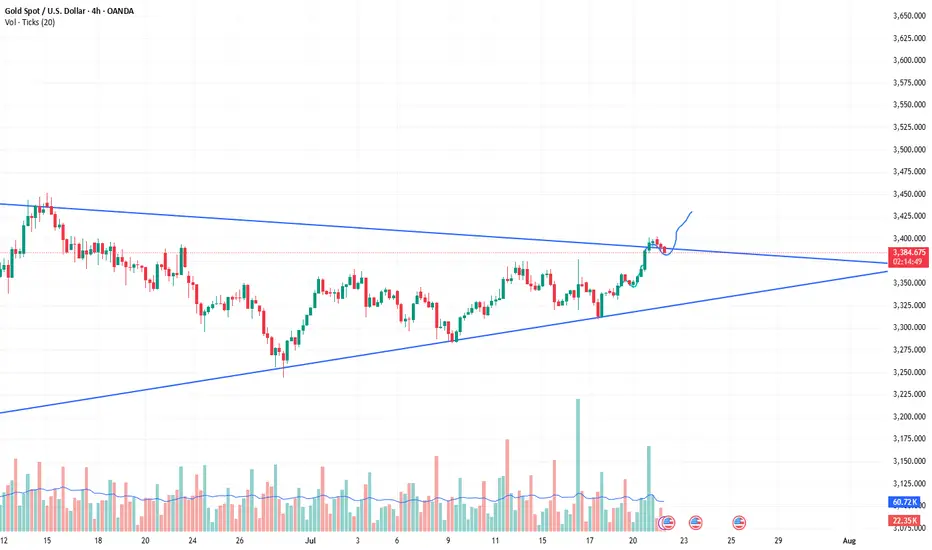
The bull market of xauusd continues, buy and wait for the rise.As predicted in the band trading center in advance over the weekend. The daily level trend is still very stable, and the breakthrough trend has been perfectly carried out. The current quotation is 3388. It is only a matter of time before it rises wildly to the position of 3430. The short-term will definitely break through. The current bull market is clear and has huge potential. The limit of the triangle consolidation phase is about to be broken. Then the bulls will continue to rise. Therefore, buying is the key operation plan.
XAUUSD:Retracement is a buying opportunityAfter the Asian market hit the highest position of 3403, there was some decline. The current gold price is 3386. From the short-term trend of the hourly level. It is still fluctuating at a high level. Combined with the trend of the daily level, there are signs of retracement and counterattack. There is no news dominance. It is purely a technical repair after hitting the high. This retracement can pay attention to the support near 3382-3378. The London and New York markets are still based on buying and profit.
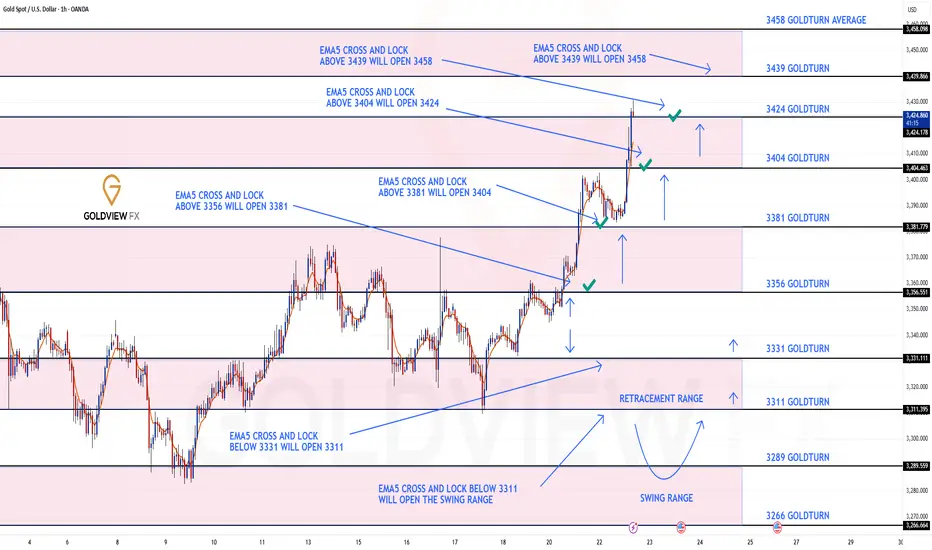
GOLD ROUTE MAP UPDATEHey Everyone,
Another great day on the charts today with our analysis playing out perfectly like we analysed.
As a follow up from yesterday, after completing 3356, we noted that EMA5 cross and lock opening 3404, which was hit perfectly today as analysed. With strong momentum, we also cleared the 3424 Bullish Target.
We will now look for an EMA5 lock above 3424 to open the next bullish level at 3439. Alternatively, a rejection here may see lower Goldtruns tested for support and bounce.
We will keep the above in mind when taking buys from dips. Our updated levels and weighted levels will allow us to track the movement down and then catch bounces up.
We will continue to buy dips using our support levels, taking 20 to 40 pips. As stated before, each of our level structures gives 20 to 40 pip bounces, which is enough for a nice entry and exit. If you backtest the levels we’ve shared every week for the past 24 months, you’ll see how effectively they were used to trade with or against short/mid-term swings and trends.
The swing ranges give bigger bounces than our weighted levels, that’s the difference between the two.
BULLISH TARGET
3356 - DONE
EMA5 CROSS AND LOCK ABOVE 3356 WILL OPEN THE FOLLOWING BULLISH TARGETS
3381 - DONE
EMA5 CROSS AND LOCK ABOVE 3381 WILL OPEN THE FOLLOWING BULLISH TARGET
3404 - DONE
EMA5 CROSS AND LOCK ABOVE 3404 WILL OPEN THE FOLLOWING BULLISH TARGET
3424 - DONE
EMA5 CROSS AND LOCK ABOVE 3424 WILL OPEN THE FOLLOWING BULLISH TARGET
3458
BEARISH TARGETS
3331
EMA5 CROSS AND LOCK BELOW 3331 WILL OPEN THE FOLLOWING BEARISH TARGET
3311
EMA5 CROSS AND LOCK BELOW 3311 WILL OPEN THE SWING RANGE
3289
3266
As always, we will keep you all updated with regular updates throughout the week and how we manage the active ideas and setups. Thank you all for your likes, comments and follows, we really appreciate it!
Mr Gold
GoldViewFX
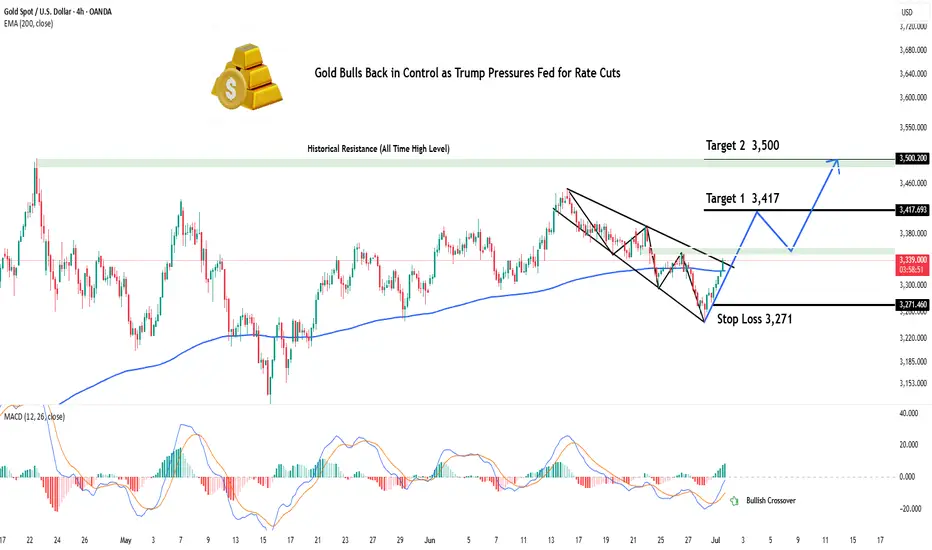
Gold Bulls Back in Control as Trump Pressures Fed for Rate CutsHey Realistic Traders!
President Trump is ramping up pressure on the Fed to cut interest rates , saying the U.S. is falling behind countries with looser policies. As several Fed officials begin to shift their stance, expectations for rate cuts are growing. That’s putting pressure on the dollar and giving gold a fresh boost.
We’ll take a closer look at what this means for OANDA:XAUUSD (Gold) through technical analysis and explore its upside potential.
Technical Analysis
On the 4-hour chart, Gold has moved above the EMA-200, signaling a shift in momentum to the upside. Price has also broken out of a Descending Broadening Wedge (DBW) pattern, which often indicates the start of a bullish trend.
The breakout was confirmed by a Bullish Marubozu candle, reflecting strong buying pressure. To add further confirmation, the MACD has formed a bullish crossover, reinforcing the upward momentum.
Looking ahead, the first target is seen at 3417. If reached, a minor pullback toward the historical resistance zone (green area) may occur, with a potential continuation toward the second target at 3500.
This bullish outlook remains valid as long as the price stays above the stop-loss level at 3271 . A break below this level would invalidate the setup and shift the outlook back to neutral.
Support the channel by engaging with the content, using the rocket button, and sharing your opinions in the comments below.
Disclaimer: "Please note that this analysis is solely for educational purposes and should not be considered a recommendation to take a long or short position on XAUUSD.
Don't chase the bullish trend,wait for the short position layout#XAUUSD
The tariff policy recently announced by the US government is undoubtedly the focus of the current gold market. Trump also tied the tariffs to the trial of former Brazilian President Jair Bolsonaro, adding to policy uncertainty. ⚖️
The implementation of the tariff policy may push up commodity prices, thereby exacerbating inflationary pressure, which is both an opportunity and a challenge for gold📊. On the one hand, rising inflation expectations may enhance the attractiveness of gold as an anti-inflation asset; on the other hand, the strengthening of the US dollar and US Treasury yields may offset this positive. 💡
At present, the lower support has moved up to the 3375-3365 area, where a top-bottom conversion position will be formed. The upper short-term resistance level is 3387-3393, the previous high. If the market touches this for the first time, you can try to see a double top fall.
🚀SELL 3385-3390
🚀TP 3365-3355
Gold 3400, gold price returns strongly
💡Message Strategy
The Fed's monetary policy divergence has intensified. Fed Board member Waller advocates a 25 basis point rate cut in July, believing that tariff inflation is temporary; Board member Kugler insists on maintaining high interest rates to fight inflation; Chicago Fed member Goolsbee believes that the latest consumer price index data shows that tariffs have pushed up commodity inflation, and is "slightly concerned" about this, but then expounds on a different view, that is, interest rates are expected to fall sharply in the coming year. It implies that there may be a "substantial rate cut" in the next 12 months.
At present, the Fed has gradually begun to prepare for a rate cut. Whether this is the result of pressure from Trump or the Fed has gradually shown optimism about inflation and concerns about recession, a rate cut is imminent. At present, the market expects the probability of a rate cut in July to rise to 30%, and the probability of a rate cut in September to 54%.
In terms of tariffs, the countdown to August 1 tariffs: the United States plans to impose a 30% tariff on the EU/Mexico, and the EU has drawn up a retaliation list of $84.1 billion. The US Secretary of Commerce expressed confidence that an agreement can be reached with the EU, and small countries need to pay a 10% base tariff. Tariffs will be levied on August 1.
At present, Trump has a tough stance, requiring the minimum tariff of the European and American agreement to be set at 15%-20%, and the scope of exemptions is narrowed (only aviation, medical equipment, etc.). The deadline is approaching, and the market has also begun to start a risk-averse expectation mode.
📊Technical aspects
From the 1H cycle trend structure, gold is currently rebounding upward and breaking through the 4H level downward trend line. From the indicator point of view, the 1-hour level Ichimoku Kinko Hyo indicator breaking through the baseline on the turning line, the delay line stands firmly above the K line, the future cloud is an upward cloud, and the bullish signal is significant.
Gold is currently in the center of the rising channel cloud. Today, we can focus on the support brought by the lower boundary of the channel and try to go long.
Gold rose as expected, and the bulls began to remain strong. Once gold breaks through the upper pressure, it will continue to gain momentum, and gold bulls are expected to reach a higher level.
💰Strategy Package
Long Position:3370-3380,SL:3350,Target: 3420,3400
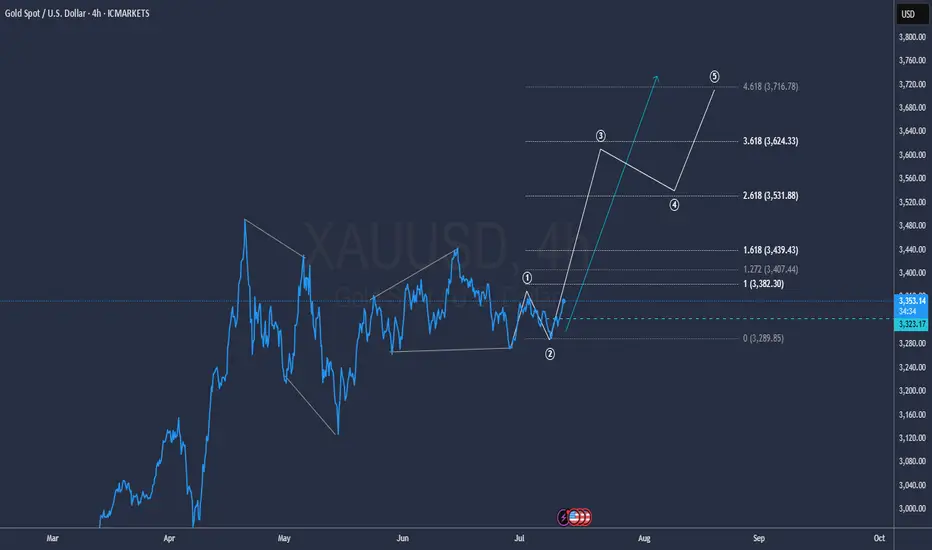
GOLD to the MoonHiper Clear Structure and the beginning of a new impulse towards 3.600 and 3.700
Hope everybody had a chance to got in
gg
3400 is no longer the target for gold. The answer is: higher
After gold touched 3,400, most people expected gold to fall back. This kind of rigid thinking is often out of touch with reality. During the rise, do you think it is better to short at highs or to go long on pullbacks?
💡Message Strategy
This round of gold's upward movement is not accidental. Behind it are significant changes in macro fundamentals. First, the overall weakening of the US dollar. The recent decline of the US dollar index to below the 98 mark reflects the market's concerns about the outlook for the Fed's policy. At the same time, the 10-year US Treasury yield also fell below 2%, and the actual yield fell, strengthening the relative attractiveness of gold.
More worthy of vigilance are the political rumors surrounding the re-election of Fed Chairman Powell. According to the Wall Street Journal, US Treasury Secretary Bessent once advised the president to avoid removing Powell from office to maintain the reputation of the Fed. However, speculation about Powell's possible dismissal remains, although Trump himself publicly denied the relevant plan.
In addition, Europe's actions have also disturbed the market. According to Bloomberg, citing EU diplomatic sources, if no agreement is reached before August 1, the EU will impose retaliatory tariffs on US products worth US$72 billion, covering areas such as automobiles, aircraft, alcohol and digital services. These messages have formed a risk resonance environment of "political uncertainty + economic friction", providing a natural long hotbed for gold.
Although the US economic data is slightly mixed - consumer confidence has rebounded, but inflationary pressure continues, with CPI approaching 3% in June - this has made the market full of doubts about the Fed's monetary policy path. Especially in the case of sparse economic data this week (only new housing data, initial claims and durable goods orders), the market focus is on the impact of political and policy conflicts on market confidence.
📊Technical aspects
From the daily candlestick chart, gold has recently shown signs of breaking upward after five weeks of sideways fluctuations. In terms of MACD indicators, the MACD histogram has turned from green to red, and the fast and slow lines have formed a "golden cross", strengthening the expectation of a short-term technical rebound.
For gold's lower support, pay attention to last week's high of $3,380, which is also the current 4-hour MA10 moving average position. Secondly, pay attention to the multiple declines in gold prices in the European session on Monday to test the stabilization position of $3,370. For gold's upper pressure, pay attention to the intraday high of $3,402, which is also the high point of gold's rise on Monday. After the decline in June, gold prices rebounded several times to test resistance here and further strengthened. The upper space can pay attention to the high point of the past three months at $3,440.
The previous five weeks of consolidation showed that the market was waiting for directional signals, and this breakthrough of the 3,400 mark was achieved against the dual backdrop of a falling US dollar and rising political uncertainty in the United States, with the typical characteristics of "news trigger + technical confirmation".
If gold successfully stabilizes above 3400, the market will turn its attention to the two key resistance areas of 3451 and 3499, the year's high. Breaking through the former will open up space to test new historical highs upwards; combined with the current MACD golden cross pattern, if the capital side and fundamentals continue to cooperate, short-term accelerated rise cannot be ruled out.
💰Strategy Package
Long Position:3370-3380,SL:3350,Target: 3420,3440
Gold prices soared! Gold hit a five-week high!Market news:
On Tuesday (July 22) in the early Asian session, spot gold rose and fell, and is currently trading around $3,390/ounce. Driven by the weakening of the US dollar, the decline in US bond yields and the increasing uncertainty in trade policies, the gold market broke out again, breaking through the $3,400/ounce mark, hitting a five-week high. As the deadline for the United States to impose new tariffs on global trading partners on August 1 approaches, market uncertainty provides strong support for international gold.In addition to the trade situation, the Federal Reserve's monetary policy trends have also added momentum to the rise in gold prices. The market expects that the probability of the Federal Reserve cutting interest rates in September has risen to 59%. The Federal Reserve's July meeting is expected to keep interest rates unchanged, but the market's expectations for an October rate cut have been fully digested. These policy uncertainties have further enhanced the attractiveness of gold as a safe-haven asset.This week, the London gold price ushered in a "critical node" market. Trade policy, US dollar fluctuations, central bank trends and safe-haven fund flows will become the core driving force of the long-short game in the gold market. On this trading day, Federal Reserve Chairman Powell delivered a welcome speech at a regulatory meeting. Pay attention to whether Powell involves remarks related to monetary policy. In addition, continue to pay attention to news related to the international trade situation and geopolitical situation.
Technical Review:
The gold daily chart is strong and oscillating upward. The MA10/7-day moving average maintains a golden cross and opens upward. The hourly chart and the four-hour chart Bollinger band open upward, the moving average system maintains an upward opening, and the price fluctuates upward along the MA10-day moving average. Yesterday, the Asian session fell slightly to 3346 and stabilized. The bottoming out and pulling up again broke through and stood on the hourly line middle track, which means short-term stabilization!
So yesterday's Asian session rose, the European session continued to break high, and the US session still had a second pull-up; but because it is in a period of oscillation, wait patiently for a wave of stabilization before taking action. The reference point selected should pay attention to the 382 split support, that is, 3370, which happens to be the top and bottom conversion support point, followed by the 3356-3358 split support and the middle track.
Today's analysis:
Gold rose strongly yesterday, breaking the highest level in the past month. After the price of gold rose yesterday, it did not rise and fall like before. Instead, it broke through multiple resistances and came to the 3400 mark. From the one-hour market, the direction of the market is very clear, but it is still not recommended to buy directly. Waiting for a fall before getting on the train is the safest strategy!The Asian session gold price was blocked near 3400, and the one-hour market showed a small double top structure, which means that the market will still adjust in a short time. Therefore, do not buy in the Asian session, wait for the adjustment to continue to buy, and the support below is the top and bottom conversion position of 3370. After the Asian session gold price adjusted to 3370 and walked out of the bottom structure, continue to buy. The general direction of this round is to look at the 3450 line!
Operation ideas:
Buy short-term gold at 3375-3378, stop loss at 3366, target at 3400-3420;
Sell short-term gold at 3425-3428, stop loss at 3436, target at 3390-3370;
Key points:
First support level: 3383, second support level: 3370, third support level: 3358
First resistance level: 3403, second resistance level: 3416, third resistance level: 3428

Gold----Buy near 3374, target 3399-3420Gold market analysis:
Yesterday, Monday, gold rose strongly, reaching a high of around 3402. This range is still relatively rare at the beginning of the week. Let's not worry about whether it is caused by fundamentals. Judging from the market's morphological indicators, we can be very sure that it is a buying trend. Yesterday's buying has broken the 3377 position. The breaking position of this position has determined the new buying position. In addition, the daily moving average has also begun to diverge. The morphological support is around 3370 and 3374. Today, relying on this position, the moving average is bullish. Yesterday, it rose too much. I estimate that there will be a need for repair today. The retracement during the repair is our opportunity to get on the train again. On the weekly line, 3400 is a hurdle. The previous multiple stops were only short-lived, so we need to be cautious when buying above 3400.
There is a signal of closing negative in 4H. The Asian session needs to be adjusted and repaired. It is better to buy at a low price. 3402 is a small pressure. We cannot estimate where it will be repaired. We can determine the support below and buy near the support. There can also be short-term selling opportunities above 3400 in the Asian session. It is only in the Asian session, and the buy order is the main target.
Fundamental analysis:
There is no major news in the recent fundamentals. The situation in the Middle East is still relatively stable. There is no new rest in tariffs, and the impact on the market is limited.
Operation suggestion:
Gold----Buy near 3374, target 3399-3420

GOLD - Cut n Reverse Area? What's next??#GOLD... Perfect holdings upside as we discussed in our video and last idea.
Now 3390-91 is major key level because only above that you can see again bounce otherwise not.
NOTE: we will cut n reverse above 3390-91 on confirmation.
Good luck
Trade wisely
GOLD - at cit n reverse area? What's next??#GOLD... market perfectly moved as per our video analysis and now market just reached at his current ultimate swing area
That is around 3402
So if market holds 3402 in that case selling expected otherwise not.
NOTE: we will go for cut n reverse above 3402 on confirmation.
Good luck
Trade wisely
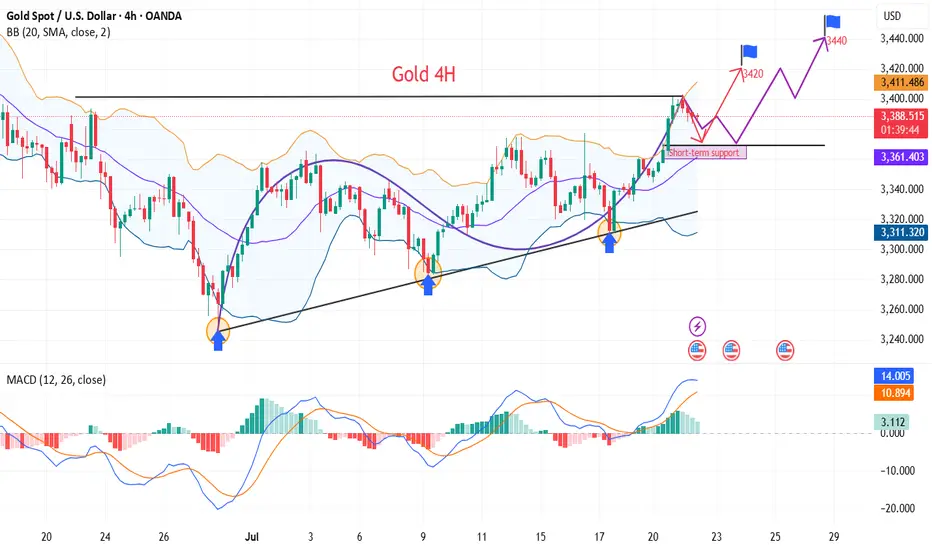
Gold is under pressure. There is hope for another rise.Today's important news:
At 8:30, Fed Chairman Powell delivered a welcome speech at a regulatory meeting; at 13:00, Fed Governor Bowman hosted a fireside chat session at the large bank capital framework meeting hosted by the Fed.
Market conditions:
The current daily trend is mainly "strong rise" (Monday closed positive and broke through the shock, and the moving average turned upward). The core logic is that short-term bullish momentum is dominant, and it is necessary to focus on the effectiveness of support and the rhythm of breaking through resistance.
Today, we need to focus on the support belt 3365-3360 area (this position is the 5-day moving average position and the low point of yesterday's European session). As a short-term moving average support, this area is the first line of defense for bulls today. If it can stabilize here, it can be regarded as a signal of short-term strong continuation.
The key pressure level is still around 3420. As a trend line resistance that has been under pressure many times in the early stage, if it can break through, it means that the bulls will break the shock suppression and open up more room for growth.
In terms of operation, it is still mainly low-long. The current gold is still strong. Operation strategy:
Short around 3420, stop loss 3430, profit range 3400-3380
Long around 3360, stop loss 3350, profit range 3380-3400

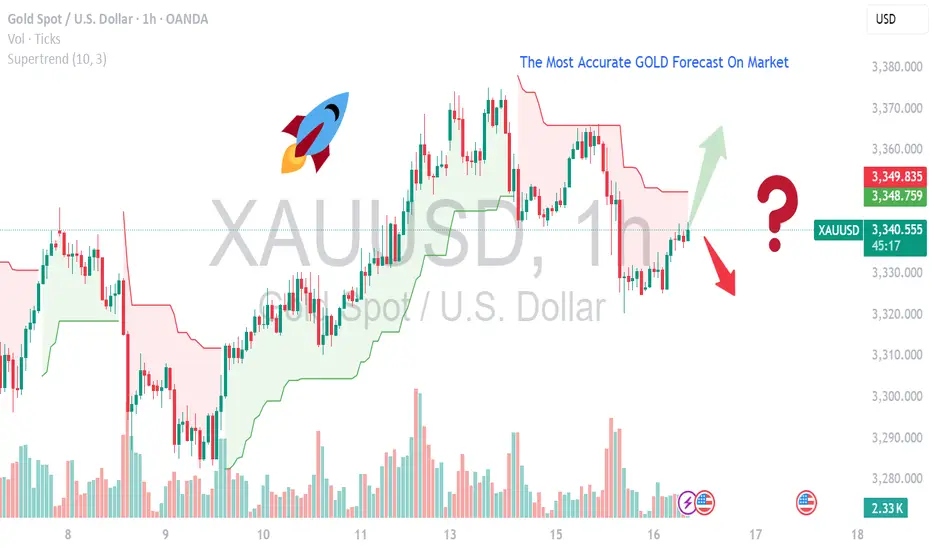
MOST ACCURATE XAUUSD GOLD FORECAST ANALYSIS MARKETCurrent Setup & Technical Outlook
Consolidation & Pennant Formation: Gold is building a bullish pennant and trading above its 50‑day MA — a classic continuation pattern suggesting a breakout toward new highs if momentum resumes .
Key Levels:
Support: $3,330–3,340 — confirmed by multiple technical sources .
Resistance/Breakout Zone: $3,360–3,375 — clearing this could trigger a rally toward $3,400+ .
Upside Targets: $3,390, then possibly $3,500–$3,535 per weekly forecast .
Alternate Bearish Scenario: A failure around the 0.618 Fibonacci resistance (~$3,374) and overbought RSI could spark a pullback to $3,356 or lower .
---
🧠 Fundamental Drivers
Inflation & U.S. Macro Data: Market awaits June CPI/PPI and Fed commentary — cooler inflation could boost gold via dovish expectations, while hotter data may strengthen the USD and weigh on bullion .
Geopolitical & Safe-Haven Demand: Trade tensions (e.g., tariffs) are keeping gold elevated near $3,350–$3,360 .
Central Bank & Real Yields Watch: Continued gold purchases and lower real rates are supportive, although mid-term easing in risks (like global trade) could curb momentum .
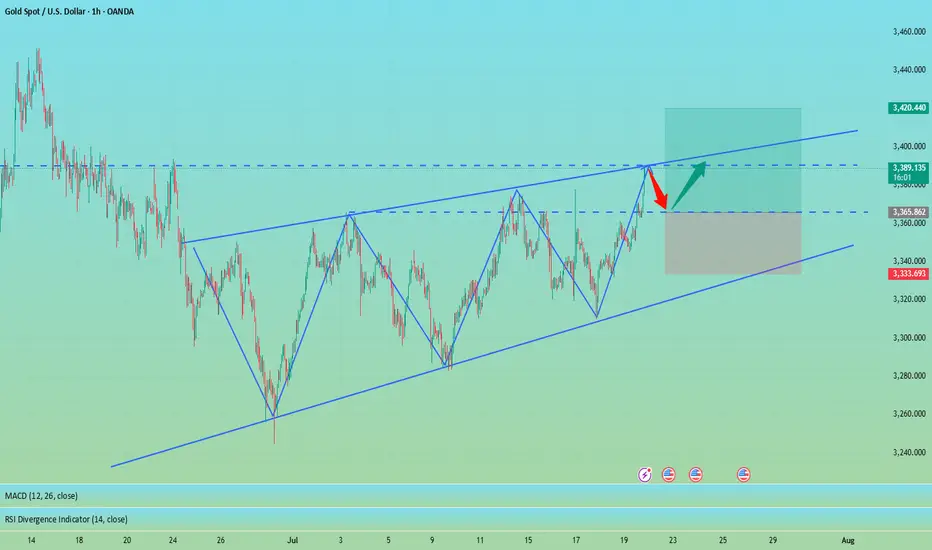
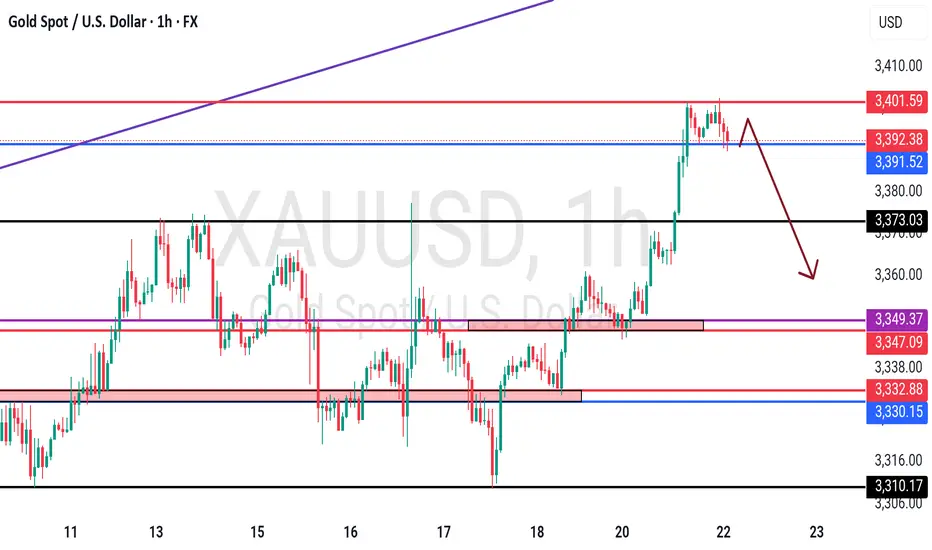
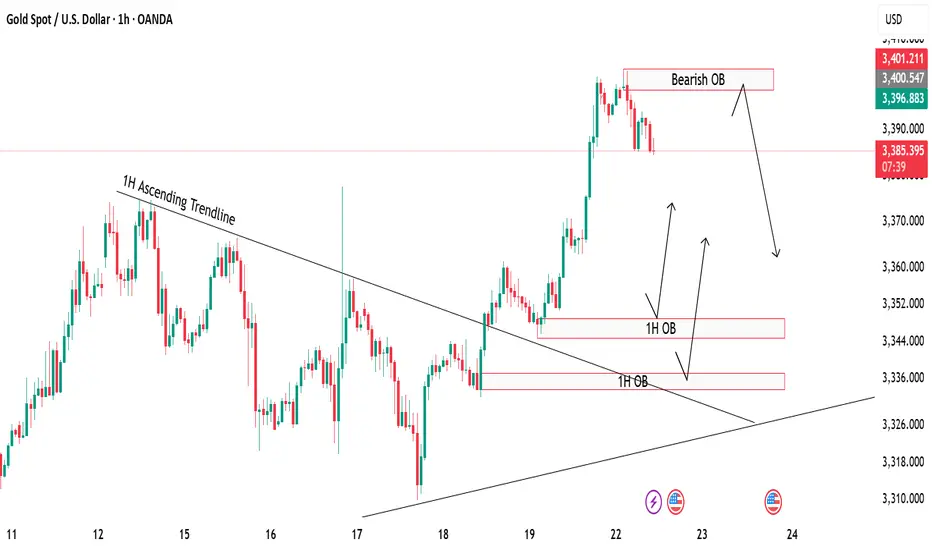
Gold Rejection & Retest Zones AnalysisGold has recently broken out of the 1H ascending trendline with a strong bullish push 🚀. After this breakout, we are now watching key supply and demand zones for the next move.
🔴 Bearish OB (3398-3404):
Price is currently hovering around the bearish order block, which could trigger some short-term rejection or pullback from this zone.
🟢 Bullish OB Zones (3350 & 3330):
If gold decides to correct lower, we have two important bullish OBs below, perfectly lining up with the previous trendline retest ✅. These zones can offer high-probability buy setups if price respects them.
🎯 Focus is on watching for possible rejections from the top OB, or waiting for a deeper retracement towards the bullish zones for buy confirmations
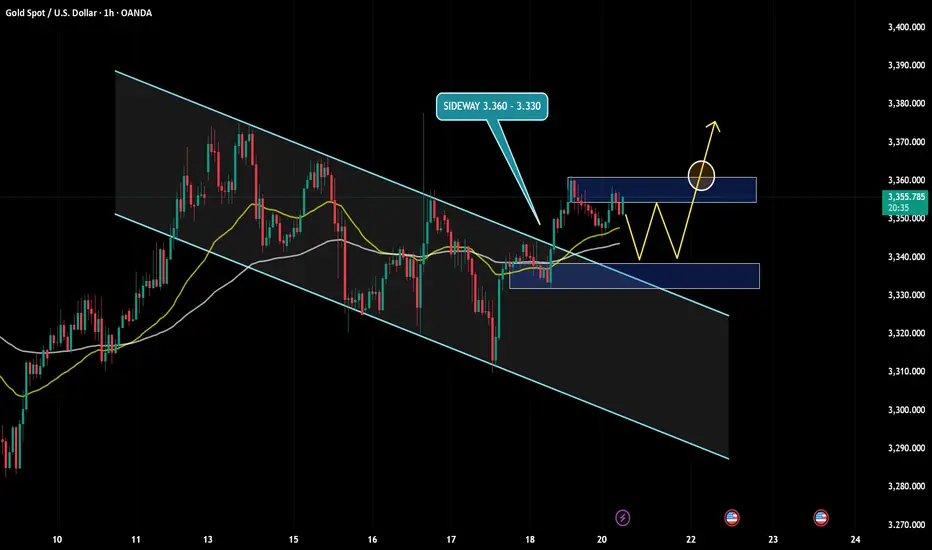
Gold holds steady near resistance – Is a breakout coming?Hello everyone, let’s explore today’s gold market together!
Overall, during the Asian session on Monday, gold traded cautiously, consolidating just below the nearest resistance level at $3,360, with minimal price movement. The uptrend remains strong, primarily driven by a sharp momentum shift last Friday following key news, as the weakening USD reignited investor interest in gold.
Current market sentiment suggests that major institutional funds and retail traders alike are showing renewed attention. As long as the previous support level around $3,330 holds firm, the next move could be a break above the $3,360 resistance, which would likely open the door for further upside expansion.
However, if price breaks below that support zone, I would consider the bullish setup invalid and shift to a wait-and-see approach until clearer signals emerge.
Feel free to share your thoughts in the comments — your perspective could contribute tremendous value to the global TradingView community!
Gold (XAU/USD) Bullish Outlook Based on Price ActionGold (XAU/USD)**, showing a bullish outlook based on price action and support zones.
**Chart Analysis:**
* **Current Price:** \$3,359
* **EMA Signals:**
* EMA 7: \$3,353
* EMA 21: \$3,345
* EMA 50: \$3,341
**Bullish EMA alignment** (short EMAs above long) signals upward momentum.
* **Support Zones:**
* **S1**: \~\$3,345 (strong short-term demand area)
* **S2**: \~\$3,325 (deeper support zone)
* **Volume:** Spikes in green bars signal strong buyer interest near support, especially during the bounce.
* **Projected Move (Green Arrow):**
* A potential retest of the breakout zone (\~\$3,350) could happen before gold targets the **next key resistance** near **\$3,410**.
**Summary:**
Gold broke above a consolidation range supported by EMA alignment and strong volume. As long as the price stays above S1 (\$3,345), the trend remains bullish with upside potential toward \$3,400–\$3,410. A pullback may occur first, offering re-entry opportunities.

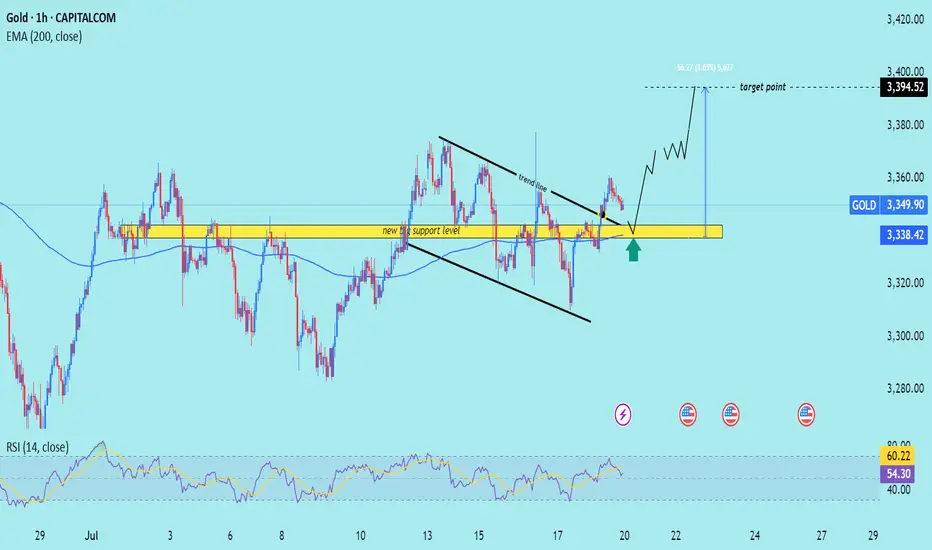
XAU/USD) Bullish trend analysis Read The captionSMC Trading point update
Technical analysis of XAU/USD (Gold) on the 1-hour timeframe. Here’s a breakdown
---
Technical Analysis Summary
Descending Channel Breakout
Price action previously formed a descending wedge/channel, shown by the two black trendlines.
A bullish breakout occurred above the trendline, signaling a shift in momentum from bearish to bullish.
Key Support Zone
The yellow highlighted zone (around $3,338–$3,340) is marked as the “new key support level”.
Price is expected to retest this area (confluence with 200 EMA), which aligns with standard bullish breakout behavior.
The green arrow indicates potential bounce confirmation.
Bullish Projection
After the retest, price is projected to climb steadily toward the target point at $3,394.52.
The setup anticipates around 56.27 points upside, or roughly +1.69% gain from the support zone.
---
Target
$3,394.52 – defined using the previous range breakout height and horizontal resistance.
---
Trade Idea
Entry: On bullish confirmation near $3,338 support zone.
Stop Loss: Just below the yellow zone (e.g., under $3,330).
Take Profit: Near $3,394.
Mr SMC Trading point
---
Conclusion
This is a classic breakout-retest-play, supported by trendline structure, a key horizontal support zone, and RSI strength. As long as price respects the highlighted support, the bullish outlook remains valid.
Please support boost 🚀 this analysis)
Accurate prediction, continue to buy after retracement to 3353📰 News information:
1. The Trump administration puts pressure on the Federal Reserve to cut interest rates
2. The continued impact of tariffs and the responses of various countries
📈 Technical Analysis:
Gold is currently rising rapidly, reaching a high near 3368, and the overall bullish trend has not changed yet. It is not recommended to continue chasing the highs at present. Those who are long at 3345 can consider exiting the market with profits. The technical indicators are close to the overbought area and there is a certain risk of a correction. Be patient and wait for the pullback to provide an opportunity. At the same time, 3353 has become the position with relatively large trading volume at present, and the top and bottom conversion in the short term provides certain support for gold longs. If it retreats to 3355-3345, you can consider going long again, with the target at 3375-3385. If it falls below 3345, look to 3333, a second trading opportunity within the day. If it falls below again, it means that the market has changed, and you can no longer easily chase long positions.
🎯 Trading Points:
BUY 3355-3345
TP 3375-3385
In addition to investment, life also includes poetry, distant places, and Allen. Facing the market is actually facing yourself, correcting your shortcomings, facing your mistakes, and exercising strict self-discipline. I share free trading strategies and analysis ideas every day for reference by brothers. I hope my analysis can help you.
FXOPEN:XAUUSD OANDA:XAUUSD FX:XAUUSD FOREXCOM:XAUUSD PEPPERSTONE:XAUUSD TVC:GOLD

NordKern - XAUUSD InsightNordKern | Simplified Insight OANDA:XAUUSD possible scenarios
Gold saw some upside today, primarily driven by softer TVC:DXY and trade deadlines ahead. To be specific:
1. Softer U.S. Dollar (DXY)
The U.S. Dollar Index fell ~0.1–0.2% today, making gold more attractive for international buyers
Kitco confirms the decline in USDX, paired with weaker Treasury yields, is fueling bullion demand.
2. Cautious Market Ahead of Trade Deadlines
Markets are bracing for the August 1 U.S. tariff deadline, especially involving the EU. Investors are positioning defensively, increasing safe-haven interest in gold.
Heightened trade tensions and uncertainty including possible Trump-Xi talks boost demand for safe assets.
3. Falling Treasury Yields & Fed Policy Expectations
The U.S. 10‑year Treasury yield has slipped (~4.37%), reducing gold’s opportunity cost and supporting its attractiveness.
Market pricing shows increasing odds of a Fed rate cut at next week’s FOMC meeting, something analysts like Christopher Waller suggested.
4. Geopolitical & Trade Risk Premiums
Escalating trade risk (tariffs looming) and geopolitical uncertainty are prompting safe-haven inflows into gold.
India’s MCX mirror those sentiments: gold rose ~0.5% on local contracts amid global trade nerviness.
To sum it up:
Gold is rallying today primarily because of the softer dollar, lower yields, and elevated trade risks ahead of the August 1 tariff deadline all of which reinforce its safe-haven allure.
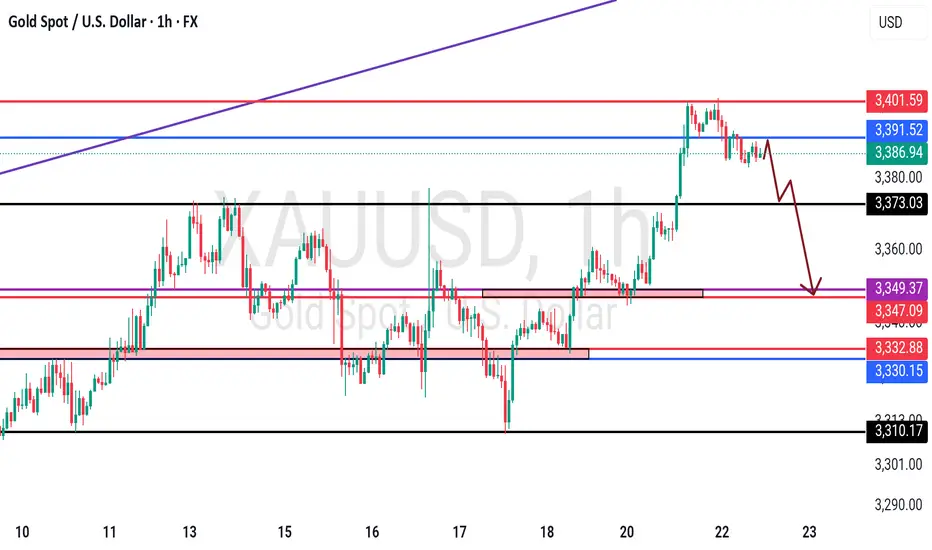
Trade Setup - Shorts; if we retest 3370s
- We would primarily look to enter into lower risk buys on gold at more preferable levels such as 3370. After breaking to the upside from the consolidation area, a pullback and a retest to that area would not be out of the ordinary.
Trade Setup - Buys; if we break above 3400
- In case of the dollar remaining soft, we can expect gold to continue its upside rally without any major pullbacks. In this case, we would be looking for the breaks of 3400 and continue to hold until around 3345s.
Key Notes:
- Softer Dollar
- Possible retest of 3370s
- Watch for potential breaks of 3400
This remains a tactically driven setup. Manage risk appropriately and stay alert for any renewed political developments.
